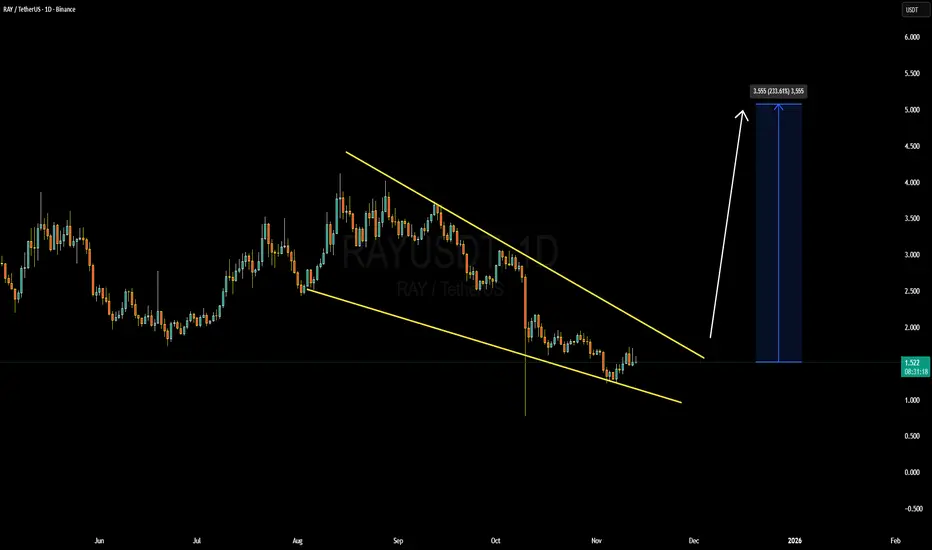
RAYUSDT 1D#RAY is moving inside a falling wedge pattern on the daily chart. Enter this coin only after a clean breakout above the wedge. In that case, the potential targets are:
🎯 $1.406
🎯 $1.704
🎯 $1.945
🎯 $2.186
🎯 $2.528
⚠️ Always remember to use a tight stop-loss and maintain proper risk management.
Market insights

RAYUSDT 12H#RAY is pressing the descending resistance on the 12H chart, and it has even formed a double-bottom pattern. Both the RSI and MACD are bullish as well. With all these factors combined, the probability of breaking above the descending resistance has increased. So keep an eye on it. In case of a breakout, the targets are:
🎯 $1.256
🎯 $1.347
🎯 $1.437
🎯 $1.565
🎯 $1.728
⚠️ Always remember to use a tight stop-loss and maintain proper risk management.

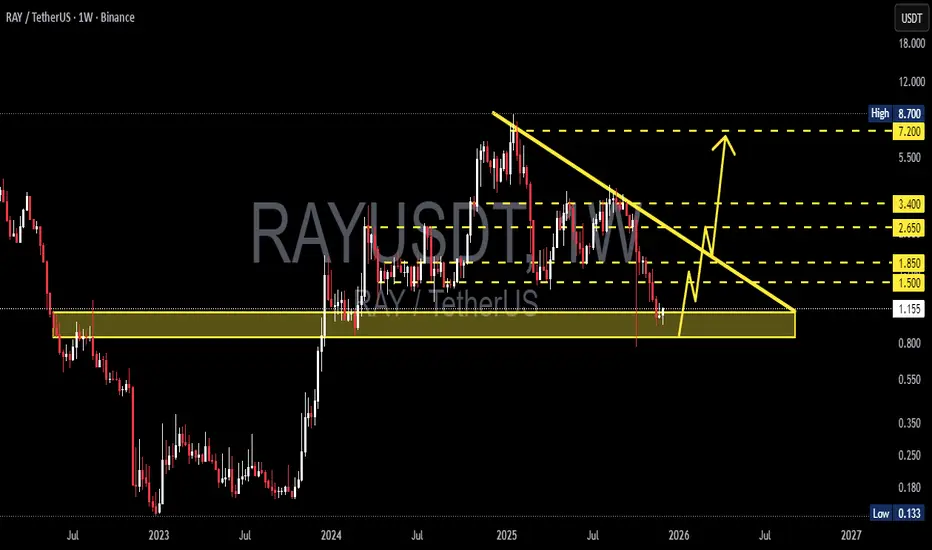
RAY/USDT – Major Decision Zone at $0.85–$1.10RAY has returned to the same demand zone that triggered every major rally over the past 2 years.
Hold this zone = potential multi-month reversal.
Lose this zone = structural breakdown.”
---
Pattern & Market Structure Explanation
The weekly chart of RAY/USDT is showing one of the clearest macro setups:
1. Multi-Month Descending Triangle (Strong Bearish Pressure)
A clean series of lower highs forming a dominant descending trendline.
This trendline has rejected every bullish attempt since mid-2024 — clear seller dominance.
2. Titanium Demand Zone: $0.85–$1.10
This zone has been the launchpad of every major RAY rally in 2022, 2023, and 2024.
Every touch of this area resulted in strong upside acceleration.
Price is now retesting it again…
This is the most important test for RAY’s macro trend heading into 2025–2026.
3. Liquidity Sweeps Are Appearing
Sharp wicks below the zone followed by rapid rejections upward.
This behavior is typical before a major direction shift — markets clean liquidity first.
Suggests big positions are being prepared beneath the surface.
---
Bullish Scenario – If This Zone Holds, a Major Reversal Can Begin
Bullish Confirmation Triggers:
Weekly close back above $1.15–$1.20.
Breakout above the descending trendline (major signal).
Increasing buying volume during the breakout.
Upside Targets:
1. $1.50 – Early resistance & first momentum checkpoint.
2. $1.85 – Trend structure recovery.
3. $2.65 – Mid-range target if momentum sustains.
4. $3.40 – Strong resistance where larger moves often stall.
5. $7.20–$8.70 – Long-term targets if a macro breakout unfolds.
Bullish Narrative:
If this demand zone holds, we might not be looking at a minor bounce —
this could be the beginning of a fresh multi-month bullish impulse.
---
Bearish Scenario – If Support Breaks, the Structure Shifts Completely
Bearish Confirmation Triggers:
Weekly close below $0.85.
No quick reclaim on the following weekly candle.
Strong selling volume on the breakdown.
Downside Targets:
$0.55 – First structural support.
$0.35 – High liquidity area.
$0.133 – Historical low (capitulation zone).
Bearish Narrative:
If this long-term support finally breaks, RAY enters a new phase of macro weakness.
Demand is absorbed, and price enters an extended redistribution cycle.
---
Core Insight: “The Last Support”
The $0.85–$1.10 zone is not just a level — it is the foundation of RAY’s macro structure.
At this zone:
Smart money typically positions
Liquidity concentrates
Market sentiment is tested
Breakdown = major shift in long-term trend.
Hold + trendline breakout = potential start of a new bullish cycle.
This is why this zone is the single most important area on RAY’s chart in the past 2 years.
---
#RAY #RAYUSDT #CryptoAnalysis #CryptoOutlook #TechnicalAnalysis #DescendingTriangle #DemandZone #Altcoins #PriceAction #CryptoTrading
RAYUSDT Forming Falling WedgeRAY/USDT looks like it’s entering a pivotal phase right now. Technically, the price has been consolidating after a corrective pull-back, and what I’m watching is whether RAY can break above its recent consolidation high with volume supporting the move. The project sits within a high-visibility niche—decentralized exchange infrastructure on the Solana chain—where AMM + order book, deep liquidity, and protocol buy-backs are high-search keywords. On the fundamentals, RAY is benefiting from renewed interest thanks to increased token staking, reduced circulating supply via buy-backs, and a strong ecosystem growth posture.
From a strategic viewpoint, a clean breakout above resistance and confirmation with volume would be the trigger for me. If RAY closes above resistance and holds it, the next move could carry upside momentum. The reward potential looks favorable given the combination of structural base plus thematic strength in the Solana-DeFi space. Risk control is essential, so placing a stop just below the recent consolidation low or major support would allow a defined risk-to-reward.
Fundamentally, the token maps into current crypto market themes that are heavily trafficked: DEX dominance, Solana ecosystem expansion, tokenomics with buy-back, and staking rewards. Investors appear to be increasingly interested again, as on-chain metrics and trading volume suggest increased engagement. That alignment between narrative and structure adds weight to the bullish thesis.
RAYSOL is bullish (1H)From the point marked as start on the chart, it appears that a bullish diametric pattern has formed, showing strong upward movements. We will wait for wave e to complete, and at the end of wave f, we’ll look to enter a buy/long position to capture wave g.
Given the strength of the bullish legs, taking a sell/short position could be risky — we’re only looking for buy/long setups.
Targets are indicated on the chart.
A 4-hour candle close below the invalidation level will invalidate this analysis.
For risk management, please don't forget stop loss and capital management
When we reach the first target, save some profit and then change the stop to entry
Comment if you have any questions
Thank You

RAYUSDT 2D#RAY is moving inside a descending triangle on the 2-day chart. Consider buying here and on the support zone. In case of a bounce, the potential targets are:
🎯 $2.380
🎯 $2.939
🎯 $3.391
🎯 $3.844
🎯 $4.488
🎯 $5.308
⚠️ Always remember to use a tight stop-loss and maintain proper risk management.

RAY/USDT — Critical Point: Accumulation or Breakdown New Lows?RAY is currently sitting at one of the most crucial structural zones, around the major support area of $1.50 – $1.96 (yellow box).
This area has acted as a key price pivot since mid-2024, where buyers and sellers have continuously battled for control.
After a sharp correction from the 2025 peak, price managed to hold above the main demand zone, with a long downside wick signaling liquidation or stop-hunt followed by immediate buying pressure.
This kind of reaction often represents a potential spring phase before a major trend reversal — if confirmed by a strong weekly close above support.
---
Structure & Pattern Analysis
Range Base / Accumulation Zone: The yellow block ($1.5 – $1.96) acts as a potential accumulation base, resembling a Wyckoff Accumulation pattern, where the spring phase (wick below support) might have just occurred.
Lower High Structure: The current structure still shows lower highs, but a confirmed higher low above $1.9 could signal a major trend reversal.
Key Resistance Levels: 2.72 – 3.67 – 7.25 – 12.68 – 16.66 – 17.80
→ These are progressive resistance targets for any mid-term bullish move.
---
Bullish Scenario
If RAY manages to close the weekly candle above $1.96 and hold, it would confirm:
A reclaim of the major demand zone.
Validation of the Wyckoff spring phase (accumulation completed).
The beginning of a mid-term trend reversal toward higher targets.
Bullish Targets:
1️⃣ $2.72 → First resistance / breakout trigger.
2️⃣ $3.67 → Range breakout confirmation.
3️⃣ $7.25 → Mid-term target zone (previous supply level).
A breakout with strong volume above $3.67 would likely trigger a larger markup phase, indicating the start of a new bullish cycle.
---
Bearish Scenario
If price fails to hold and closes weekly below $1.50, it would mean:
The main structural support has broken down.
Selling pressure could intensify toward $1.00 – $0.60.
In an extreme case, price might revisit its historical liquidity zone around $0.13.
Bearish Confirmation Signs:
Weekly close < $1.50.
Consecutive lower closes without recovery.
High-volume red candle (true capitulation, not just a sweep).
---
Technical Summary
RAY is standing at a macro decision zone — every upcoming weekly close will define whether:
The market is building a new base for the next bullish cycle,
or
Entering a continued bearish leg toward historical lows.
The area between $1.5–$1.9 is the “make or break zone.”
As long as the price doesn’t close below it, the mid-term bullish structure remains valid.
---
Trading Notes
Strong rejection candles within support = potential swing-buy opportunities (tight SL below wick).
Breakout above 2.72 with strong volume = confirmation for mid-term re-entry.
Be cautious of fakeouts — always wait for weekly candle closes before confirming bias.
---
#RAYUSDT #Raydium #CryptoAnalysis #WeeklyChart #MarketStructure #CryptoTechnical #SwingTrade #Wyckoff #DeFi #SupportZone #PriceAction #TrendReversal #AltcoinSetup #TradingViewAnalysis

RAYSOLHello folks, first of all i wish you were safe and did not got liquidated by the market storm last week.
So analyze each token and after that analyze again in various time frames.
RAYSOL looks very promising but market uncertainty it will take some more days to try rebuild, so keep an eye on this project, target is pretty clear for the next 10 days.
i would not trade raysol on futures, just spot.
good luck to all
nfa

Long RAY at 2.674RAY is trading at the rising support of a wedge, while a potential bounce off the EMA50 on the BTC 4hr chart
Long entry - 2.674

Raydium lifting away form horizontal support RAY is in a nice uptrend that appears to be a retracement. With that said, an impulsive move attempt from the bears should be considered. Keep in mind, it could lead to a swing failure. Regardless, any dips are for accumulating as long as horizontal support is respected.

RAYUSDT UPDATE#RAY
UPDATE
RAY Technical Setup
Pattern : Bullish Falling Wedge Breakout
Current Price: $3.68
Target Price: $4.59
Target % Gain: 30.04%
Technical Analysis: RAY has broken its falling wedge resistance on the 4H chart, showing bullish momentum and continuation potential. The breakout is backed by higher lows, rising volume, and a strong push above the trendline, with upside projection toward $4.59.
Time Frame: 4H
Risk Management Tip: Always use proper risk management.
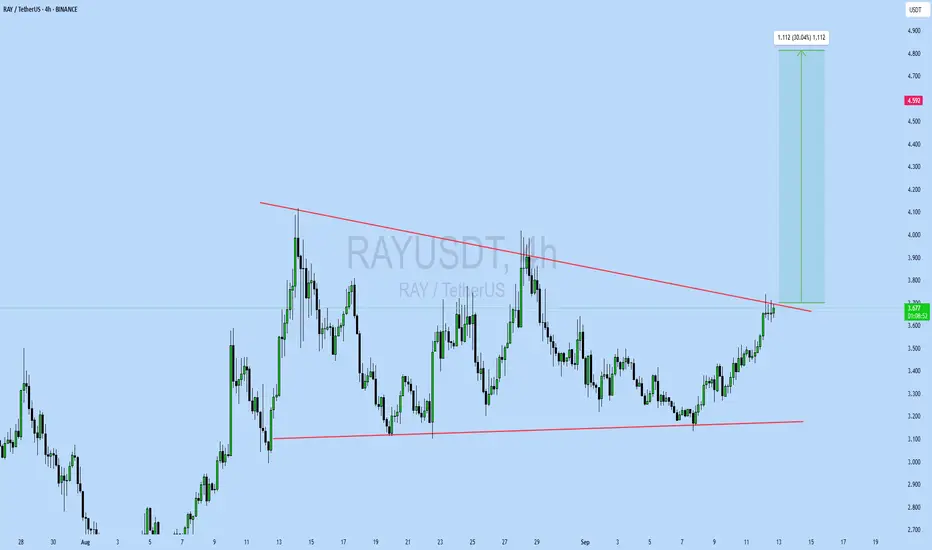
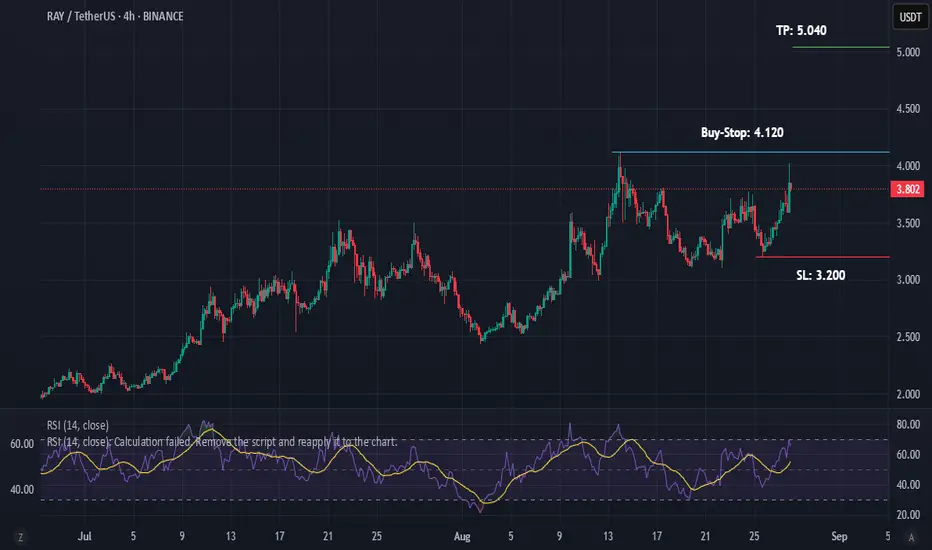
RAY/USDT Buy-Stop on 4H, No Bearish DivergenceThe price is range-bound, but once it gives a breakout, it could print new HHs and HLs.
No sign of Bearish Divergence on 4H timeframe.
Looks like a safe 1:1 Trade.
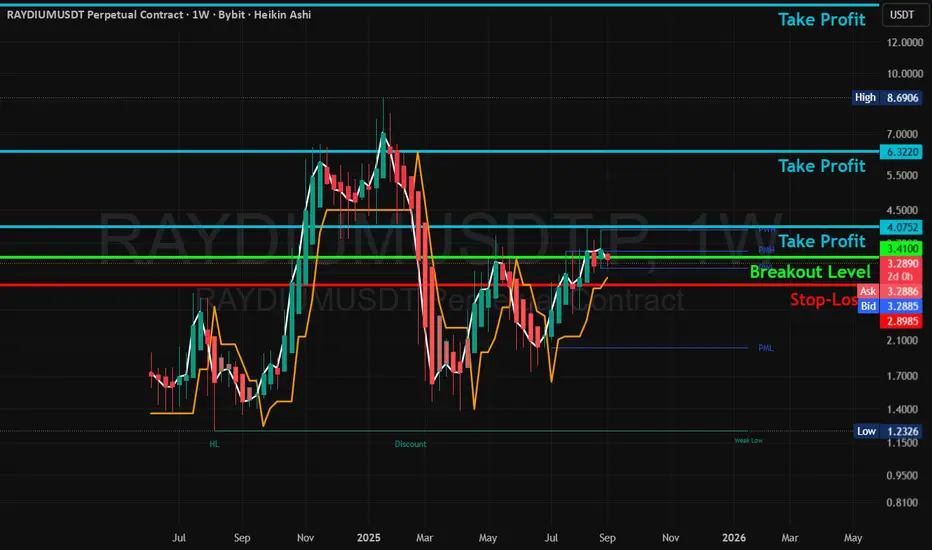
RAY/USDT (1W) — Weekly Breakout > 3.41 → 4.08 / 6.32 / 8.69 (SL Idea / Thesis
RAY is pressing into a multi-week resistance shelf after carving a higher-low structure on the weekly Heikin-Ashi chart. A clean weekly close above 3.41 (breakout line) would confirm continuation and invite a run on resting liquidity at prior highs. Failure to hold above that level risks a rotation back into the mid-range.
Trade Plan (trend-continuation long)
Trigger: Weekly close > 3.41, or intrawEEK break and successful retest of 3.41 as support.
Invalidation / Stop-Loss: 2.90 (below local structure & red stop band).
Targets:
TP1: 4.08 (near prior weekly high cluster / first resistance)
TP2: 6.32 (range shelf before broader supply)
TP3: 8.69 (prior major high)
Stretch: 12+ (macro take-profit marker on the chart)
Context & Levels
Consolidation under resistance with a sequence of higher lows; momentum turns constructive above 3.41.
Below 2.90, downside opens toward the mid-range; deeper pullbacks eye the discount area noted on the chart.
Risk Notes
Weekly timeframe = slower signals and larger swings. Consider scaling in on confirmation, taking partials at each TP, and trailing stops once TP1 is reached. Not financial advice—just my plan based on the plotted levels.

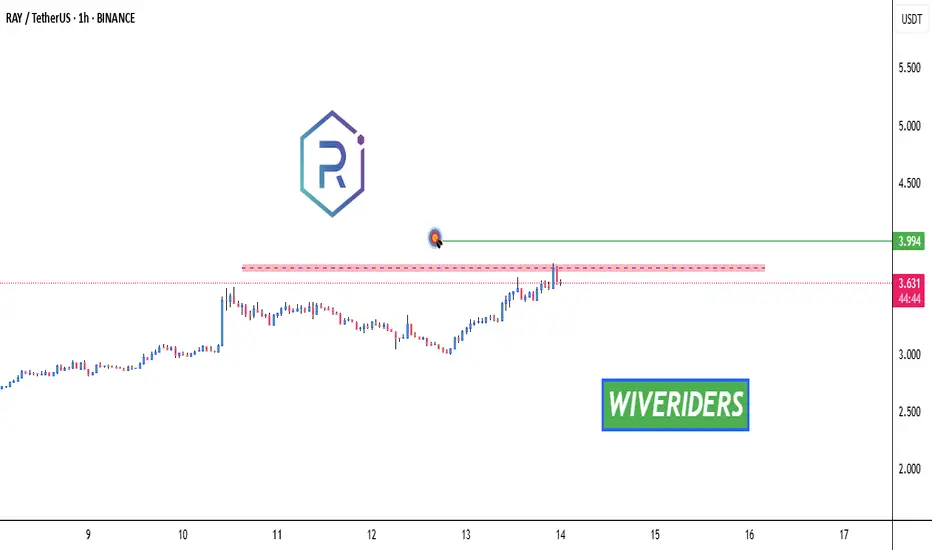
RAY Breakout Alert! NASDAQ:RAY Breakout Alert! 🚨
NASDAQ:RAY is currently testing the red resistance zone 🔴
If price breaks out, the first target will be the green line level 🎯
A confirmed breakout would signal bullish continuation and could push price higher ✅

RAY : razor edgeHello friends
Given the price growth we had, the price is now in a triangle, which is now in an important area in the triangle. If the price is supported and our triangle is broken, it can move to the identified resistance areas, which are price pivots.
But if the support breaks and the price falls, the identified important supports can be the next price targets.
*Trade safely with us*

RAY Breakout Watch – Testing Red Resistance! 🚨 RAY Breakout Watch – Testing Red Resistance! 🔴⏳
RAY is currently testing the red resistance zone.
📊 If breakout confirms, the next move could target:
🎯 First Target → Green line level
A successful breakout could trigger bullish continuation.
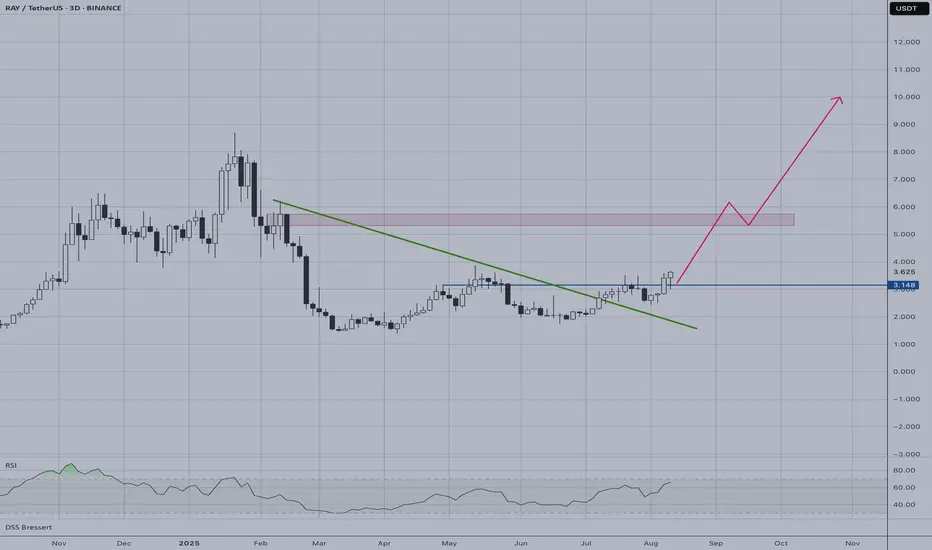
RAY | Rocket Ready to LaunchRAY appears primed for a potential rocket launch, having broken above a major descending trendline that has been suppressing price action since early 2025. The breakout is accompanied by strong bullish momentum and the RSI showing renewed strength after months of consolidation.
Key Technical Signals:
• Clean break above long-term resistance trendline
• Price trading above current support zone around $3.14
• RSI indicating bullish momentum building
• Volume profile suggests accumulation phase complete
Potential Targets:
• First resistance zone: $5.50-$6.00 (marked red box)
• Extended target: $10.00+ following the projected path
Risk Considerations:
A failure to hold above the broken trendline (around $2.80-$3.00) would invalidate this bullish setup.
Buy Trade Strategy for RAY: Fueling Solana DeFi and LiquidityDescription:
This trading idea is centered on RAY, the native token of Raydium, a leading automated market maker (AMM) and liquidity provider built on the Solana blockchain. RAY powers a platform that offers lightning-fast trades, deep liquidity pools, and seamless integration with the wider Solana DeFi ecosystem. As Solana continues to expand its network of decentralized applications, Raydium benefits from increased user activity and transaction volume. RAY also plays a key role in governance, staking rewards, and incentivizing liquidity, making it a vital asset within one of the fastest-growing DeFi environments.
Despite its strong fundamentals, the cryptocurrency market remains highly volatile, with factors such as network performance, regulatory developments, and macroeconomic conditions influencing price movements. Trading RAY requires careful consideration of risks and sound portfolio management.
Disclaimer:
This trading idea is provided for educational purposes only and should not be considered financial advice. Investing in cryptocurrencies like RAY carries significant risk, including the possibility of losing your entire investment. Always conduct your own research, evaluate your risk tolerance, and consult with a qualified financial advisor before making any investment decisions. Past performance is not indicative of future results.

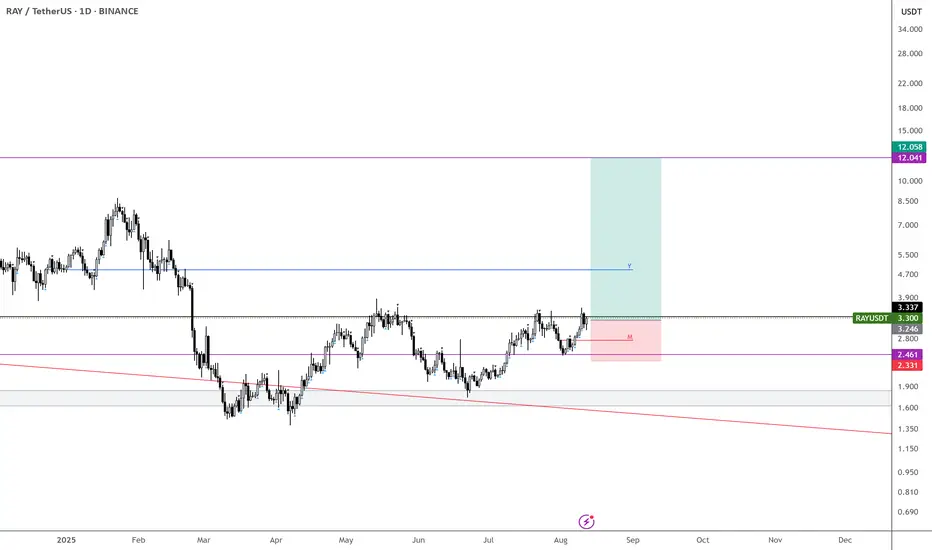
$RAY – Double Digits in Sight
This time, I’m aiming for double digits.
Missed it on the last run, but this setup looks far more likely to deliver.
Accumulating from here down to $2.70 — price has respected every key level perfectly.
Target: $12 … see you there. NASDAQ:RAY BINANCE:RAYUSDT
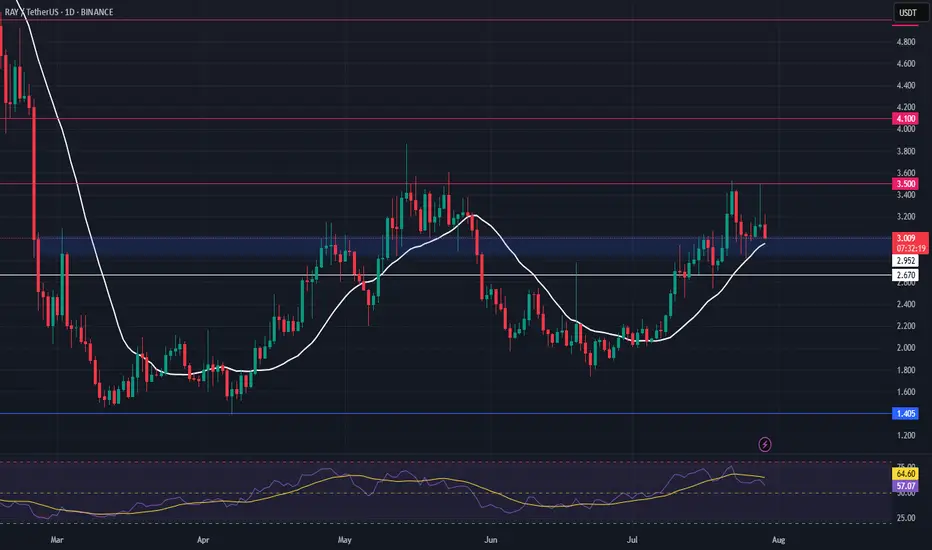
RAY Swing Trade – Key Support Retest in PlayRAY is pulling back toward a major support zone, offering a solid opportunity to position for a bounce as market structure remains constructive.
📌 Trade Setup:
• Entry Zone: $2.85 – $3.02
• Take Profit Targets:
o 🥇 $3.50
o 🥈 $4.10
• Stop Loss: $2.67
$RAYUSDT Breakout: 146% PotentialNASDAQ:RAY just broke out of a major downtrend and flipped key resistance into support around $3.208 –$3.352.
If it holds, a move toward $8+ is on the cards, nearly
146% upside.
Momentum appears strong; watch for a clean retest and potential continuation.
DYOR, NFA

RAYUSDT – Spot Swing Buy RecommendationRAYUSDT – Spot Swing Buy Recommendation
Hello there,
If you're still wondering what to buy in 2025, keep in mind that previous recommendations like XRP, TRX, AAVE, LTC, HBAR, etc., have already passed their ideal buy zones. If you want to buy those, you’ll have to wait for a proper correction in the next 2-3 months.
For now, RAYUSDT is a great candidate. You can wait for a minor pullback to buy and hold for profit targets within 2025.
Trade Type: Spot Swing
Entry: $2.3 – $2.5, even $2.8 is acceptable. This is a long-term signal—a $0.5 difference is negligible.
Take Profit:
_Based on Weekly (W) peaks.
_Reference levels: $4, $5.8, and $9, with a strong preference to hold toward $9.
Timeframe: Be patient—this is a large timeframe play, expect 2-3 months to see real growth.
Market Insight:
_You did the right thing by not DCA during the downtrend.
_Buying in a falling market is like trying to stop an avalanche—not smart.
_Now that the snowball has hit the bottom and shattered, it’s time to climb.
RAYUSDT is in that stage—bottomed and ready for ascent.
