RDNT Falling Wedge Near Potential Reversal ZoneRDNT is forming a clear falling wedge after an extended bearish move. Price is printing lower highs and lower lows, but the range is contracting as both trendlines converge. This compression signals weakening bearish momentum rather than strong continuation.
Price is currently holding near the lowe
Related pairs

RDNTUSDT Forming Falling WedgeRDNTUSDT is forming a clear falling wedge pattern, a classic bullish reversal signal that often indicates an upcoming breakout. The price has been consolidating within a narrowing range, suggesting that selling pressure is weakening while buyers are beginning to regain control. With consistent volum

EDNTUSDT Forming Falling WedgeRDNTUSDT is forming a clear falling wedge pattern, a classic bullish reversal signal that often indicates an upcoming breakout. The price has been consolidating within a narrowing range, suggesting that selling pressure is weakening while buyers are beginning to regain control. With consistent volum

RDNT READY FOR REBOUNDRDNT technicals screaming bullish reversal 🚀 Guardian Fund (2026) on deck, protocol fees as black swan armor, DAO debating Q1 launch. Post-hack: 4/7 multisig, OpenZeppelin audits, real-time watchdogs, council bossing decisions. Gas down 30-70%, institutions incoming? 😏🛡️

RDNT is showing strengt!Hi, as you can see in the chart a strong green candle appears in weekly chart , volume is following, this could send Radiant capital higher. Manage your risk, this is a very risky trade, RDNT is a low low cap ( 40M ) price can be easily manipulated.

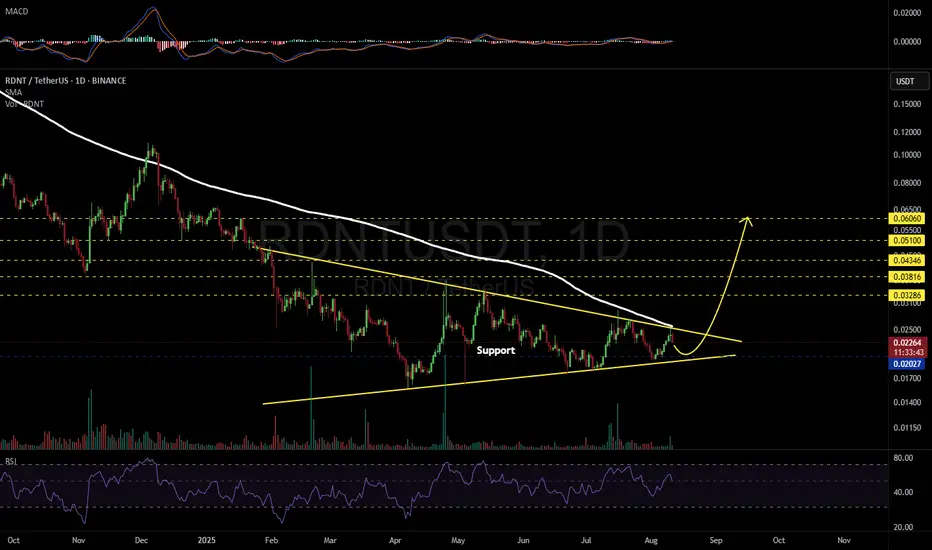
RDNTUSDT 1DWe can only turn bullish on #RDNT if it manages to break above both the daily SMA200 and the triangle resistance. If you plan to enter, consider buying a small bag near the support level of $0.02027.
In case of a breakout, the potential targets are:
🎯 $0.03286
🎯 $0.03816
🎯 $0.04346
🎯 $0.05100
🎯 $0
RDNT Looks Bullish (1D)The price is showing bullish signs at the bottom.
Higher lows have formed, a trigger line has been broken, and the price has created a bullish iCH. It is now also above the demand zone.
A buy/long position can be entered upon a pullback to the demand zone.
The main targets have been marked on the

$RDNT - Ready to fly?HIGH RISK
BINANCE:RDNTUSDT.P
NASDAQ:RDNT
The price recently broke out from the Inverted head and shoulder pattern, expecting the price to retest the yellow line.
Wait for the price action around the yellow line before entering it.
TP: Blue lines
SL: Redline / 4H CC below
Note: It'll be a

RDNT/USDT 4H Chart: Inverted Head and Shoulders? Hey traders! Let’s dive into this 4-hour RDNTUSDT chart.
Radient Capital is setting up a classic pattern that could signal a big move!
We’re seeing an inverted head and shoulders forming, with the price breaking above the resistance of Wedge around $0.2290. The "head" bottomed out near $0.1590

Radiant Capital: The Most Amazing Market Analyst In The WorldRadiant Capital is now up more than 100% since its 7-April bottom. It is still trading at bottom prices. Huge growth, high volume still bottom.
You can appreciate what I mean right?
The chart is easy.
By mentioning that a pair is still trading at bottom prices I mean to say that there is still ple

See all ideas
Summarizing what the indicators are suggesting.
Oscillators
Neutral
SellBuy
Strong sellStrong buy
Strong sellSellNeutralBuyStrong buy
Oscillators
Neutral
SellBuy
Strong sellStrong buy
Strong sellSellNeutralBuyStrong buy
Summary
Neutral
SellBuy
Strong sellStrong buy
Strong sellSellNeutralBuyStrong buy
Summary
Neutral
SellBuy
Strong sellStrong buy
Strong sellSellNeutralBuyStrong buy
Summary
Neutral
SellBuy
Strong sellStrong buy
Strong sellSellNeutralBuyStrong buy
Moving Averages
Neutral
SellBuy
Strong sellStrong buy
Strong sellSellNeutralBuyStrong buy
Moving Averages
Neutral
SellBuy
Strong sellStrong buy
Strong sellSellNeutralBuyStrong buy
Displays a symbol's price movements over previous years to identify recurring trends.
Frequently Asked Questions
The current price of RDNT / TetherUS (RDNT) is 0.01012 USDT — it has risen 3.12% in the past 24 hours. Try placing this info into the context by checking out what coins are also gaining and losing at the moment and seeing RDNT price chart.
RDNT / TetherUS price has risen by 9.50% over the last week, its month performance shows a −8.39% decrease, and as for the last year, RDNT / TetherUS has decreased by −82.85%. See more dynamics on RDNT price chart.
Keep track of coins' changes with our Crypto Coins Heatmap.
Keep track of coins' changes with our Crypto Coins Heatmap.
RDNT / TetherUS (RDNT) reached its highest price on Apr 15, 2023 — it amounted to 0.49600 USDT. Find more insights on the RDNT price chart.
See the list of crypto gainers and choose what best fits your strategy.
See the list of crypto gainers and choose what best fits your strategy.
RDNT / TetherUS (RDNT) reached the lowest price of 0.00361 USDT on Oct 10, 2025. View more RDNT / TetherUS dynamics on the price chart.
See the list of crypto losers to find unexpected opportunities.
See the list of crypto losers to find unexpected opportunities.
The safest choice when buying RDNT is to go to a well-known crypto exchange. Some of the popular names are Binance, Coinbase, Kraken. But you'll have to find a reliable broker and create an account first. You can trade RDNT right from TradingView charts — just choose a broker and connect to your account.
Crypto markets are famous for their volatility, so one should study all the available stats before adding crypto assets to their portfolio. Very often it's technical analysis that comes in handy. We prepared technical ratings for RDNT / TetherUS (RDNT): today its technical analysis shows the neutral signal, and according to the 1 week rating RDNT shows the sell signal. And you'd better dig deeper and study 1 month rating too — it's sell. Find inspiration in RDNT / TetherUS trading ideas and keep track of what's moving crypto markets with our crypto news feed.
RDNT / TetherUS (RDNT) is just as reliable as any other crypto asset — this corner of the world market is highly volatile. Today, for instance, RDNT / TetherUS is estimated as 2.08% volatile. The only thing it means is that you must prepare and examine all available information before making a decision. And if you're not sure about RDNT / TetherUS, you can find more inspiration in our curated watchlists.
You can discuss RDNT / TetherUS (RDNT) with other users in our public chats, Minds or in the comments to Ideas.