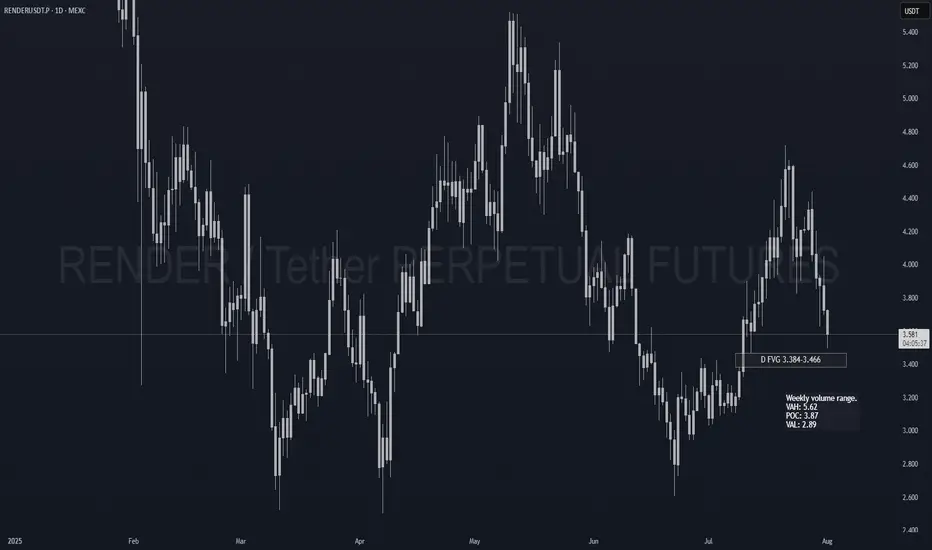
RENDER Spot Re-add PlanAlready holding Render as my biggest spot bag. Just setting clean limit orders to compound on weakness.
📍 Limit Orders (laddered):
• 3.45 → Daily FVG top (40%)
• 2.95 → Weekly VAL zone (40%)
• 2.55 → Deep HTF discount (20%)
Long term hold. Pure add-on entries.
DISCLAIMER:
I am not providing finan
RNDR/USDT at a Critical Turning Point: Golden Pocket as the Key?✨ Overview:
Render Token (RNDR) is currently testing a crucial support zone — the Golden Pocket Fibonacci Retracement between 0.5 (3.616) and 0.618 (3.385). This zone not only represents a significant retracement level but has historically acted as a strong demand area, often serving as a springboa

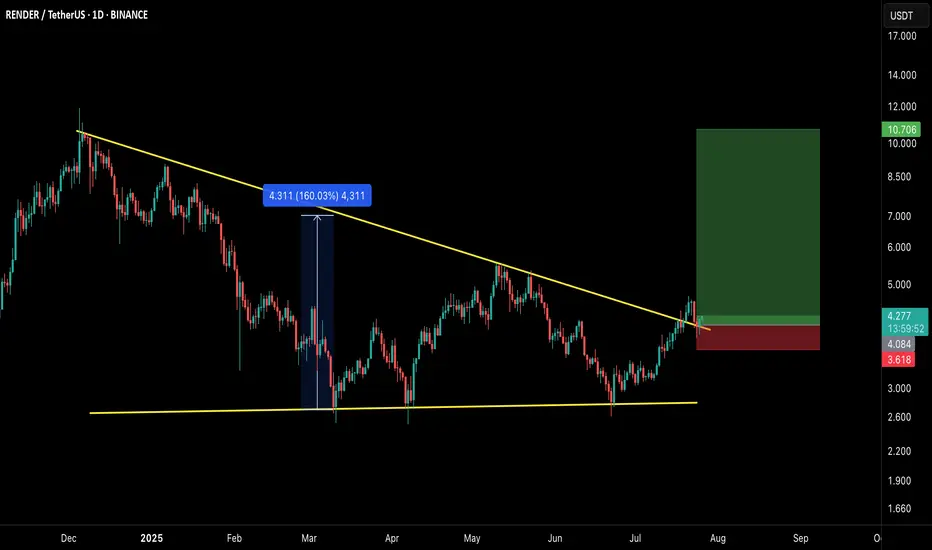
$RNDR/USDT – Breakout Setup Alert!RNDR has officially broken out of the long-standing descending trendline, confirming a bullish reversal structure. This breakout comes after a sustained consolidation phase and successful retest, indicating strength in buyer momentum.
🔍 Technical Breakdown:
Descending triangle breakout confirmed
Pr
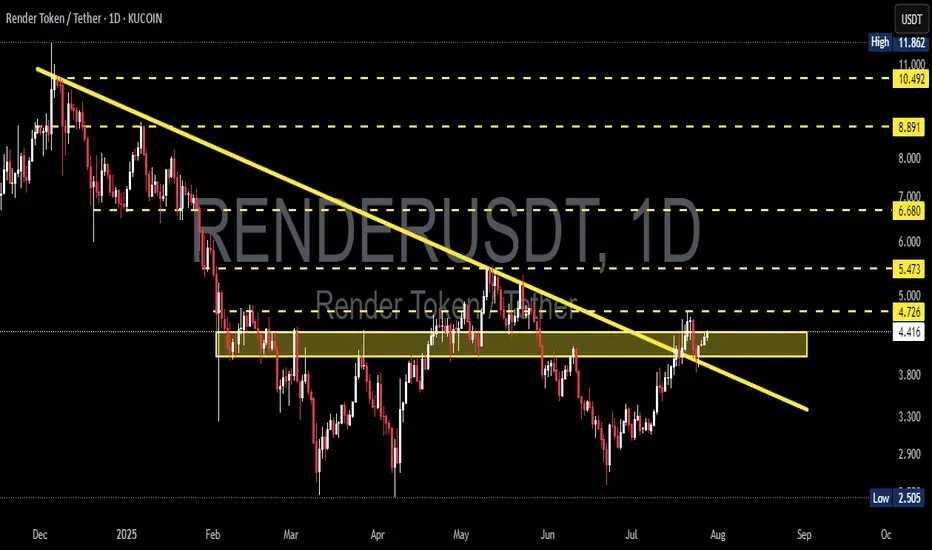
RENDERUSDT Breaks Major Downtrend – Will Bulls Sustain!🧠 Market Context & Structure:
RENDERUSDT is currently presenting one of the most technically compelling setups in recent months. After enduring a prolonged downtrend since late 2024, price action has finally broken above the major descending trendline that has acted as dynamic resistance for over 7
Crypto market review [UPD]: set-ups in BTC and alt-coinsMade a quick video going over some of the setups I see developing in Bitcoin and a few altcoins I personally track and trade.
Thank you for your attention and I wish you successful trading decisions!
If you’d like to hear my take on any other coin you’re following — feel free to ask in the comment

RNDR 1H – Post-Dump Range Established, Still Below Key MidpointRNDR has entered a clear consolidation range following a sharp 24.5% decline over 5 days. Price is currently holding above the range low at $3.35, but remains below the midpoint at $3.88 — a level that typically acts as a key decision point in range-bound markets.
The structure is well-defined:
– R

RENDER gaining momentum As it reclaimed the 89 EMA and now it's acting as support, it might retest it once more before moving up to reclaim EMA 200
So I would say RENDER is gaining momentum again into the upper direction after showing a strong support on the green zone from the chart.
DYOR / NAFA

renderusdt slept onits down in the dumps but i just threw 4 bands in it
1its in a inverse head and shoulders its breaking out as we speak looks beautiful
bullish divergance
2 i love when no one is talking about a coin thats when i like to buy might bw 4 months before i really see some action
3ai is super hot right

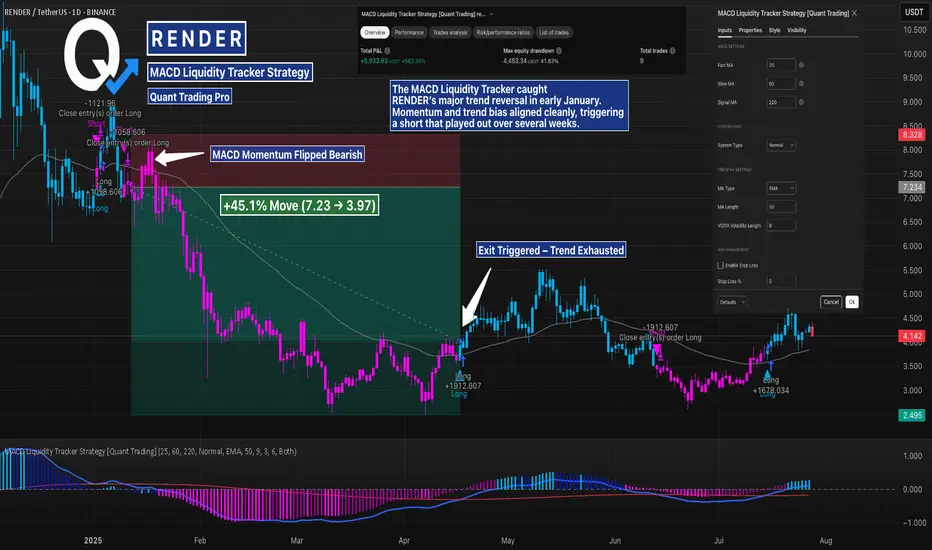
RENDER MACD Liquidity Tracker Strategy – Trend Reversal Catch 1DThis RENDER 1D chart highlights how the MACD Liquidity Tracker Strategy detected a major trend reversal in early 2025. A short was triggered around $7.23, right as MACD momentum flipped bearish and the 60/220 EMAs confirmed downside bias. The position was held until structure and momentum flattened
Render | $$$ | Target: 5.50This technical analysis is for informational and educational purposes only. It does not constitute financial advice. Remember to always research and consult with a professional before making investment decisions. Good luck! 📈💼🚀

See all ideas
Summarizing what the indicators are suggesting.
Oscillators
Neutral
SellBuy
Strong sellStrong buy
Strong sellSellNeutralBuyStrong buy
Oscillators
Neutral
SellBuy
Strong sellStrong buy
Strong sellSellNeutralBuyStrong buy
Summary
Neutral
SellBuy
Strong sellStrong buy
Strong sellSellNeutralBuyStrong buy
Summary
Neutral
SellBuy
Strong sellStrong buy
Strong sellSellNeutralBuyStrong buy
Summary
Neutral
SellBuy
Strong sellStrong buy
Strong sellSellNeutralBuyStrong buy
Moving Averages
Neutral
SellBuy
Strong sellStrong buy
Strong sellSellNeutralBuyStrong buy
Moving Averages
Neutral
SellBuy
Strong sellStrong buy
Strong sellSellNeutralBuyStrong buy
Displays a symbol's price movements over previous years to identify recurring trends.