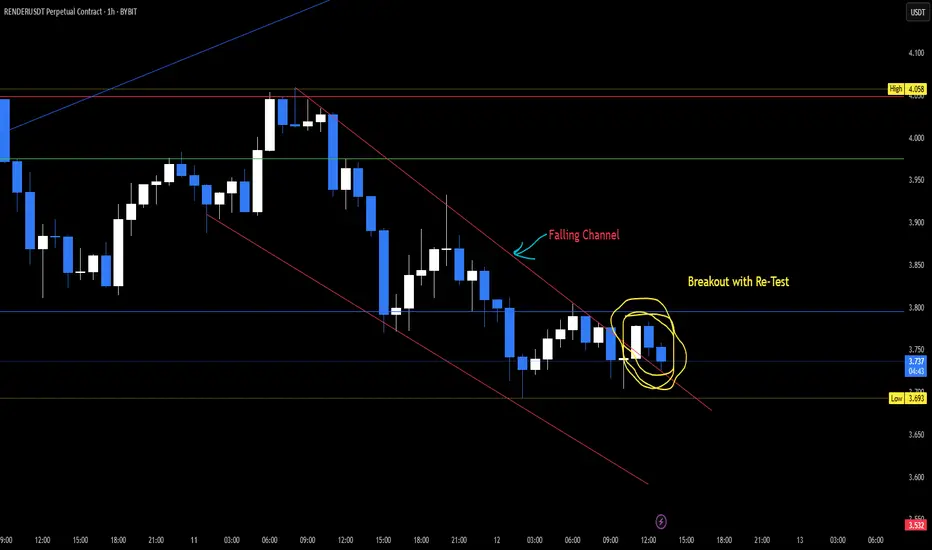
RENDER BreakoutI saw the breakout and retest of the descending channel, so the price might continue up from here at least to the previous high trying to break the resistance again.
NOT AN ADVICE. For educational and experimental purpose only.
RENDER Approaching Key Support – Swing Trade OpportunityRENDER is currently retracing and approaching a significant support zone, offering a potential long swing trade setup. This level has historically acted as a demand area, and price action around it could provide a favorable risk-to-reward entry.
💰 Entry Zone: $3.280 – $3.030
🎯 Targets:
• TP1: $4.00

RENDER - SHORT TERM 7-9$, MIDDLE TERM 21$ AND LONG TERM 200$SUBSCRIBE, BOOST AND COMMENT IN ORDER TO GET HIGH QUALITY TECHNICAL ANALYSIS.
Firstly, our Algo-based indicators are used to create this analysis.
RENDER FOR 200$ NEXT YEAR?
YOU MIGHT NOT BELIEVE, BUT IT'S THE NATURE OF FRACTALS.

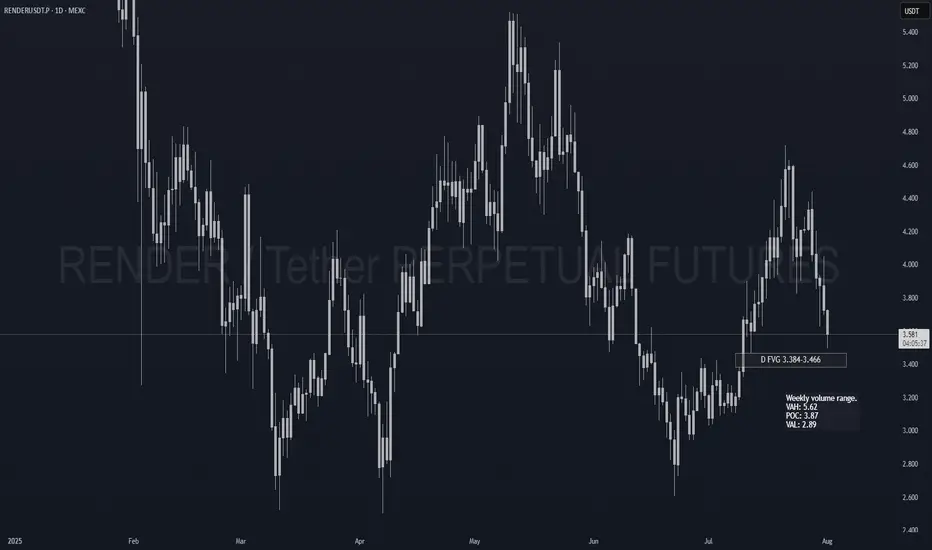
RENDER Spot Re-add PlanAlready holding Render as my biggest spot bag. Just setting clean limit orders to compound on weakness.
📍 Limit Orders (laddered):
• 3.45 → Daily FVG top (40%)
• 2.95 → Weekly VAL zone (40%)
• 2.55 → Deep HTF discount (20%)
Long term hold. Pure add-on entries.
DISCLAIMER:
I am not providing finan
RNDR/USDT at a Critical Turning Point: Golden Pocket as the Key?✨ Overview:
Render Token (RNDR) is currently testing a crucial support zone — the Golden Pocket Fibonacci Retracement between 0.5 (3.616) and 0.618 (3.385). This zone not only represents a significant retracement level but has historically acted as a strong demand area, often serving as a springboa

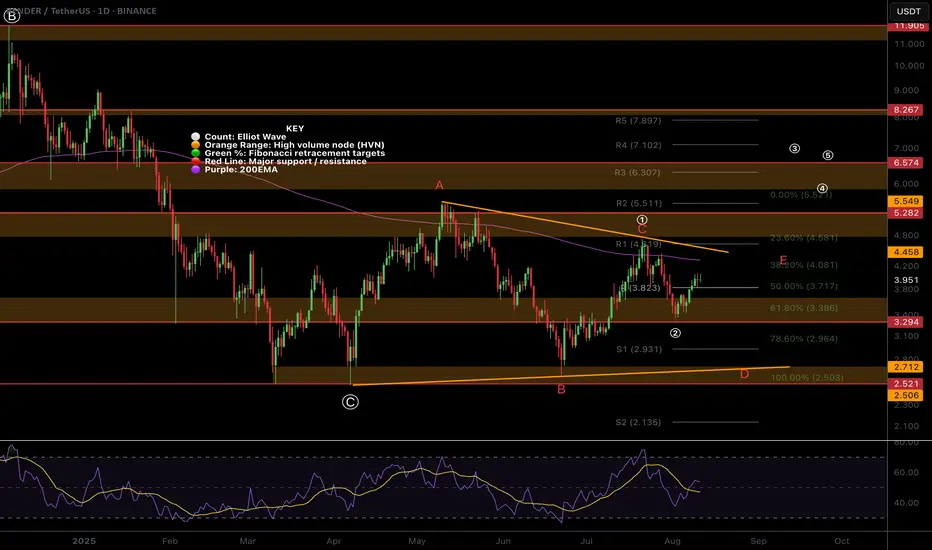
$RENDER bearish triangle or motif wave?I have 2 local Elliot Wave counts for CRYPTOCAP:RENDER the bearish triangle yet to complete wave D which would result in a final thrust down before a new macro uptrend and a (1) (2) with wave (3) started.
The overlapping and slow price action does not suggest RENDER is in a wave as it is not movi
XRP 4H Key Decision Point, Will Resistance Flip Into Support?RNDR is pressing into a key resistance zone near 3.90 while maintaining a higher low structure along its ascending trendline. The Stoch RSI is currently in overbought territory, hinting at a possible short-term pullback unless bulls can break through decisively. A breakout would open the path toward

RNDR 1H – Post-Dump Range Established, Still Below Key MidpointRNDR has entered a clear consolidation range following a sharp 24.5% decline over 5 days. Price is currently holding above the range low at $3.35, but remains below the midpoint at $3.88 — a level that typically acts as a key decision point in range-bound markets.
The structure is well-defined:
– R

RENDER gaining momentum As it reclaimed the 89 EMA and now it's acting as support, it might retest it once more before moving up to reclaim EMA 200
So I would say RENDER is gaining momentum again into the upper direction after showing a strong support on the green zone from the chart.
DYOR / NAFA

renderusdt slept onits down in the dumps but i just threw 4 bands in it
1its in a inverse head and shoulders its breaking out as we speak looks beautiful
bullish divergance
2 i love when no one is talking about a coin thats when i like to buy might bw 4 months before i really see some action
3ai is super hot right

See all ideas
Summarizing what the indicators are suggesting.
Oscillators
Neutral
SellBuy
Strong sellStrong buy
Strong sellSellNeutralBuyStrong buy
Oscillators
Neutral
SellBuy
Strong sellStrong buy
Strong sellSellNeutralBuyStrong buy
Summary
Neutral
SellBuy
Strong sellStrong buy
Strong sellSellNeutralBuyStrong buy
Summary
Neutral
SellBuy
Strong sellStrong buy
Strong sellSellNeutralBuyStrong buy
Summary
Neutral
SellBuy
Strong sellStrong buy
Strong sellSellNeutralBuyStrong buy
Moving Averages
Neutral
SellBuy
Strong sellStrong buy
Strong sellSellNeutralBuyStrong buy
Moving Averages
Neutral
SellBuy
Strong sellStrong buy
Strong sellSellNeutralBuyStrong buy
Displays a symbol's price movements over previous years to identify recurring trends.