REQI’m expecting around 112% in gains for $REQ as long as support continues to hold. Price is compressing nicely, and within the next 250 days, a breakout to the target looks likely. Maintaining this support zone is key for the setup to fully play out.
Related pairs

REQ Market Update📊 $REQ Market Update
$REQ has formed an ascending triangle 🔺 and already broke out ✅
👉 Next steps:
First target: blue line level 🎯
Second target: higher blue line level 🎯
👉 If buyers keep pushing, price could continue its bullish move 🚀
⚡ Manage your trade — trail stop-loss as price moves.

Seizing the $REQ Turnaround: A Detailed 4-Hour Chart BreakdownBINANCE:REQUSDT
Seizing the $REQ Turnaround: A Detailed 4-Hour Chart Breakdown
Price Action Description
Historical Trend: The price started around 0.18-0.20 USDT in late August, with a gradual decline punctuated by choppy movements. A sharp drop occurred in early September, pushing it toward 0.1
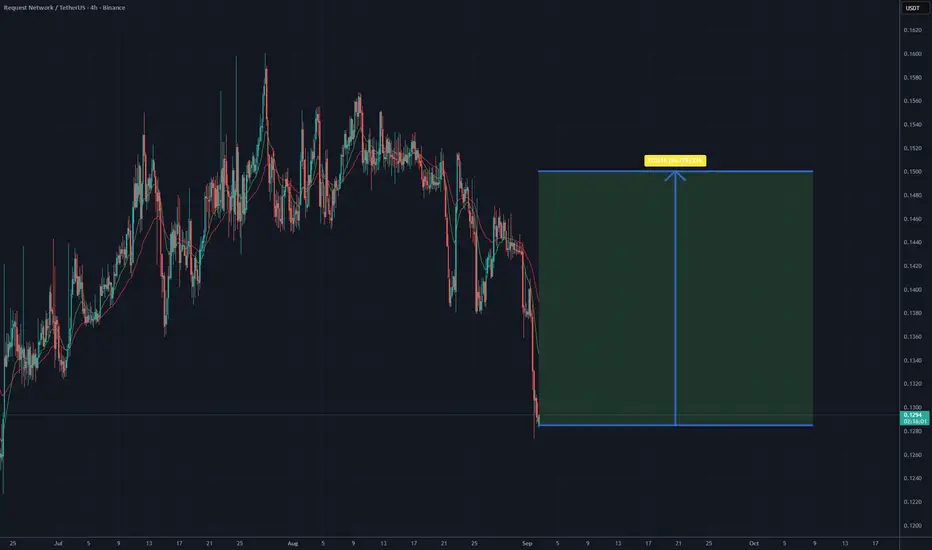
Is it a time for REQUSDT? Potential target 0.15 - 16 % On the Request Network / USDT (4h, Binance) chart, we can see a strong downward move that pushed the price towards the $0.128 area, where a first buying reaction is appearing. This level coincides with a local support zone that has previously stopped declines multiple times.
Key points to note:
Th
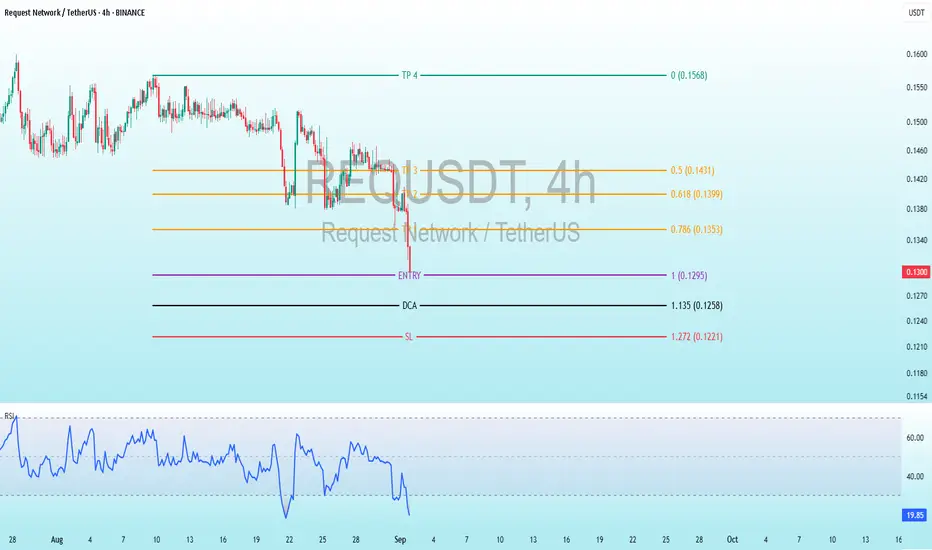
#REQ Possibile Mega BullishBINANCE:REQUSDT
#REQUSDT 🟢 Long (1H)
➡️ RSI 14: 16.89
💵 Entry Price: 0.1365$
📉 DCA Price: 0.1297$
🛑 Stop Loss: 0.1232$
🎯 Take Profit: 0.1502$ (+10.0%)
⚡ Scalp Target: 0.1433$ (+5.0%)
⏰ Updated: 2025-08-31 16:00

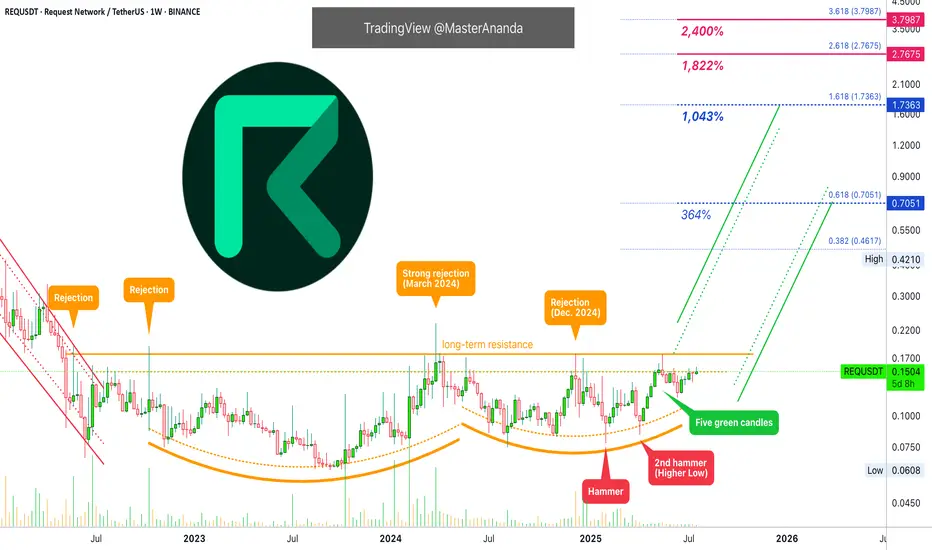
Request Network Has 1,800% Potential for Growth (Lev. Setup)This is a chart setup that I am opening with leverage. It is not available on many exchanges and this reduces risk for swings and shakeouts. The action has been strong.
Request Network (REQUSDT) produced a strong higher low in June compared to February and April this year. Many pairs produced doubl
#REQ/USDT#REQ
The price is moving within a descending channel on the 1-hour frame, adhering well to it, and is heading for a strong breakout and retest.
We are seeing a bounce from the lower boundary of the descending channel, which is support at 0.1367.
We have a downtrend on the RSI indicator that is ab

Request Network Long-Term Resistance & New ATH (PP: 1195%)The previous three weeks all closed green and were perfect full bodied candles. This is a strong signal on its own. But REQUSDT (Request Network) didn't print this signal in isolation, it is coming after a hammer candlestick pattern which is also a short-term and long-term higher low. Makes sense?

REQUSDT is BullishPrice was in a downtrend, however now it seems to be in accumulation phase, as bulls are trying to assume control of the price action after the mergence of bullish RSI divergence on hourly time frame. Price has also made a double bottom further hinting a bullish reversal. If previous lower high is b

REQUSDT Analysis: A Beautiful Range, Tremendous OpportunityFolks, REQUSDT is in a beautiful range , truly fantastic. Let me tell you, the blue box reactions here are worth considering. Smart trading starts with smart zones, and this one? It's a winner.
Here’s What You Need to Know:
The Range: It’s solid, it’s reliable, and it’s where the action is

See all ideas
Summarizing what the indicators are suggesting.
Oscillators
Neutral
SellBuy
Strong sellStrong buy
Strong sellSellNeutralBuyStrong buy
Oscillators
Neutral
SellBuy
Strong sellStrong buy
Strong sellSellNeutralBuyStrong buy
Summary
Neutral
SellBuy
Strong sellStrong buy
Strong sellSellNeutralBuyStrong buy
Summary
Neutral
SellBuy
Strong sellStrong buy
Strong sellSellNeutralBuyStrong buy
Summary
Neutral
SellBuy
Strong sellStrong buy
Strong sellSellNeutralBuyStrong buy
Moving Averages
Neutral
SellBuy
Strong sellStrong buy
Strong sellSellNeutralBuyStrong buy
Moving Averages
Neutral
SellBuy
Strong sellStrong buy
Strong sellSellNeutralBuyStrong buy
Displays a symbol's price movements over previous years to identify recurring trends.
Frequently Asked Questions
The current price of Request Network / TetherUS (REQ) is 0.1058 USDT — it has risen 0.09% in the past 24 hours. Try placing this info into the context by checking out what coins are also gaining and losing at the moment and seeing REQ price chart.
Request Network / TetherUS price has fallen by −0.93% over the last week, its month performance shows a −5.27% decrease, and as for the last year, Request Network / TetherUS has decreased by −3.29%. See more dynamics on REQ price chart.
Keep track of coins' changes with our Crypto Coins Heatmap.
Keep track of coins' changes with our Crypto Coins Heatmap.
Request Network / TetherUS (REQ) reached its highest price on Nov 26, 2021 — it amounted to 1.0990 USDT. Find more insights on the REQ price chart.
See the list of crypto gainers and choose what best fits your strategy.
See the list of crypto gainers and choose what best fits your strategy.
Request Network / TetherUS (REQ) reached the lowest price of 0.0608 USDT on Sep 11, 2023. View more Request Network / TetherUS dynamics on the price chart.
See the list of crypto losers to find unexpected opportunities.
See the list of crypto losers to find unexpected opportunities.
The safest choice when buying REQ is to go to a well-known crypto exchange. Some of the popular names are Binance, Coinbase, Kraken. But you'll have to find a reliable broker and create an account first. You can trade REQ right from TradingView charts — just choose a broker and connect to your account.
Crypto markets are famous for their volatility, so one should study all the available stats before adding crypto assets to their portfolio. Very often it's technical analysis that comes in handy. We prepared technical ratings for Request Network / TetherUS (REQ): today its technical analysis shows the sell signal, and according to the 1 week rating REQ shows the sell signal. And you'd better dig deeper and study 1 month rating too — it's sell. Find inspiration in Request Network / TetherUS trading ideas and keep track of what's moving crypto markets with our crypto news feed.
Request Network / TetherUS (REQ) is just as reliable as any other crypto asset — this corner of the world market is highly volatile. Today, for instance, Request Network / TetherUS is estimated as 2.31% volatile. The only thing it means is that you must prepare and examine all available information before making a decision. And if you're not sure about Request Network / TetherUS, you can find more inspiration in our curated watchlists.
You can discuss Request Network / TetherUS (REQ) with other users in our public chats, Minds or in the comments to Ideas.