$REZ breakout alert!! AMEX:REZ breaking out of a strong downtrend!
After months of consolidation and lower highs, AMEX:REZ just flipped a major descending trendline resistance into support 💥
Now trading above it with strong momentum (+9.6%) and eyes set on the key targets:
📍 First Target: $0.0218
📍 Second Target:

REZUSDT 2D#REZ has broken out of the falling wedge pattern to the upside on the 2-day chart and is now facing the 2-day MA50. In case of a successful bounce of the pattern and breakout above the 2-day MA50, the targets are:
🎯 $0.01928
🎯 $0.02362
🎯 $0.03109
🎯 $0.03713
🎯 $0.04316
⚠️ Use a tight stop-loss.

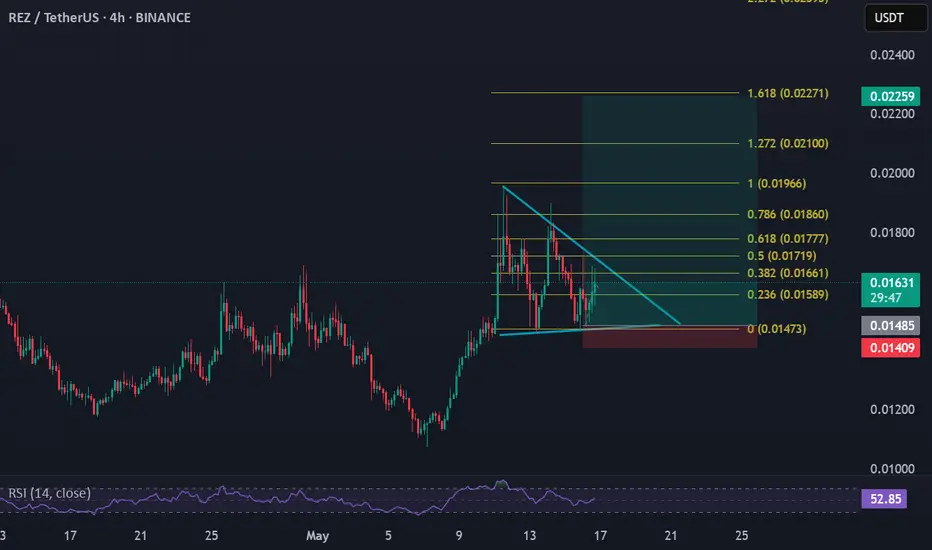
$REZ Reversal in Motion – Eyes on the Next Wave UpAMEX:REZ reversed major resistance into support upon coming out of a downtrend.
We are currently looking for a pullback towards the 0.618 Fib level at 0.015 before the next wave up.
The market structure is still bullish, and the chart is priming for an explosive breakout into $0.023+.
Keep alert

#REZ/USDT#REZ
The price is moving within a descending channel on the 1-hour frame, adhering well to it, and is on its way to breaking it strongly upwards and retesting it.
We are seeing a rebound from the lower boundary of the descending channel, this support at 0.01570.
We have a downtrend on the RSI indi

Waiting to explode $REZUSDTContinuation triangle for breakout BINANCE:REZUSDT ,
SL & Tp look at the chart
REZ 3D Setup – Classic Reversal Pattern in Play🔥 REZ – 3D Setup on Watch
📉 REZ is shaping up a falling wedge on the 3-day chart—a well-known bullish reversal pattern 🔍
A breakout from this structure could trigger strong upside momentum 🚀
👀 Keep this on your radar—the higher timeframe setup is starting to heat up!

REZUSDT 1D AnalysisREZ ~ 1D Analysis
#REZ Buy after successfully penetrating this resistant line with a short -term target of at least 10%+ from here.


REZUSDTTP 02083
Buy zone 0.01786 - 0.01822
SL 0.01755
it's bounce back from the strong support
Nice Project good for Long term always buy with STOP LOSS
Only Trade in SPOT.


See all ideas
Summarizing what the indicators are suggesting.
Oscillators
Neutral
SellBuy
Strong sellStrong buy
Strong sellSellNeutralBuyStrong buy
Oscillators
Neutral
SellBuy
Strong sellStrong buy
Strong sellSellNeutralBuyStrong buy
Summary
Neutral
SellBuy
Strong sellStrong buy
Strong sellSellNeutralBuyStrong buy
Summary
Neutral
SellBuy
Strong sellStrong buy
Strong sellSellNeutralBuyStrong buy
Summary
Neutral
SellBuy
Strong sellStrong buy
Strong sellSellNeutralBuyStrong buy
Moving Averages
Neutral
SellBuy
Strong sellStrong buy
Strong sellSellNeutralBuyStrong buy
Moving Averages
Neutral
SellBuy
Strong sellStrong buy
Strong sellSellNeutralBuyStrong buy
Displays a symbol's price movements over previous years to identify recurring trends.