RLCUSDT 3D#RLC is currently trading within a falling wedge pattern on the 3-day chart. Consider buying around the current level and near the support zone. In case of a breakout above the 3-day SMA50 and the wedge resistance, the potential upside targets are:
🎯 $1.059
🎯 $1.247
🎯 $1.543
🎯 $1.782
🎯 $2.020
🎯 $2.360
🎯 $2.793
⚠️ Always remember to use a tight stop-loss and maintain proper risk management.
Trade ideas

RLC BREAKING OUTAI + DATA + PRIVACY = BULLISH...Also, Now Every private transaction or computation on Arbitrum requires RLC tokens, directly increasing demand. The integration positions RLC as a critical privacy infrastructure token, attracting speculative buying

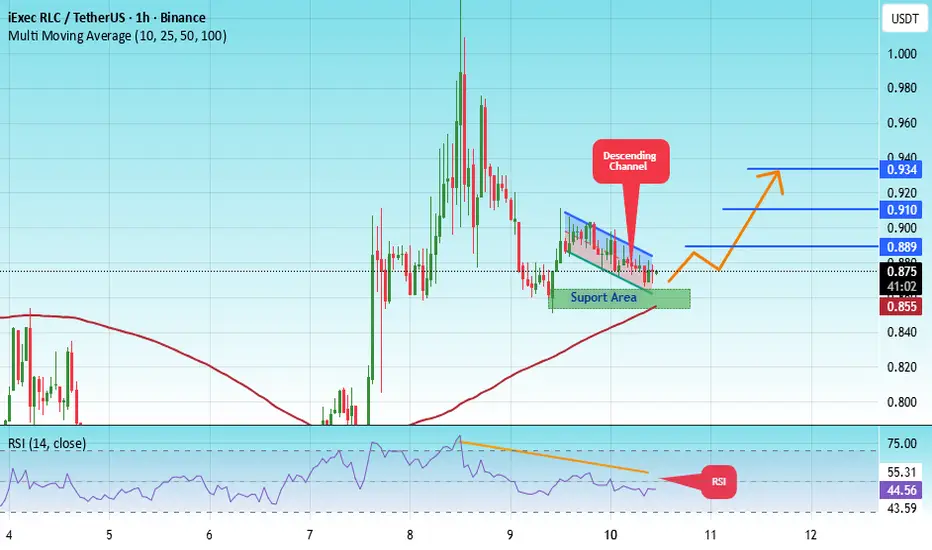
#RLC/USDT Pump Anticipated#RLC
The price is moving within an ascending channel on the 1-hour timeframe and is adhering to it well. It is poised to break out strongly and retest the channel.
We have a downtrend line on the RSI indicator that is about to break and retest, which supports the upward move.
There is a key support zone in green at the 0.860 price level, representing a strong support point.
We have a trend of consolidation above the 100-period moving average.
Entry price: 0.876
First target: 0.889
Second target: 0.910
Third target: 0.934
Don't forget a simple money management rule:
Place your stop-loss order below the green support zone.
Once you reach the first target, save some money and then change your stop-loss order to an entry order.
For any questions, please leave a comment.
Thank you.
RLC to All time High Possible???RLCusdt is providing a Good Spot entry for the upcoming weeks.
Possible rejection from here can send this massively to 5-7 and high chances of going into price Discovery after clearing 12-14 area.
Looks a very solid trade.
Setup is Buying DCA under 0.8800(current price).
Invalidation breaking below current support.(Negative 6-10%).
If holds here for while this can blow to high prices soon.
Note: Not a Financial advice.

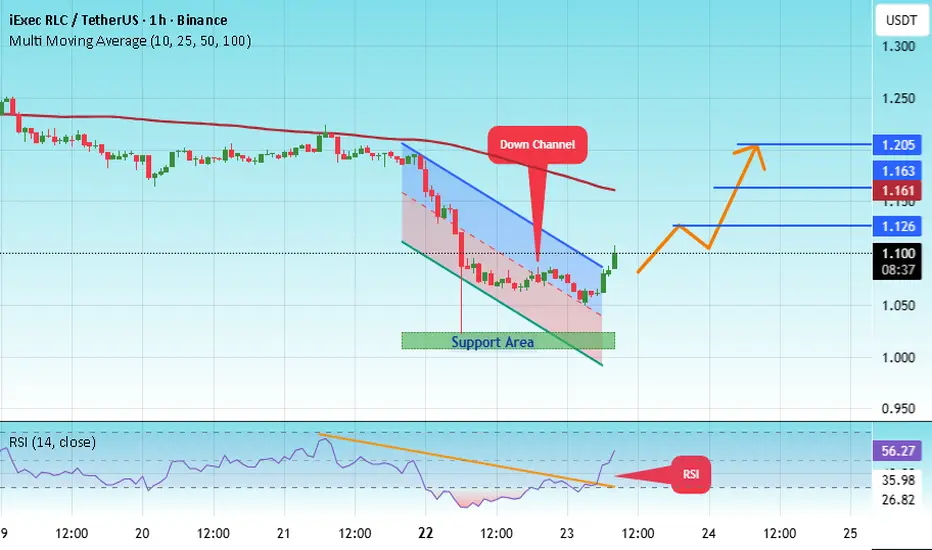
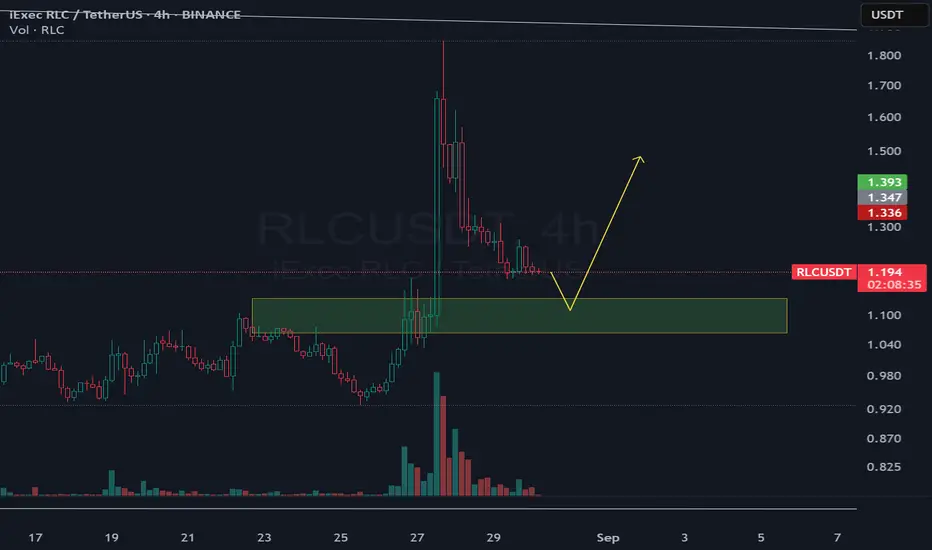
#RLC/USDT Pump Anticipated#RLC
The price is moving within a descending channel on the 1-hour frame, adhering well to it, and is heading for a strong breakout and retest.
We have a bearish trend on the RSI indicator that is about to be broken and retested, which supports the upward breakout.
There is a major support area in green at 1.01, representing a strong support point.
We are heading for consolidation above the 100 moving average.
Entry price: 1.10.
First target: 1.12.
Second target: 1.16.
Third target: 1.20.
Don't forget a simple matter: capital management.
When you reach the first target, save some money and then change your stop-loss order to an entry order.
For inquiries, please leave a comment.
Thank you.
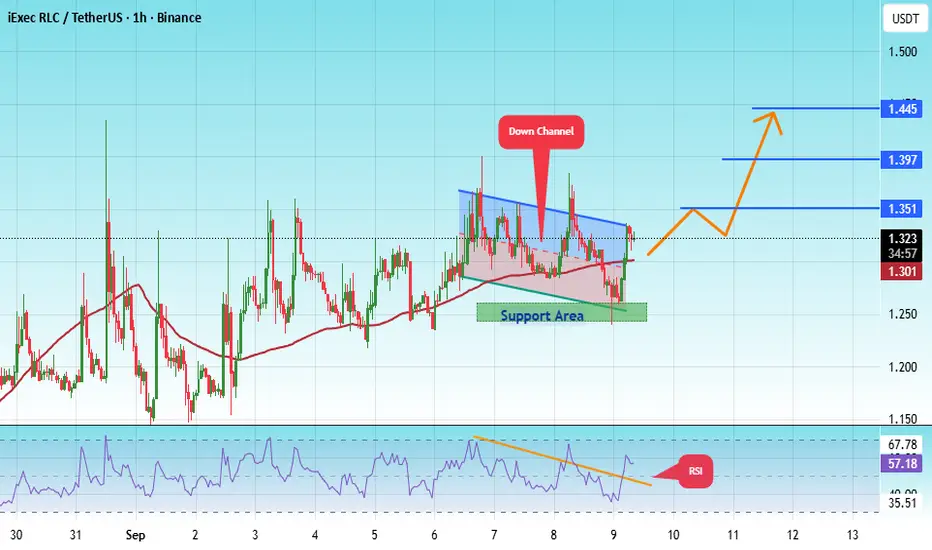
#RLC/USDT Pump Anticipated#RLC
The price is moving within a descending channel on the 1-hour frame, adhering well to it, and is heading for a strong breakout and retest.
We have a bearish trend on the RSI indicator that is about to be broken and retested, which supports the upward breakout.
There is a major support area in green at 1.25, which represents a strong support point.
For inquiries, please leave a comment.
We are in a consolidation trend above the 100 Moving Average.
Entry price: 1.32
First target: 1.35
Second target: 1.39
Third target: 1.44
Don't forget a simple matter: capital management.
When you reach the first target, save some money and then change your stop-loss order to an entry order.
For inquiries, please leave a comment.
Thank you.
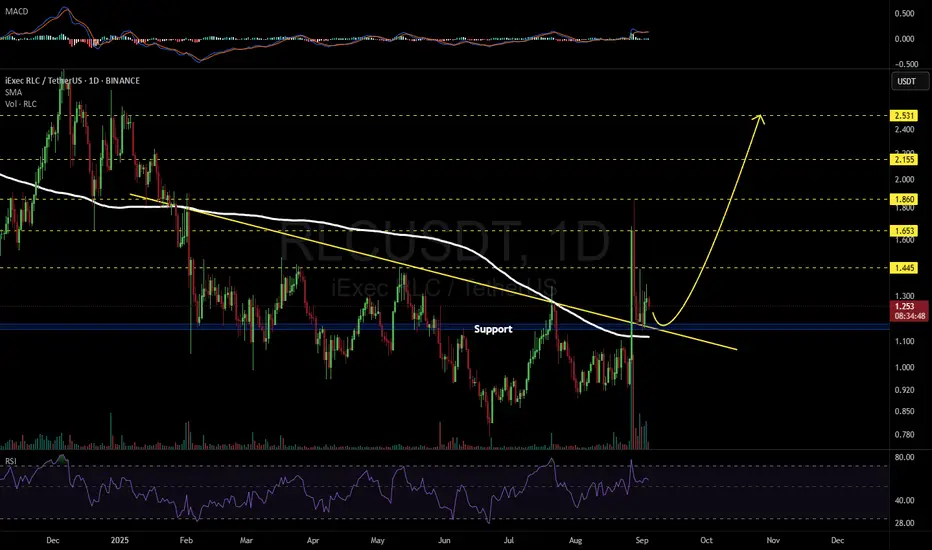
RLCUSDT 1D#RLC, after its strong rally, is still in a corrective phase and is expected to retest the descending support line. In case of a successful bounce, the potential targets are:
🎯 $1.445
🎯 $1.653
🎯 $1.860
🎯 $2.155
🎯 $2.531
⚠️ Always remember to use a tight stop-loss and follow proper risk management.
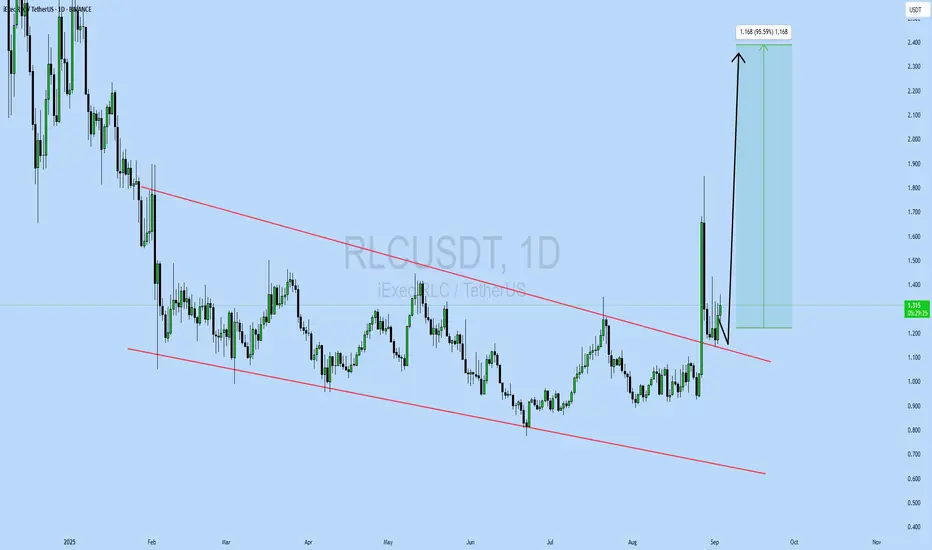
RLCUSDT UPDATE#RLC
UPDATE
RLC Technical Setup
Pattern : Falling Wedge Pattern
Current Price: $1.316
Target Price: $2.48
Target % Gain: 95.59%
Technical Analysis: RLC has broken out of a falling wedge on the 1D chart with a strong bullish candle. Volume spike confirms buying pressure, suggesting momentum could extend toward $2.48 if the breakout sustains.
Time Frame: 1D
Risk Management Tip: Always use proper risk management.
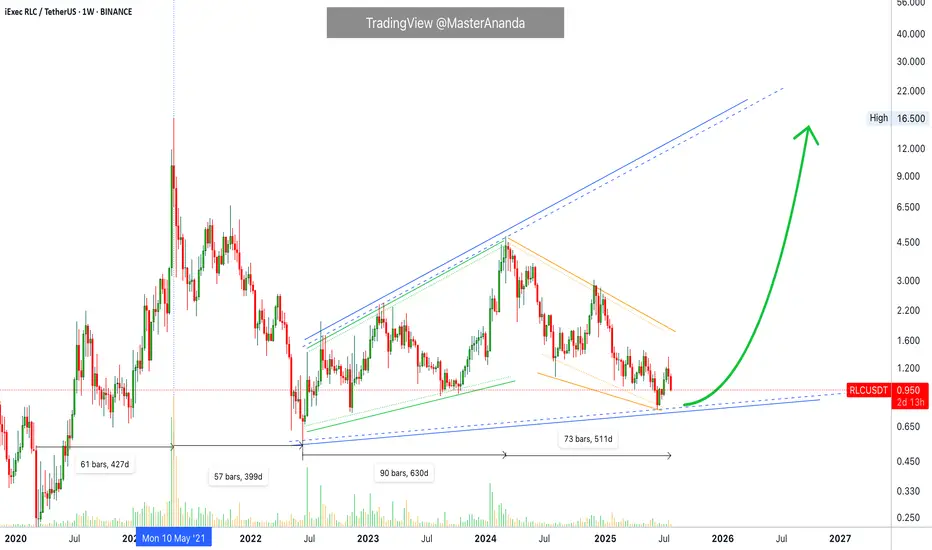
iExec RLC · Trading at Bottom with a Bullish BiasiExec RLC (RLCUSDT) is still trading at bottom prices but the overall market conditions are good. Good for the future because the market moves in waves alternating always between rising and falling.
RLCUSDT went bearish between May 2021 and June 2022, 399 days. Then it went bullish from June 2022 to March 2024, 630 days. Then it went bearish again between March 2024 and present day, August 2025. More than 510 days.
While RLCUSDT has been bearish more than a year, the action is still happening as a long-term higher low. That is, prices today and at the lowest—16-June 2025—are still higher compared to the low in June 2022.
Of course before being bearish in 2022 the market was bullish between March 2020 and May 2021, 427 days. Here we can clearly see the fluctuations between bear and bull, uptrends and downtrends.
The last uptrend came in 2021 and we are due a new one. Crypto grows every four years and market conditions are perfect for the next run. The market has been mixed, sideways and neutral for years on end, the long-term higher low is a single of strength. After the current retrace is over, you can prepare for a major bullish wave.
Namaste.
#RLC/USDT#RLC
The price is moving within a descending channel on the 1-hour frame, adhering well to it, and is heading toward a strong breakout and retest.
We are experiencing a rebound from the lower boundary of the descending channel, which is support at 0.995.
We are experiencing a downtrend on the RSI indicator, which is about to break and retest, supporting the upward trend.
We are heading toward stability above the 100 Moving Average.
Entry price: 1.028
First target: 1.063
Second target: 1.102
Third target: 1.152

#RLC/USDT Pump Anticipated#RLC
The price is moving within a descending channel on the 1-hour frame, adhering well to it, and is on its way to breaking strongly upwards and retesting it.
We have support from the lower boundary of the descending channel, at 1.155.
We have a downtrend on the RSI indicator that is about to be broken and retested, supporting the upside.
There is a major support area in green at 1.143, which represents a strong basis for the upside.
Don't forget a simple thing: ease and capital.
When you reach the first target, save some money and then change your stop-loss order to an entry order.
For inquiries, please leave a comment.
We have a trend to hold above the 100 Moving Average.
Entry price: 1.170.
First target: 1.200.
Second target: 1.234.
Third target: 1.282.
Don't forget a simple thing: ease and capital.
When you reach your first target, save some money and then change your stop-loss order to an entry order.
For inquiries, please leave a comment.
Thank you.

#RLCUSDT #1D (Binance Futures) Descending wedge on supportiExec RLC just printed a dragonfly doji which may have marked the bottom on daily.
A morning star is drawing now, recovery towards 100EMA resistance seems around the corner.
⚡️⚡️ #RLC/USDT ⚡️⚡️
Exchanges: Binance Futures
Signal Type: Regular (Long)
Leverage: Isolated (4.0X)
Amount: 5.9%
Current Price:
0.9126
Entry Targets:
1) 0.9002
Take-Profit Targets:
1) 1.1854
Stop Targets:
1) 0.7859
Published By: @Zblaba
GETTEX:RLC BINANCE:RLCUSDT.P #DePIN #AI #iExec iex.ec
Risk/Reward= 1:2.5
Expected Profit= +126.7%
Possible Loss= -50.8%
Estimated Gaintime= 1 month

RLCUSDT 1W AnalysisRLC ~ 1W Analysis
#RLC This is the closest support for now. Buy if you still have faith in this coin with a short-term target of at least 20%++

RLC Update 1D I believe we can See a solid project with a shared focus between DePIN and AI that meets strong technical criteria. Given the current favorable market conditions, I think it has the potential for significant growth.

#RLC/USDT#RLC
The price is moving in a descending channel on the 1-hour frame and is adhering to it well and is heading to break it upwards strongly and retest it
We have a bounce from the lower limit of the descending channel, this support is at a price of 1.13
We have a downtrend on the RSI indicator that is about to be broken and retested, which supports the rise
We have a trend to stabilize above the moving average 100
Entry price 1.15
First target 1.17
Second target 1.20
Third target 1.25

RLCUSDT 1D Analysis RLC ~ 1D Analysis
#RLC Buy on retesting this support block or buy after successfully breaking this resistance line with a short term target of at least 10%+.

RLCUSDT Pump Anticipated**📊 Entry:** Check the chart for optimal entry points.
**🎯 Targets:** 1.86 - 2.06 - 2.32 (51% potential move in spot).
**🛑 Stop-loss:** 1.280 – Stick to this level to manage risk.
💡 Remember to manage your position size carefully, keep an eye on market conditions, and don’t chase the trade if you miss the entry.

RLC Risky Long Idea (Snipe)Here will try to go with a Snipe Entry on RLCusdt Pair if it gives me that price.
I believe if the entry area holds we are going to see a quick pump towards next levels.
Highly Risky Trade.
Strategy
Have leveraged entries set at 1.3750 and under.
with stops flat at 1.3580.
Note: Not a Financial Advice
DYOR

RLC up?As we got our favorite FBuy print and volume up and a news from RLC, let's see where this pump end up. stop loss below 1.3 DYOR
for indicator access you can drop a message.

iExec RLC (RLC/USDT) - Key Levels To Watch 1HRLC is showing strong bullish momentum, currently trading around $1.34, with a potential breakout on the horizon.
A breakout above resistance with strong volume could lead to an explosive move!
Keep an eye on price action and confirmation signals.

RLC big picture planThe rising trendline over the last 5 years is the only thing that makes me still want to hold this coin. Therefore, in my opinion there is nothing that makes me believe we will go lower than current levels. As far as upside, I do believe sky is the limit. Let's observe how this evolves over the next few months.
Cheers!

RLC SHORT !!!!#RLC/USDT
Entry zone : 1.3650 - 1.3306
Targets : 1.3186 - 1.2919 - 1.2653 - 1.2386 - 1.2120 - 1.1854 - 1.1587 - 1.1321
Stoploss :1.41
