As mentioned on September 25th Idea: RSR followed XRP pop!It's always happening .
RSR is now +25%
Accumulate such data, and you will do very well in investment markets.
XRP aswell had a massive spike in volume ( and price ) shortly before Friday morning. Looking forward for next week's move!
RSR's move was lagging for roughly a whole day, but it has now catched up as we expected.
There's a lot of hype amongst CT investors for RSR, especially because mainnet's imminent. But as always, they will fall on the trap of their own greed. When they buy/long, they supposedly have a target, but once it is near their target, they want more and increase their exit target...
They do the same for buying. Back in the day when Bitcoin was $60,000+ EVERYONE on CT was saying it was a dream that would never happen again to see Bitcoin below $30,000 and they would just dream with the chance to be able to accumulate < $30,000...
Well, it is now below $20,000 and guess what they're doing?
- They have adjusted to buy @ $10,000...
If it gets to $10,500 they will not buy and they will adjust again to buy @ $5,000...
Until the trend reverses and they lose the train. It's just the way 99% of the investors play this game, and that's why they didn't make money, and never will.
Don't be them. If there's profits, realize them and wait for new opportunities when they show.
We don't decide when is best to enter... the market does . We read it, and we enter when we find enough confirmations to do so.
Build your 100x by extracting 2x at a time .
RSRUSDT trade ideas


RSRUSDT forming butterfly RSRUSDT forming butterfly not a financial advice
RSRUSDT forming butterfly not a financial advice

RSRUSDT#RSRUSDT
(LONG SIGNAL)
(SWING TRADE )
MACD is neutral
EMAs showing a bullish move
RSI is bearish
the price now above the strength support zone this support pushed the price to 0.12$ in may 2021 that mean 1477%
so now the price play at the same zone from may 2022 did you expect the scenario can repeated and jupm again
targets set at the chart

RSRUSDT#RSRUSDT
(LONG SIGNAL)
(SWING TRADE )
the price now above the strength support zone this support pushed the price to 0.12$ in may 2021 that mean 1477%
so now the price play at the same zone from may 2022 did you expect the scenario can repeated and jupm again


RSR - Short -bearish divergence short termRSR has been experiencing very strong buying momentum over the course of the past days, galvanized by the upcoming mainnet launch at beginning of October.
Price action has been generating higher highs, reaching top of >0.0085.
RSI and MACD have been crunching lower highs instead, suggesting we might experience a bearish divergence which can push prices lower in the short term.
Please note that the token might experience high volatility given the mainnet launch as market will follow the old adage, buy the rumour sell the news.
Would position with a short, but with tight stop loss

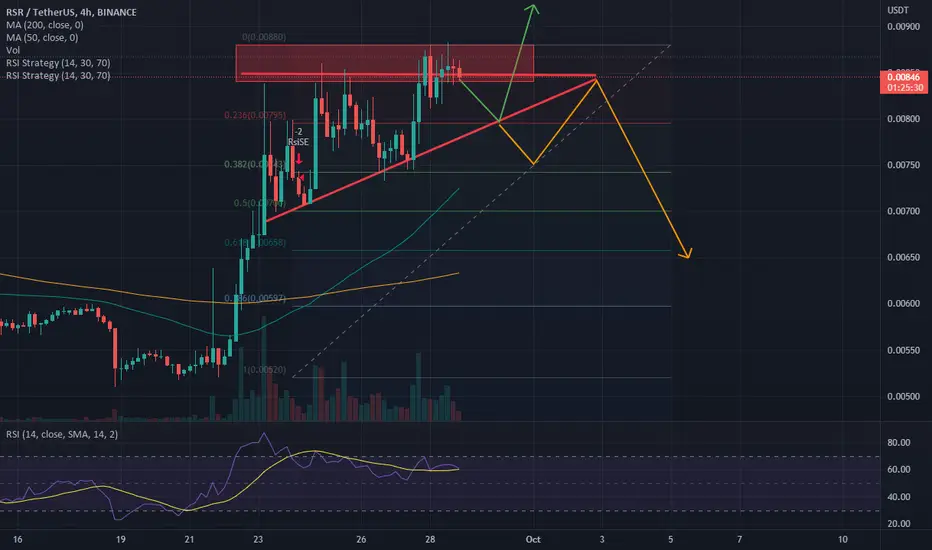
RSR_USDTending diagonal pattern
if we can sell top in trend lin and fib lavels
we can open sell trade top in trend line and fib levels

RSRUSDT - Analysis by Elliot wavesRSR May start for bullish as we are now on the last wave of 1 then we will focus on the correction that will be happened downward as wave 2 in order to start the impulsive wave 3 upward as mentioned in chart.
This is to be failed if price breaks 0.00330

RSRUSDT SHORT IT ON BREAKING TRENDLINESHORT RSRUSDT!!
hidden bearish divergence on 4H timeframe
bears are calling!!!!!!!

RSr shortUp :0.0089
Down : 0.0059
Amount : min
Tp All Fibonacci points
Order difference : 0.2
Order sell : 1%

✅TS ❕ RSRUSD: resistance level✅✅RSR has reached the resistance level.
The price formed three peaks, after which it bounced down.
I expect the fall to continue.✅
🚀 SELL scenario: short to 0.00745.🚀
----------------------------------------------------------------------------
Remember, there is no place for luck in trading - only strategy!
Thanks for the likes and comments.

RSR STATUSI think it has the ability to move up to the SUPPLY range. But we are not looking for a long position or buying, and we wait for shorts in the announced range. If you buy, don't forget capital management and stop

RSRUSDT | IMPORTANT RANGERSRUSDT has been in accumulation phase since June.
the price has closed above 100MA.
Now the price is currently trading at higher side of range.
The 0.236 fib level also confluence at same level.
For bullish trend continuation and for breakout, bulls must close above mentioned zone.
Manage your trades accordingly.

RSRUSDTTDLC BK set-up
Short at 15m TF
RFS: TDLC untog set-up, hourly RSI on overheat level and at daily supply zone
entered 3 tranches up to full VAR allocation
RFC: Exit on BTC mirror pullback

RSR Short Entry [Strong Bearish Divergence❗️❗️❗️]We are getting close to main net launch. I honestly think we'll touch support again before breaking resistance as a bearish divergence has been spotted on the 4H timeframe for RSI.
We have also been stuck in the overbought area for quite a few days and now, it seems like price will head back towards the 0.0055-60 area (aka TP) before we break resistance, 0.0090-010 area (SL).
I suggest you may take risk as from 1.25%-2.5% of your trading funds if you are to choose the max leverage available for RSR/USDT pair (25x).

#RSR Swing option long to .0115 / 0.015 / 0.186 /0.022#RSR very good swing option - broken above monthly level with initial retest. first possible target is .0115 and then .015 , extended targets for swing are .0186 and then .022

RSR/USDT Elliott Wave count 4H TFRSR break slope trend line with an impulse that probably is wave 1 and than made an abc correction to retest the trend line after the break for a short wave 2.
This is the wave C probably an impulse to the upside that will hit 1:1 ratio.
2.236 Fib projection 1 vs 2 hits perfectly the zone of the 1:1 ratio A vs C so from here I am expecting to start the wave 3 from this C wave.
I am long on RSR with target into the box and stop lose below invalidation level.
Also take a look to the related idea.
If you like my analysis subscribe for future ideas and hit the like button.
Thank you and good luck!

RSR moved 8%. What's next?Hello, dear TradingView members.
This is an RSR idea.
RSR just made an 8% move up and got rejected after reaching the local resistance area.
It is still bullish, considering how the Bollinger Bands are expanding, and the price is pushing up the upper band.
There are two possible scenarios for now:
Scenario One:
The price will move a bit longer above the local support area and reach resistance levels.
Scenario Two:
The price will get rejected by the upper Bollinger Band and fall on our support levels.
RSI is near the oversold area, but the price has more room to go up.
Now let's see your ideas. Let's have a discussion.
Let me know if you guys have any questions;
I will be more than happy to help.
Good luck, and thank you.


rsrusdt, strong support zones!!!i noticed a very very strong support zone (the bottom one) and another strong support zones above!!

RSR USDT 26 Sept 2022Analysis:
Short Term: Trend reversal from down to up trend
Strategy :
Entry at good retracement in demand zone.
Disclaimer:
There's no 100% accurate prediction & strategy. Force majeure & institutional trader action maybe happen any time. Please use your money management well.
This coin has high Volatility!
