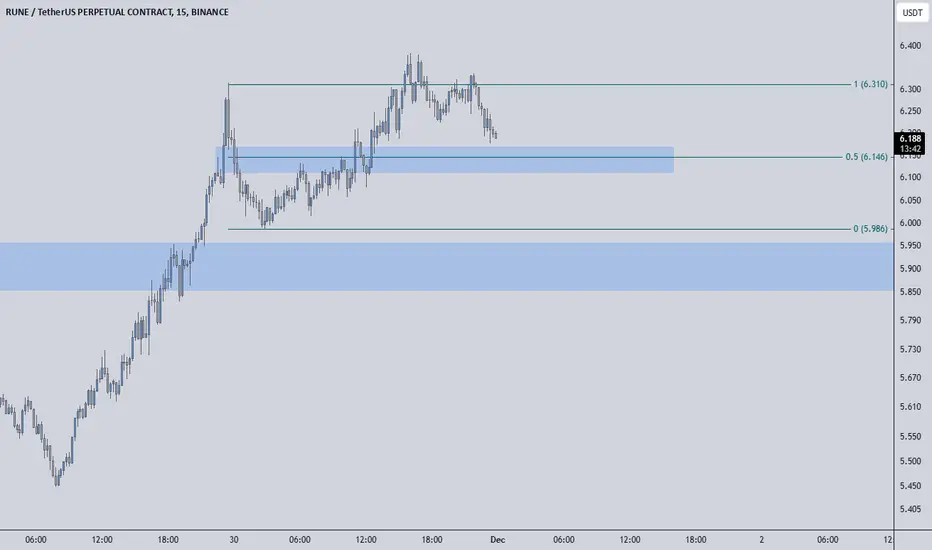
RUNE tps for this bullbased on past bulls experience I believe fibs and cyclical highs and lows are the best levels to set for profit taking. yes, I do believe in decentralisation and crypto - its utility and potential but I will not bag hold, thinking ahead of time for the next bear/shopping market
taking also in consideration my spot avg entry and bag size, these are my tp levels and respective bag %s for $BINANCE:RUNEUSDT. once i get sls/trailling stops I will update the chart, too soon to plan for those
do as you please with it 🤝
Market insights

RUNEUSDT 1WRUNE ~ 1W
#RUNE Buy gradually after breaking through this resistance line. with a minimum target of 20%+. The break of this resistance line confirms further bullish

Future Outlook for RUNEUSDT Based on Price Action Analysis
"After thoroughly analyzing the price action of RUNEUSDT, I believe that it is unlikely for the price to break above the level of 11.564. Based on the observed behavior, the current price movement suggests that this level will act as a strong resistance, and further upward momentum appears limited at this point."

$RUNE SHORT SIGNAL base on usdt.d and btc.d - rune in best place to trade in short position . all targets in the image & and you have to manage your risk and take min 5X - max 15X lev . dont forget capital managment .

TradeCityPro | RUNEUSDT The Best Opportunity of the Week👋 Welcome to TradeCityPro Channel!
Let’s analyze another cryptocurrency in detail, as the market is relatively calm right now, providing the perfect time to review and align our triggers.
🌍 Market Overview
As always, let’s start with Bitcoin. Over the past two days, Bitcoin hasn’t shown any significant movements, mostly ranging due to the weekend—something quite normal. These consolidations were needed for the upcoming moves.
For the week ahead, if Bitcoin breaks the 100,400 resistance and its dominance declines, make sure to focus on altcoins for potential positions or purchases. Conversely, if Bitcoin dominance rises, consider trading Bitcoin or coins paired with Bitcoin that are showing bullish trends.
🕒 Weekly Time Frame
RUNE is one of the coins that has shown some movement before the broader market moves began. It hasn’t risen from its all-time low but instead from its 2024 bottom, maintaining a bullish trend behind it.
You can consider buying after the weekly candle closes above 6.950, as this would indicate a breakout of weekly resistance. The volume is favorable, and the RSI has entered overbought territory. Place a stop-loss at 3.038 to participate in the potential move.
After initiating its move and finding support at 3.038, you can draw a Fibonacci retracement. The 0.382 level aligns with this support, and upon breaking the high (currently in progress), the Fibonacci extension levels suggest targets of 11.64, 26.431, and 46.375.
Some might wonder why the March 2024 movement wasn’t used for Fibonacci. This is because that movement was overly impulsive and later rejected, with a pullback to the previously established resistance at 6.95. Hence, this range is more appropriate for analysis.
📊 Daily Time Frame
RUNE is currently encountering a critical daily resistance. A breakout could lead to a move toward 10.695.
For a purchase in this timeframe, you can consider entering after a breakout above 7.32 with a stop-loss around 4.92. This would be a slightly riskier entry. Confirmation could come from an RSI pullback to 70 and a subsequent upward movement.
RUNE hasn’t shown much activity recently, but money appears to be flowing into it. Considering the weekly uptrend, it’s worth positioning ahead of a potential move.
🕒 4-Hour Time Frame
On the 4-hour chart, RUNE is following a parabolic curve and has reached the 7.352 resistance. After being rejected initially, it didn’t drop significantly, and on the next attempt, volume increased as it approached the high again. This second rejection further validates the resistance.
📈 Long Position Trigger
the trigger is clear enter after breaking 7.352. Use a wide stop-loss as this is a daily resistance breakout and may experience fluctuations; missing the move is not an option.
📉 Short Position Trigger
I’m still not interested, just as I’ve been in recent days. I prefer either resting or providing analyses for the community so we can collectively reduce stop-loss hits while building a stronger TradingView presence.
💡 BTC Pair Insight
RUNE, compared to Bitcoin, is in a favorable position. Unlike many altcoins, it’s not at its absolute bottom but rather near its 2024 low. Confirmation of an upward trend would come from breaking the weekly trendline or surpassing 0.00008139, which would likely initiate a significant pump. This relative strength compared to Bitcoin is a positive point for us.
📝 Final Thoughts
Stay calm, trade wisely, and let's capture the market's best opportunities!
This analysis reflects our opinions and is not financial advice.
Share your thoughts in the comments, and don’t forget to share this analysis with your friends! ❤️

RUNE/USDT Weekly Analysis$RUNE/USDT Weekly Analysis
#RUNE has broken out of a long-term descending trendline, signaling a shift toward bullish momentum. The current price is $7.365, reflecting a 21.43% increase, and the breakout has established a new support zone around $5.766, providing a solid foundation for further growth.
Key upside targets are identified at $10.077, $12.498, and $14.786. A potential pullback to the support zone at $5.766 could present an ideal buying opportunity before the next leg up.

If that happen RUNE could rise up (+175%) to (+230%)Rune is trying to break a huge symmetrical triangle pattern alongside with its price above of value area high from 2024 and anchored vwap from 2021 highs, is looking very strong and if it can close the weekly candle above $7,347 would suggest an increase up to the last bull run highs. The target is in confluency with the symmetrical triangle pattern, between 2021 highs and fibonacci extension levels.
TARGET: $19,82 TO $23,90 up to (+230%)

Last Chance: $RUNE Poised for Parabolic Move Beyond ATHsThis could be the last chance to enter before CRYPTOCAP:RUNE begins its parabolic move, or at least starts expanding, leaving everyone behind.
The new weekly trend is about to confirm, and it’s at a pivotal area. If it breaks above $7, this will trigger an even bigger upside. I believe CRYPTOCAP:RUNE is on track to break beyond its all-time highs and could potentially reach the second target near $75. It may seem ambitious, but the chart is signaling a strong move ahead. BINANCE:RUNEUSDT
Buying as close as possible to $6.60 for this setup.
Previous entries are posted here

Unbelievable Opportunity on RUNEUSDT💎 These Blue Boxes Aren’t Just Zones—They’re GOLDMINES! 💎
The blue boxes on this chart mark key areas of potential buying interest for RUNUSDT.P, carefully identified through my technical analysis. These zones represent areas where demand might step in, creating opportunities for a bounce or upward move.
While I remain humble, I’m confident in my ability to analyze the markets effectively. My previous analyses have consistently proven accurate, and I trust this setup will further validate my approach. Let’s see how the price action respects these levels, proof is always in the results.
📈 See It, Believe It, Trade It. 📉
Don’t miss out proof is in the results. Let’s make this count! 👊
My Previous Hits
🐶 DOGEUSDT.P | 4 Reward for 1 Risk (or more if you’re bold).
DOGEUSDT.P: Next Move
🎨 RENDERUSDT.P | HTF Sniper Precision
RENDERUSDT.P: Opportunity of the Month
💎 ETHUSDT.P | Buyer Zone So Accurate You’ll Double Check
ETHUSDT.P: Where to Retrace
🟢 BNBUSDT.P | Buyer Zone Mastery (CZ vibes).
BNBUSDT.P: Potential Surge
📊 Bitcoin Dominance | Called it Like a Pro
BTC Dominance: Reaction Zone
🌊 WAVESUSDT.P | The Blue Box: A Demand Zone with Potential
WAVESUSDT.P: Demand Zone Potential
🟣 UNIUSDT.P | Long-Term Trade
UNIUSDT.P: Long-Term Trade
Now sit back, relax, and watch the market do its thing. Or don’t, FOMO is real. 😉
Thorchain ( Rune )THOR Chain
RUNE usdt Daily analysis
Time frame daily
Risk rewards ratio >3.5
Target 6.8 $

RUNE Analysis: Ready for a Historic Surge?✨🚀 RUNE Analysis: Ready for a Historic Surge? 🚀✨
After a deep correction, RUNE is now entering a phase many analysts consider the beginning of its major upward movement. This cryptocurrency, which previously saw an incredible 65x growth from September 2020 to May 2021, is now poised to break new all-time highs.
🔍 Recent History:
June 2023: Formed a historical low at $0.77
March 2024: Reached $11
August 2024: Corrected to $2.5
RUNE is now at a key resistance level. If it breaks $7.5, it’s expected to reach the following targets:
🎯 Target 1: $30 (300% profit)
🎯 Target 2: $130 (1600% profit)
🔥 RUNE is ready to explode; don’t miss this opportunity! 💎


RuneUSDT Long IdeaIf Rune closes this 4hr wick above the 50ema, It's a great place to take a long and target the 50% of the weekly wick at $10.22 or weekly high at 11.6. Invalidation is 4%.

Rune Cup and handleRune has been forming a giant cup and handle which is a very bullish pattern the neckline is around 11.40 and if it confirms this pattern we can see a price target of between 18-24 in the coming weeks to months.

RuneusdtEverything is clear in the picture
-----------------------------
Remember nothing is 100% certain

Alts with UPSIDE POTENTIAL | ALTCOINS | RUNE, ATOM, FETIn this time of the cycle, many alts have already rallied... and a few, haven't, patiently awaiting their turn for some liquidity.
In this video, I take a look at my TOP picks - there are many more, but let's start with these.
1) FET
2) RUNE
3) ATOM
________________________
BINANCE:ATOMUSDT BINANCE:RUNEUSDT BINANCE:FETUSDT


RUNE looks greatI'm looking for coins that I can potentially rotate into in the near future. Here is one on my radar. I wouldn't jump in now. After it breaks 7.2, RUNE will be even more interesting. I'd say you should add to watchlist.

$RUNE to $7.7Looks like RUNE have made local bottom.
It jut need to get above $5.73 and it will teleport to it's target.
Have BTC in mind, if it dumb then whole market might follow.

Technical Analysis of the Cuphead patternThe current setup presents a classic cup-and-handle pattern, visually resembling the shape of a " Cuphead " character. This structure typically indicates a bullish continuation, as it forms after a period of consolidation within a broader uptrend.
Cup Formation:
Left Side of Cup: The pattern began after a pullback from recent highs, creating the initial drop and rounding bottom, representing the "body" of the cup (or "Cuphead's" round head).
Base of Cup: The support level at the bottom is significant, where volume likely decreased, indicating seller exhaustion and setting a strong foundation.
Right Side of Cup: Price begins to rise again, completing the rounded shape and signaling a renewed bullish sentiment as buyers regain control.
Handle Formation:
Handle Decline: The handle forms as a slight pullback from the right side of the cup, usually about one-third of the cup's height. It indicates a final consolidation before a breakout and serves as "Cuphead’s" handle.
Handle Length: The handle length should not exceed half the cup's height, as longer handles might signify weakening bullish momentum.
Volume Analysis: Look for decreasing volume during the handle formation, indicating weaker selling pressure, with an increase in volume as the breakout starts.
Breakout & Price Targeting:
Entry and Confirmation: A breakout above the handle’s resistance confirms entry into a long position, with a volume surge as buyers push the price upward.
Price Targets:
First Take Profit: At 100% profit, calculated based on the initial entry price and set to secure gains once the target is reached.
Second Take Profit at Cycle Highs: For further gains, the final target is set at cycle highs, leveraging the bullish momentum and trend continuation.
Risk Management:
Stop-Loss Placement: A conservative stop-loss can be set slightly below the handle’s low to protect against unexpected reversals while allowing some room for price fluctuations.
Trend Monitoring: Keep an eye on volume and candlestick patterns post-breakout to ensure continued bullish momentum, adjusting stops accordingly to lock in profits.

📈RUNE can go high to $40 level / Alt Season rally📉BINANCE:RUNEUSDT
KRAKEN:RUNEUSD
Hello Traders
Rune is one of my suggestions for the altcoin market.
You can clearly see that volume has increased continuously. ---> Highly potential for the alt rally season.
RUNE is the native token of the THORChain network. It represents a multi-purpose universal token that supports all functions on the THORChain network and helps run the protocol. RUNE is used in governance, for staking, bonding for validator Nodes, and trading.
The best strategy for altcoins is to allocate a certain percentage of assets (for example, 10% of the total portfolio) to buy potential altcoins.🎲

THORChain Aiming Lower 6X SHORT—369% PotentialThis is an updated version for our RUNEUSDT SHORT, the first one hit two targets with 4X and a total of 124% profits, the numbers are still good but you can follow this publication rather than the previous one.
Potential is much higher on this since we are using higher lev.
(This is not recommended for beginners; caution, high risk.)
➖ THORChain (RUNE) peaked in March 2024, it has been bearish since. We have the same chart patterns and price dynamics as the other Cryptocurrency kings and queens.
Is the correction over? We will soon know!
Those trading at bottom prices likely ended their correction already, those trading higher might have one final drop to go through before the correction is over; the last leg-down, the final market flush.
When the giants crash, money will flow from the big projects to the smaller ones.
The market is mixed, it is not easy to navigate.
Focus on one chart at the time and all is good.
See the full trade-numbers below:
____
➢ SHORT RUNEUSDT
Leverage: 6X
Entry levels:
1) $6.25
2) $5.75
3) $5.35
Targets:
1) $4.955
2) $4.555
3) $4.130
4) $3.763
5) $3.211
6) $2.831
7) $2.155
8) $1.951
Stop-loss:
Adjust to your own risk tolerance
Potential profits: 369%
Capital allocation: 3%
___
Remember to do your own research and planning before trading, this is not financial advice.
I am sharing my views and opinions of the chart.
The markets are unpredictable, that's what some people say. This doesn't matter, we can still use our brains to trade... The market can be predicted, the proof is in the charts.
Thank you for reading.
Namaste.

RUNEUSDT.P short-term forecast
Expectation of FVG filling, as well as volume voids after prolonged growth.
If a reversal formation appears and a retracement occurs, expect the upward movement to continue.
