Ravencoin Wedges – When To Walk Away
Ravencoin (RVN) has a unique rhythm. Over the past years, its wedge breakouts have not been random: they aligned with Fibonacci time ratios. Even more remarkable: every major breakout gave traders just 4 weeks to capture the majority of profits before fading.
In this article, I’ll outline:
How RVN wedges have respected Fibonacci in time.
Why the majority of profits disappear within 4 weeks.
A structured trading strategy to capture those moves.
My falsification criteria – when the thesis fails.
Fibonacci Timing in Wedges
Traders are familiar with Fibonacci retracements in price, but RVN shows a similar respect for Fibonacci in time. Let’s look at three wedges:
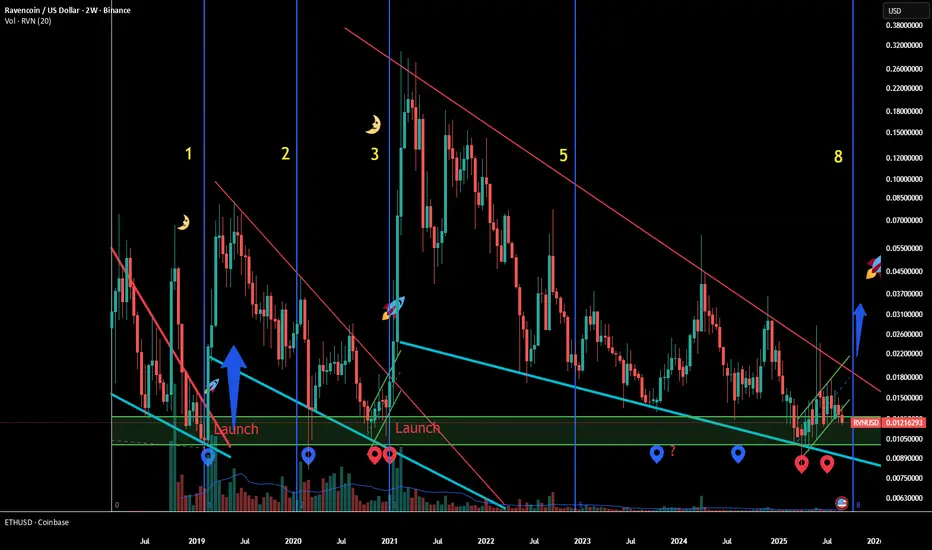
Wedge 1 (2019): breakout at ~0.75 of apex → close to 0.786 (fib).
Wedge 2 (2021): breakout at ~0.625 → near 0.618 (golden ratio).
Wedge 3 (current projection): ~0.702 → not classical, but widely used as the “sweet spot” between 0.618 and 0.786.
👉 RVN breakouts consistently happen within the 0.618–0.786 fib timing window.
The 4-Week Profit Window
Timing the breakout is only half the story. What happens after the breakout is just as important:
In 2019, RVN spiked strongly, but the majority of profits disappeared within 4 weeks.
In 2021, the same pattern: explosive breakout, then a retrace that erased most of the move in just 4 weeks.
The lesson is clear:
RVN wedges give traders about 1 month to take profits. Beyond that, history shows the rally fades.
Suggested Strategy
To turn history into a plan, here’s my structured exit approach:
10% at breakout (~$0.10) → reclaim initial investment.
20% per week → scale out systematically during weeks 1–4.
Remaining position → managed by price action (volume surges, momentum exhaustion, bearish candles).
This strategy ensures:
You lock in capital at the breakout.
You systematically capture the 4-week window.
You keep flexibility for exceptional moves without holding too long.
Invalidation – When the Thesis Fails
No setup is complete without a clear falsification rule.
For me, this thesis is invalid if:
RVN woggles sideways in the red zone (around wedge resistance) instead of breaking out, or
Price fails to attract volume and momentum after breakout.
In short: if the wedge breakout doesn’t confirm, the “4-week profit rule” cannot be expected to play out.
Risks & Counterpoints
Wedges are partly subjective; small differences in trendline drawing change apex timing.
Market conditions in 2025–2026 may differ from earlier cycles.
Fibonacci time zones are not “scientific laws” but empirical tendencies.
That said, the repetition across two major wedges adds real weight to the pattern.
Conclusion
Ravencoin shows a fascinating Fibonacci time structure: breakouts consistently occur between 0.618 and 0.786 of the wedge apex distance, followed by a 4-week profit window.
For traders, the rules are simple:
Don’t wait months.
Take profits fast.
Respect the 4-week window.
If the next breakout follows the same script, systematic scaling within the first month will once again separate winners from bagholders.
RVNUSD trade ideas
WARNING! Ravencoin Wedges - Get All Out In A Month!
(NOTE: click on this link to get the correct Chart)
🔑 Idea Summary
RVN wedge breakouts align with Fibonacci time ratios (0.618 – 0.786).
2019 breakout (~0.75) → profits gone in 4 weeks.
2021 breakout (~0.625) → same 4-week window.
2025 projection (~0.702) → points to another fib-timed breakout.
📌 Key Rule: The majority of profits vanish within 4 weeks.
👉 Take profits fast, respect the 4-week rule, and don’t expect long rallies to hold.
Ravencoin (RVN) wedges don’t just respect Fibonacci in price, but also in time.
2019 breakout at ~0.75 of apex → profits gone within 4 weeks.
2021 breakout at ~0.625 of apex → same 4-week pattern.
2025 projection points to ~0.702 of apex.
Strategy:
✅ Take 10% at breakout (~$0.10).
✅ Scale 20% per week during weeks 1–4.
For me: week 2 to 4 25% I like to take more risk/reward
✅ Manage the remainder with price action.
👉 Don’t wait months — with RVN, the clock starts at breakout.You systematically capture the historical 4-week window.
You keep flexibility for extraordinary moves without holding too long.
Falsification
No pattern is guaranteed. Wedges can be drawn differently, and markets sometimes defy history. But the fact that RVN repeated the same time behavior twice in a row adds weight to the hypothesis.
Conclusion
Ravencoin offers a rare Fibonacci time structure: wedge breakouts near 0.618–0.786 of the apex distance, followed by a 4-week profit window.
For traders, the implication is clear:
Don’t wait months.
Take profits fast.
Respect the 4-week rule.
If the next breakout follows the same script, those who scale out systematically in the first month will once again be the ones keeping the profits.
Ravencoin – 5 Reasons Why the Moon May Not Arrive
RVN – 5 Reasons Why the Moon May Not Arrive 🚫🌕
“Science is not about proving a thesis — it’s about trying to falsify it.”
(Karl Popper)
⚖️ In short
Ravencoin bulls see Fibonacci time zones and fractals pointing to late 2025.
But:
No adoption narrative,
Miner sell pressure,
Bearish momentum,
Weak volume,
Macro risk…
…all cast doubt on the “moon” scenario.
Sometimes, the strongest trade is accepting that price tells the real story, not the narrative.
With Ravencoin, the bullish case is easy to make: fractals, Fibonacci time zones, compression.
But good analysis also asks: what if the thesis is wrong?
Here are five serious counter-arguments against the moon scenario.
🌌 Fundamental arguments
1. No strong adoption narrative
Unlike BTC (ETF adoption) or ETH (DeFi + staking), Ravencoin currently lacks a widely embraced use case that could attract large inflows. Without a narrative, price may simply drift sideways.
2. Mining sell pressure
RVN is GPU-mined. Whenever price rises, hash rate follows, and miners sell block rewards. This creates a constant headwind that can absorb rallies and flatten parabolic attempts.
📊 Technical arguments
3. Bearish oscillators
Long-term RSI and Stochastic still point downward. That signals momentum exhaustion and suggests a final flush is more likely than immediate liftoff.
4. Lack of volume confirmation
So far, no “elephant candles” of absorption have appeared. Without volume expansion, the market has not shown real commitment to a new cycle.
5. Macro market risk
RVN doesn’t move in a vacuum. If Bitcoin dominance stays high or macro shocks hit (Fed policy, ETF flows, geopolitics), altcoins can be crushed regardless of individual fractals.
🔄 Countering the Bear Case
Every bearish argument is valid — but none is decisive.
1. No adoption narrative → Narratives often follow price. In 2021 RVN had no strong narrative either, yet it rallied x20.
2. Mining sell pressure → This has been true since 2018, and it didn’t prevent past parabolas. When demand kicks in, miner supply is easily absorbed.
3. Bearish oscillators → RSI and Stoch are lagging. They often look bearish right until the reversal. Deep oversold can be the “springboard.”
4. Lack of volume confirmation → True now, but one elephant candle can flip the picture overnight. Volume is a trigger, not a long-term forecast.
5. Macro market risk → Outliers can run even in adverse macro conditions. Plus, RVN’s Fibonacci timing lines up with the post-BTC-halving altseason of 2025–2026.
⚖️ Final takeaway:
The bear case explains today’s weakness — but not necessarily tomorrow’s breakout.
That’s why both sides of the thesis must be tested.
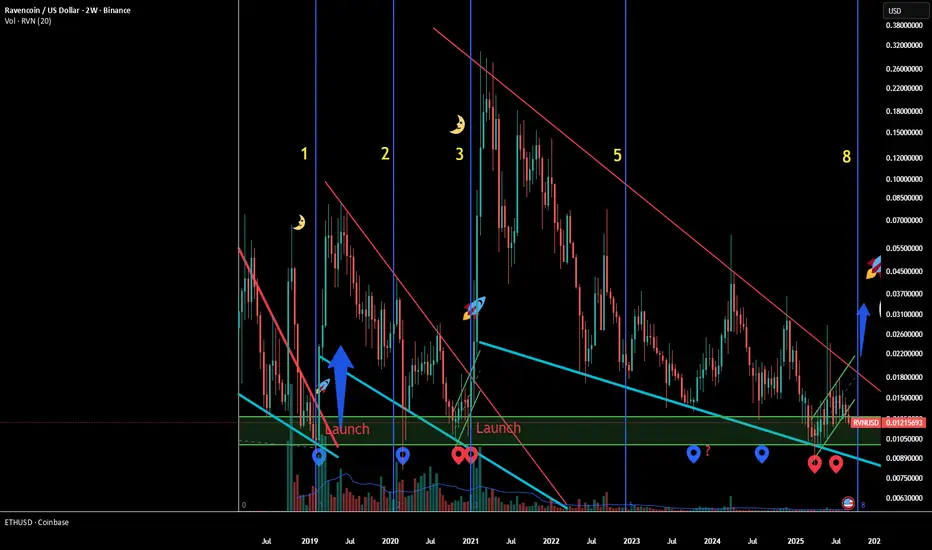
Ravencoin – Fibonacci Timezones: Next Moon End October 2025
In short:
RVN’s breakouts lined up with Fibonacci time counts before.
Zone 1 → 2019 breakout.
Zone 3 → 2021 breakout.
Zone 8 → Oct 27, 2025?
If history rhymes, Ravencoin may be preparing its next moonshot right on schedule. 🚀
Ravencoin’s launchpads have followed a surprising Fibonacci rhythm.
⏳ The Time Structure
Zone 1 (2018–2019): From genesis until the bar just before the first breakout (Feb 2019).
Zone 2: Skipped.
Zone 3 (2020–2021): From bottoming until Jan 2021 — again, the bar just before breakout.
Zone 5: Skipped.
Zone 8 (2025): If the same rhythm holds, we are now approaching the next critical launchpad.
📌 By extrapolation, the Fibonacci sequence (1–2–3–5–8) suggests the next breakout window opens around 27 October 2025.
🧩 Why it matters
RVN’s history shows not just price fractals, but time fractals.
Each parabola was preceded by a Fibonacci-timed compression phase.
Skipping intermediate numbers (2, 5) makes the hits at 1, 3, and now 8 stand out even more.
🎯 Projection
Breakout could ignite in late October 2025.
Potential parabola similar to 2019 and 2021 cycles.
Target range: $0.25 → $0.50 if structure repeats.
📉 Bearish gift scenario
The current chart still carries a bearish bias.
A dip to $0.010–$0.009 cannot be excluded.
Instead of invalidating the setup, such a move would act as a final spring.
For long-term holders this is a gift — a last clean add opportunity before liftoff.
📚 Educational sidebar: Why Fibonacci often aligns with market cycles
The Fibonacci sequence (1, 2, 3, 5, 8, 13…) is not mystical — it’s structural.
Nature & growth: Plants, shells, galaxies, all grow in Fibonacci ratios.
Human behavior: Financial markets are driven by collective psychology. Fear, greed, and crowd timing often cluster around these proportions.
Markets: Traders unknowingly reinforce these rhythms by using Fibonacci retracements, extensions, and time zones.
👉 The result? Market cycles often “breathe” in Fibonacci counts — not perfectly, but frequently enough to create repeating patterns.
Ravencoin – Fibonacci Timezones Point to Next Moon End October
Ravencoin’s launchpads have followed a surprising Fibonacci rhythm ! 🚀🌕
In short:
RVN’s breakouts lined up with Fibonacci time counts before.
Zone 1 → 2019 breakout.
Zone 3 → 2021 breakout.
Zone 8 → Oct 27, 2025?
If history rhymes, Ravencoin may be preparing its next moonshot right on schedule. 🚀
Ravencoin’s launchpads have followed a surprising Fibonacci rhythm.
⏳ The Time Structure
Zone 1 (2018–2019): From genesis until the bar just before the first breakout (Feb 2019).
Zone 2: Skipped.
Zone 3 (2020–2021): From bottoming until Jan 2021 — again, the bar just before breakout.
Zone 5: Skipped.
Zone 8 (2025): If the same rhythm holds, we are now approaching the next critical launchpad.
📌 By extrapolation, the Fibonacci sequence (1–2–3–5–8) suggests the next breakout window opens around 27 October 2025 .
🧩 Why it matters
RVN’s history shows not just price fractals, but time fractals.
Each parabola was preceded by a Fibonacci-timed compression phase.
Skipping intermediate numbers (2, 5) makes the hits at 1, 3, and now 8 stand out even more.
🎯 Projection
Breakout could ignite in late October 2025.
Potential parabola similar to 2019 and 2021 cycles.
Target range: $0.25 → $0.50 if structure repeats.
📉 Bearish gift scenario
The current chart still carries a bearish bias.
A dip to $0.010–$0.009 cannot be excluded.
Instead of invalidating the setup, such a move would act as a final spring.
For long-term holders this is a gift — a last clean add opportunity before liftoff.
📚 Educational sidebar: Why Fibonacci often aligns with market cycles
The Fibonacci sequence (1, 2, 3, 5, 8, 13…) is not mystical — it’s structural.
Nature & growth: Plants, shells, galaxies, all grow in Fibonacci ratios.
Human behavior: Financial markets are driven by collective psychology. Fear, greed, and crowd timing often cluster around these proportions.
Markets: Traders unknowingly reinforce these rhythms by using Fibonacci retracements, extensions, and time zones.
👉 The result? Market cycles often “breathe” in Fibonacci counts — not perfectly, but frequently enough to create repeating patterns.
Ravencoin: First Dump… Then Pump
In short:
Ravencoin is repeating its 2020–2021 launchpad.
Strong base at ~$0.012.
Possible final dip to $0.010–0.009 (a “gift” add opportunity).
Breakout window: Oct–Nov 2025.
Projection: $0.25 → $0.50 if parabola plays out.
Fractals aren’t certainties, but RVN is following its own proven roadmap.
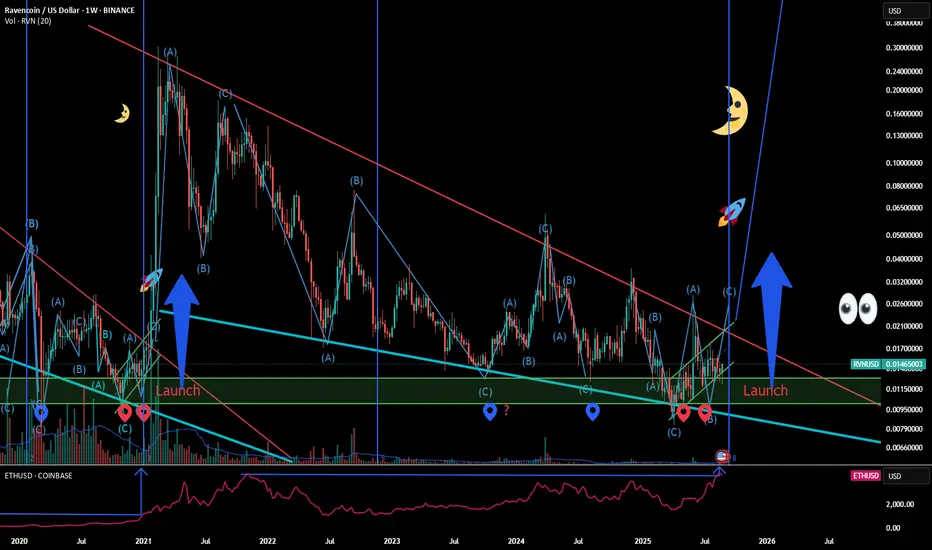
RVN – Copy/Paste Fractal 2020 → 2025
Fractal overlay method: same coin, same launchpad
What you see here is not a random fractal from another asset — it’s Ravencoin’s own parabola from Nov 2020 → Feb 2021. That launchpad has been copy/pasted directly onto the current chart.
🔑 Important note on timeframe:
The 2020–2021 sequence was built on weekly candles. The current chart is 2-day candles.
That means 1 old candle ≈ 7–8 current candles.
In other words, the same structure now plays out at a slower pace — stretched in time.
🧩 Structural similarities
Support: Both cycles established a strong base at ~$0.012.
Spring dip: Fake breakdown under support → recovery.
Compression: Weeks of tight sideways action inside a channel.
Breakout trigger: Once the red diagonal breaks, the parabola begins.
⏳ Timing roadmap
2020–2021 launchpad lasted ~3 months.
Adjusted for the slower “7–8x candle speed,” the current launchpad could extend until Oct–Nov 2025.
That lines up perfectly with the ongoing channel compression.
📉 Bearish bias scenario
The current timeframe still carries a bearish bias.
That means a final washout toward $0.010 or even $0.009 cannot be excluded.
Instead of invalidating the fractal, such a move would actually strengthen it:
It would act as the “spring” flush, identical to 2020.
For long-term holders, this would be a gift — a last, clean add opportunity before parabola ignition.
🎯 Potential projection
First breakout target: $0.25.
Stretch potential: $0.50 (if the parabola mirrors 2021).
⚠️ Key takeaway
Fractals aren’t predictions, they’re roadmaps of market psychology.
The shapes rhyme — but amplitude and timing can shift.
Still, Ravencoin is repeating its own proven playbook.

Ravencoin – Risk First - How I Size, Split and Survive
Ravencoin – My Risk Management and Entry Strategy
🔎 In short (My Trading Plan)
Max RVN exposure: 20% of capital (not fun but tolerable even if setup fails).
Entry split: 50% in launchpad ($0.012–0.020), 20% on confirmed breakout (2–3× volume), remainder only if breakout holds.
Risk scenarios: Fail = –10% to –20%; Success = asymmetric upside.
Note: this is my plan - this works for me, my personal situation & risk tolerance - you must do what works for your risk tolerance & situation.
Wisdom: Loss is real, profits are air — and while BTC may 2× RVN’s asymmetry could reach 200×.
Risk management is more important than any setup.
Rule #1: Don’t lose money.
Rule #2: Go back to Rule #1.
That means: never risk what you can’t afford to lose — not rent, food, tuition.
Only deploy capital that you can carry through a complete failure of the setup.
🎯 Maximum Position Size
For me, the absolute maximum position is 20% of my total free available capital in RVN.
This is the most I can justify, mentally & economically because even in a complete failure the loss remains tolerable.
📈 Entry: Spreading the Risk
The key decision is not if to enter, but how.
Early entry → cheaper price, but if the setup fails, you are immediately underwater.
Breakout entry (“the elephant”) → higher price, but confirmation through volume and structure.
The solution: the golden mean.
🧭 My Allocation Plan
50% accumulated around $0.012–0.020 (launchpad zone).
10% 20% added on breakout in increments of 2 days if confirmed by 2–3× volume and if the second daily candle does not collapse back into the wedge.
Remainder added only if the breakout holds and develops strength.
If price leaves without me → No problem at all!
I am happy to keep the position smaller because chasing a higher entry destroys risk–reward.
⚖️ Risk Scenarios
If RVN breaks out on high volume but immediately fails → 20% risk.
If RVN never breaks out and collapses from the launchpad → 10% risk.
If the setup succeeds → asymmetric upside, multiples of the risk taken.
💡 Core Wisdom
It is wise to look first at the potential loss, not to get carried away by possible winnings — because at this stage, profits are still only air.
Loss is real, profits are not yet realized.
For Bitcoin, maybe a 2× remains possible in a mania.
For Ravencoin, the asymmetric potential is closer to 200×.
That is why discipline on the downside matters most.
🎯 Reducing Risk Even Further
To make sure risk stays under control, I take 10% off the table immediately at $0.15.
This early profit is enough to cover the entry cost.
From that point forward, the remaining position is effectively “house money”.
Psychological benefit: less stress, more patience to ride the parabola.
Strategic benefit: downside becomes negligible, while upside remains open.
✅ Core Principle
Once the entry is repaid, the trade is no longer about survival, it’s about opportunity.
If RVN fails after that, the trade costs me nothing.
If RVN succeeds, the remainder of the position compounds into asymmetric gains.
✅ Conclusion
Risk is always real. But by defining a maximum position size and staggered entries, I ensure that failure means a contained loss, while success means life-changing reward. That’s why risk management is not an afterthought — it’s the core of the trade.
Final Note
“Risk is real, profits are air — discipline pays.”
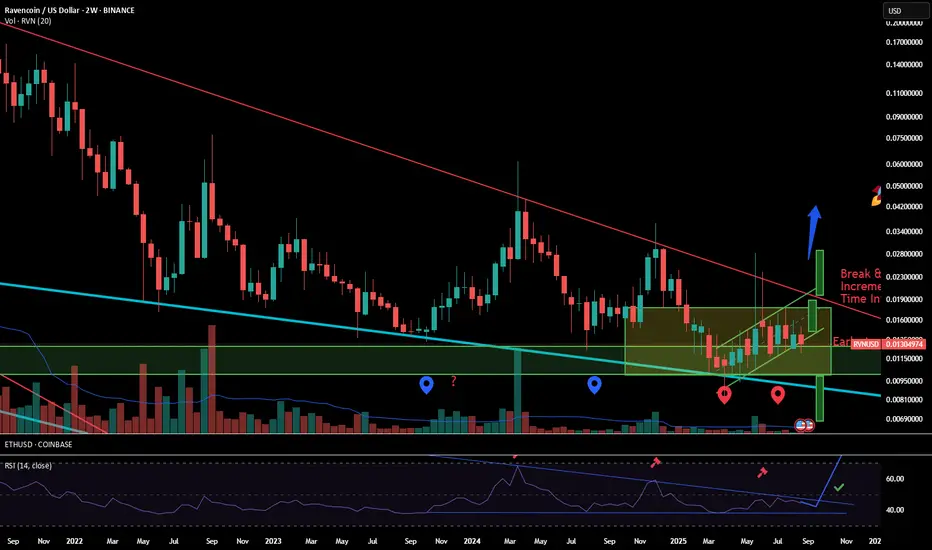
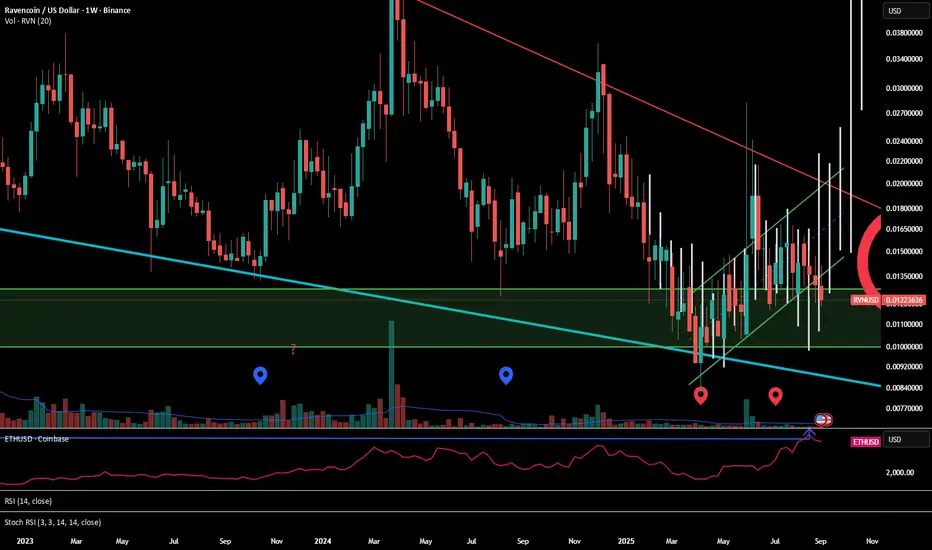
RVN – 2W Stochastic - The Pressure Cooker Setup
Ravencoin – Price and Momentum in a Pressure Cooker!
In short:
Ravencoin has compressed for years in a falling wedge with $0.01 as the launchpad. Now even the 2-week Stochastic RSI shows its own pressure cooker under a sloping resistance. Once both price and momentum break free, the conditions align for RVN’s next parabola.
Ravencoin has spent years inside a falling wedge structure, compressing into the $0.010–0.013 launchpad zone. Each shake-out has been absorbed, fuel has been building, and the wedge is approaching maturity. But now there is a second layer of confirmation: momentum itself is also trapped in a wedge.
🔋 The Launchpad
$0.010–0.013 has acted as a fuel zone, where weak hands exit and strong hands reload.
The longer price holds this base, the more energy is stored.
📐 The Falling Wedge
Multi-year compression with lower highs and higher absorption at support.
Historically a bullish reversal structure once broken on volume.
📊 The Momentum Pressure Cooker
On the 2-week timeframe, the Stochastic RSI has its own downward-sloping resistance line.
Momentum has been capped for years, forming a miniature wedge inside the oscillator itself.
This is the pressure cooker effect: every failed breakout attempt builds more energy.
A decisive cross and close above this oscillator resistance would confirm a major momentum shift.
🔗 Confluence
Price wedge → near breakout.
Wyckoff structure → Spring complete, SOS ahead.
Ethereum rotation → historically the trigger for RVN’s parabolic run.
2W Stoch RSI breakout → momentum confirmation.
✅ Conclusion
Both price and momentum are now in compression. Ravencoin is not only pressing against its falling wedge resistance, but its 2-week Stochastic RSI is also trapped in a pressure cooker. Once momentum breaks above its own trendline, the setup aligns with price breakout — and that may be the ignition signal for the next major parabola.
Next Article
Risk Management - Stay Alive, don't bet the Farm.

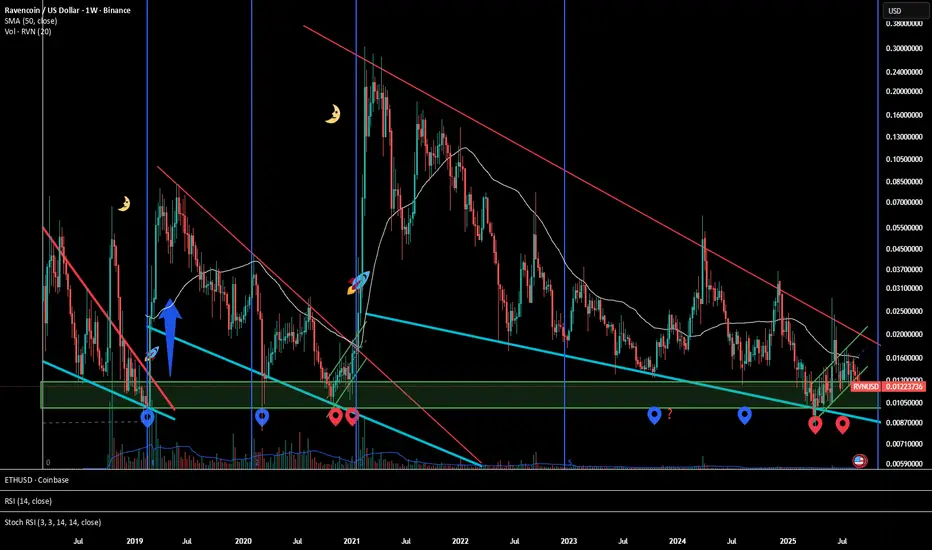
RVN – Wyckoff script – Wyckoff Says Fuel Loaded”?
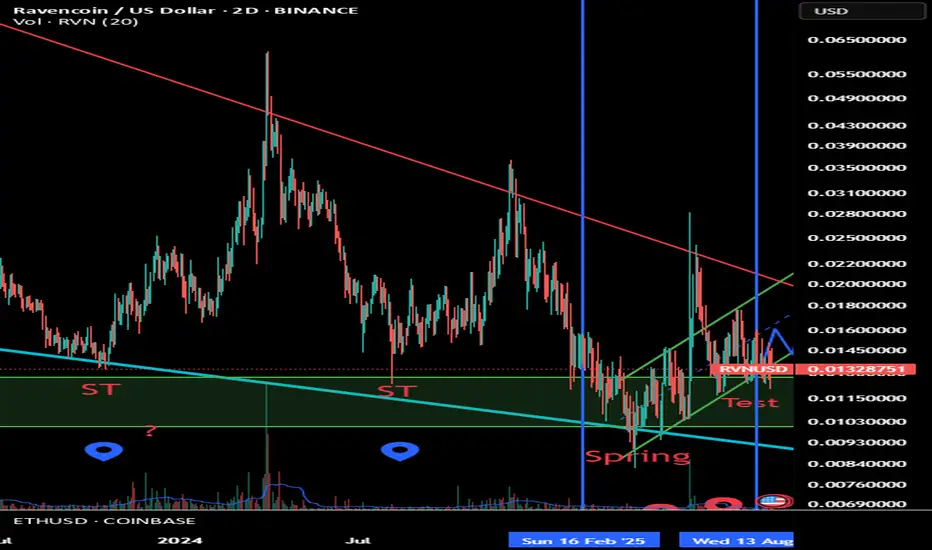
In Short:
Ravencoin has followed a textbook Wyckoff Accumulation : Selling Climax, multiple Secondary Tests, and a Spring shake-out around $0.01. The structure now enters Phase D, with a Sign of Strength and Last Point of Support likely ahead.
Once confirmed, the markup phase (moon) could replicate RVN’s 2021 parabola! Downside remains limited to the launchpad zone, while upside targets extend toward $0.10–0.25 or more.
Ravencoin – Wyckoff Accumulation in Action
Ravencoin’s chart shows a textbook example of a Wyckoff Accumulation structure, unfolding over several years inside a broad falling wedge. What looks like endless decline is, in fact, a deliberate process of shaking out weak hands and transferring supply to stronger ones.
🧩 Wyckoff Phases on RVN
Phase A – Stopping the downtrend
Preliminary Support (PS) and the Selling Climax (SC) near $0.01 signaled the exhaustion of sellers.
The Automatic Rally (AR) followed, showing the first sign of demand.
Phase B – Building the cause
Multiple Secondary Tests (ST) returned price to the launchpad zone ($0.010–0.013).
Each dip was absorbed faster, with less volume.
This phase served to wear out weak holders and allow accumulation by stronger hands.
Phase C – The Spring
A sharp shake-out below support triggered stops and flushed late believers.
This “Spring” was immediately followed by a strong rebound back into the range — classic Wyckoff behavior.
Phase D – Sign of Strength (SOS)
Breakout attempts above the falling wedge resistance mark the start of the Sign of Strength.
The Last Point of Support (LPS) will likely retest the breakout area before a full parabola begins.
Phase M(oon) – The Markup
Once SOS and LPS are confirmed, the markup phase can accelerate.
Historically, RVN’s markup runs have been fast and vertical (2021: $0.02 → $0.28 in weeks).
Targets from this structure extend toward $0.10, $0.25, and higher.
📐 Confluence Factors
Falling wedge maturity aligns with the Wyckoff Spring.
Ethereum’s breakout in 2021 preceded RVN’s parabola — ETH is again near highs.
Fuel zone ($0.01–0.013) has been tested multiple times and held, confirming accumulation.
⚖️ Risk–Reward
Downside: If the Spring fails, risk is limited to the launchpad zone.
Upside: A confirmed SOS → LPS sequence opens the door for a rapid parabola.
👉 Summary: Ravencoin has followed the Wyckoff script step by step: SC, ST, Spring, and now approaching SOS. With ETH surging and supply absorbed, RVN may be on the verge of transitioning into its long-awaited markup phase.
Next Article: ''Look Out Below!" - Risk Management, Safety First!
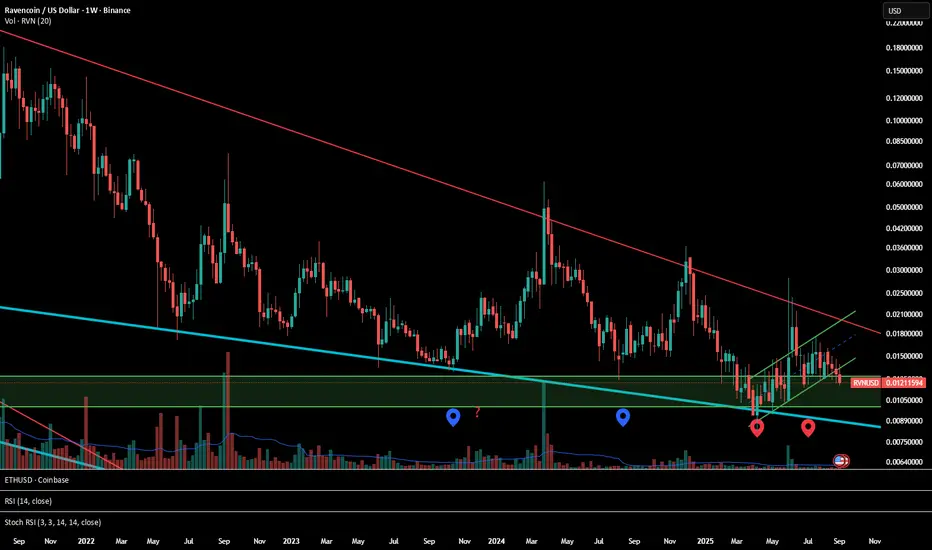
Ravencoin – Falling Wedge, Fuel Zone, and Parabola Potential
Ravencoin has spent years consolidating inside a broad falling wedge structure. What looks like relentless decline is in fact a long compression phase: each new low carries less momentum, and every dip is quickly absorbed.
🔋 The Launchpad
The $0.010–0.013 zone has acted as a fuel tank. Each return to this level flushes out weak hands while strong hands quietly reload. The longer RVN stays here, the more energy is stored for a breakout.
📈 The Technical Setup
Falling wedge nearing completion → compression is mature.
Shake-outs below $0.010 have been consistently absorbed.
Higher lows on short timeframes suggest accumulation pressure building.
Orderly price action vs. the “whippy” moves of earlier months hints at stronger hands in control.
🔗 The Broader Context
RVN’s historic parabola in early 2021 ignited shortly after Ethereum broke its ATH. The same conditions may be aligning again:
BTC has already gone parabolic,
ETH is pushing higher in its own rotation,
Alt liquidity historically flows next.
🐘 The Trigger
The setup is simple: watch for the elephant candle — a breakout with 3–5× average volume that closes above the wedge. This is the classic ignition signal that can transform a long accumulation into a rapid parabola.
🎯 Risk–Reward
Downside: Accumulation fails → risk is limited to the launchpad zone.
Upside: A confirmed breakout could target $0.10, $0.25, or beyond, replicating the asymmetric payoffs of 2021.
📐 Fibonacci Time Zones
A striking feature of RVN’s historical chart is how major turning points align with Fibonacci time windows. The 2019 and 2021 parabola launches both coincided with these time projections — and the current wedge is once again pressing into a key zone.
Time zones don’t drive price, but when combined with technical compression they can highlight periods where big moves are most likely.
In this case, wedge maturity and the Fibonacci window overlap, creating extra confluence.
Personal note
My former analysis was right in the pattern, but off in timing.
The wedge extended longer than expected — but that only means more fuel has now been loaded.
👉 Summary: Ravencoin sits at the intersection of a mature falling wedge, a fully loaded fuel zone, and a Fibonacci time window, absorbed every shake-out, and continues to fuel at $0.010–0.013. If the elephant candle confirms, the parabola could ignite quickly, swift and decisive.
👉 In the next article: Wyckoff, targets, stop loss & other fun stuff.
RVN Ravencoin Long UpdateRavencoin trading plan with exact entry & exit points.
First determine the max. to invest.
My plan is 1/3 positon now (did it a week ago but now is still fine)
1/3 breach of former month high red candle.
1/3 at breakout on high volume.
Stop at 0.012. At that level I consider my thesis falsified.
Also when it didn't move in the periode Jan/March I get out.
First profit target $0.25 former high. 25%
1 st rule: don't loose money (Warren) gets money back.
Second profit target $1.50-$2.00
Laddering out. 75%
Example sell 25% at $1.50, 25% at $1.60 and so on.
OR leave a 20% moon bag at discretion.

RVN Ravencoin LongCompletion of a multi-year fractal pattern.
Like XRP.
When they're gonna fly, they fly!
Target $1.50
A potential mega trade.
Risk $0,01
Reward $1,50
I'm putting my cards on it!
AND my money!


C-fork + iH&S on Ravencoin daily chartRVNUSD looks like a textbook Chuvashov fork supported by inverted Head & Shoulders.
Next couple of days will be very telling. If iH&S holds, this should result a very nice move up.

RVN - Full roadmap chart of RavencoinMany confirmations in this Raven chart, don't ignore RVN.
Something big is about to come to RVN
Entry Zone: 0.016 - 0.017
Sell Zone:
T1: 0.04
T2: 0.07
T3: 0.14
Good luck.


Ravencoin (RVNUSD) new targer $2.05
- According to the previous cycle shows that after breaking the trendline ravencoin reached to $0.3 (log chart fib retracement target was $0.3)
- And now this time the same trend line has been broken. If history repeads (generally it does in cryptocurrency charts) this tme the same fib retracement value hits to the new target ($2.05)
- This is an educational work and do your own homework before investing this coin.

RAVENIf the token waiting at a critical level breaks the resistance, it can rise sharply. if we follow closely, our earning potential is high

Superlong Ravencoin 3 year old downtred broken. While downtrend retest is possible, I don't expect for price to sit this low much longer and am looking for monster move up here.
Few more observations making this even more bullish:
200 EMA on daily chart also suggests upward PA.
nice weekly RSI divergence on BTC pair.

2 Week Cpsan Trade ActivatedAs we can see, price closed over the 2W tenkan yesterday. Mirroring the last bull run from approximately 2 years ago, the trade to the kijun is activated.

RVN • CRYPTO RavenCoin • LONG TF H1#RVN • CRYPTO RavenCoin • LONG TF H1 ,
TP =0.01878 , SL = 0.01668
The trend continues, the nearest support level according to my calculations TP =0.01878

Raven to 🌕Rvn broke through a very important resistance line in the weekly chart .. and know it holding position
It is suposed to hit 0.0234 if the price break the 0.019 line ... Let us see whats happen this month

RVN about to moveSimple setup - downtrend broken. Altcoins popping left, right & center, I expect RVN to pull a monster move.
