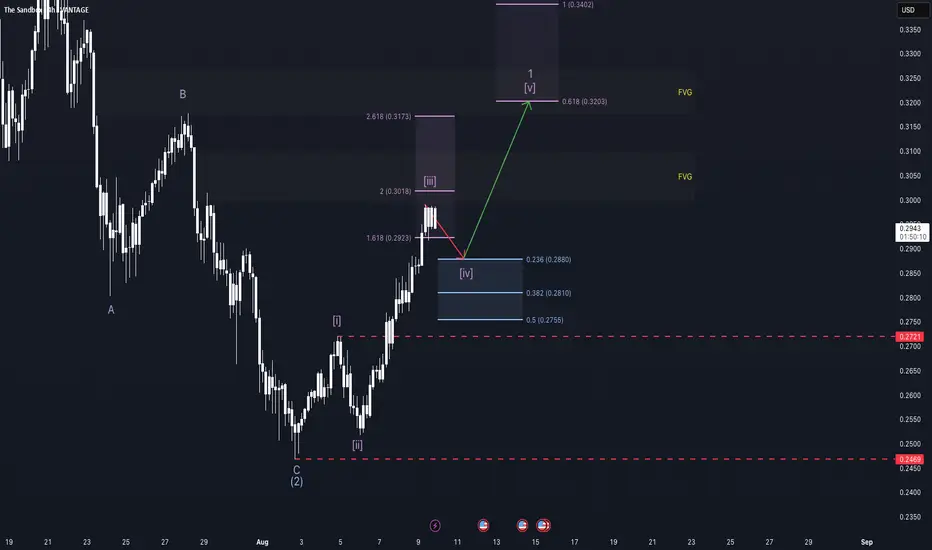
Undecided. - SAND/SAN weekly update August 9 - 15thThe Sandbox (SAND) is currently advancing within a strongly aligned Elliott Wave structure. At the Cycle degree, price is in Wave 3; at both the Primary and Intermediate degrees, it is also in Wave 3; and at the Minute degree, the market is completing a smaller Wave 3. From a Smart Money Concepts perspective, it would make sense for price to dip into the lower highlighted Fair Value Gap (FVG) before continuing higher, as this aligns with key Fibonacci retracement levels. Even a quick wick into this zone would be sufficient to rebalance price before continuation.
Following this potential retracement, the structure anticipates a short Wave 4 followed by Wave 5, which is projected to terminate in the upper FVG marked on the chart. This interpretation fits well with the overall bullish macro structure. However, if Wave 4 were to drop below the top of Wave 1, the current count would be invalidated. A move below the start of Wave 1 would raise the probability that the current advance is part of a more complex corrective structure rather than a sustained impulse.
From a derivatives perspective, funding rates remain positive while open interest is stagnating, indicating steady but not accelerating long participation. The liquidity heatmap shows significant liquidity resting below the Wave 2 low, which could act as a magnet for a short-term sweep before continuation.
On a broader level, this setup aligns with the macroeconomic backdrop. The CME FedWatch Tool currently shows a 88.9% probability of a Federal Reserve rate cut at the September FOMC meeting. Such expectations often lead to markets front-running the event, potentially fuelling impulsive Wave 3 rallies across the crypto sector. However, if bullish positioning becomes excessive, the risk of a “sell-the-news” reaction or a liquidation event increases — particularly in assets like SAND, which are already in extended third waves. Institutional positioning likely occurred earlier in the cycle, leaving retail traders to provide the momentum for the next legs up.
As long as key support levels hold and the lower FVG provides the anticipated reaction, SAND remains well-positioned for a continued advance toward the 0.320–0.340 range, with multiple wave degrees supporting the bullish case.
SANDUSD trade ideas
THE SANDBOX mid - to long - termThis might seem obvious to some, but it’s worth emphasizing —
📌 When analyzing charts like this, switch to a Line Chart instead of Candlesticks.
Why?
It filters out market noise and shake-outs
You can clearly see how price respects key zones and levels
Candles often distort the picture with wicks — line charts show the real body movement
Bullish Setup:
Market has printed a clean W-bottom, confirming bullish intent.
We are currently retesting the neckline of the pattern — a common and healthy move before continuation.
A successful retest could lead to an impulsive move upward toward target zones.
🎯 Target Zones:
Green zone (top) — this is the maximum target in the current structure.
Anything above the red line already carries increased risk, and should be approached with caution.
Above green zone = extreme risk / high-probability rejection unless backed by strong fundamentals.

SANDBOX RALLY..Since 2021, SAND has been quiet but now holds strong support at $0.22. I believe a rally to $2.70 is likely in the coming months.
(ITS NOT A FINANCIAL ADVISE)

SANDUSD targeting the 1day MA200 at 0.42000Sandbox / SANDUSD has entered a Channel Up structure ever since it double bottomed on Support A and crossed above the Falling Resistance.
Now it's supported by the 1day MA50 and is aiming at a new Higher High on the 1day MA200.
Target 0.42000
Follow us, like the idea and leave a comment below!!

Inverse Head and Shoulders in SAND: Breakout Ahead?Crypto markets are waking up and SAND is showing a strong inverse head and shoulders setup that could spark a fast rally. ADA is also forming a bullish triangle with macro factors like tax cuts and a US UK trade deal adding momentum. The mood is shifting and big moves could be just days away.
This content is not directed to residents of the EU or UK. Any opinions, news, research, analyses, prices or other information contained on this website is provided as general market commentary and does not constitute investment advice. ThinkMarkets will not accept liability for any loss or damage including, without limitation, to any loss of profit which may arise directly or indirectly from use of or reliance on such information.

SANDUSD: The recovery back to 1.07350 has started.Sandbox (SANDUSD) is marginally bearish on its 1D technical outlook (RSI = 43.227, MACD = -0.001, ADX = 35.488) as it dropped below its 1D MA50 again. However, the breakout over its 5 month LH trendline has already happened and calls for a long term recovery. As you can see the Fibonacci retracement levels form fairly symmetric Resistances with the previous LH levels, so we expect them one by one to get filled (final TP = 1.07350).
## If you like our free content follow our profile to get more daily ideas. ##
## Comments and likes are greatly appreciated. ##

SANDBOX: $0.55 | Waiting for RESETthe metaverse ahead of its time
where market discounted the 10year reality in just 24 months after launching
very well regulated float gradually increasing
as the original investors finally unloads holdings
COST of OGs $0.003 to $0.005
Stabilization for buy back should be at $0.18 and all the way to $0.07
kinda like cardano or doge where at sub .10 cents DEALERS or BROKER custodians
began ACCUMULATING heavily for that next Bull RUN

SAND BOX bullishsand box on monthly and weekly TF looks really bullish to me, and im expecting a huge upside movement to about $3 for mid-term


short sand sand just broke a a weak support zone , a good chance to short and make some profit, don't high leverage , market not stable. sell of once it reach the strong support zone. Thanks and good luck


SAND ready for blast to psychological 1 USDSAND is going for the good'ol 1-2-(1-2-3-4-5)-4-5, accumulating nicely, taking a rest to shoot for the final leg to 1.0-1.38 USD range.

SANDUSD: +3000% rally is already underway.Sandbox just turned bullish on its 1D technical outlook (RSI = 58.400, MACD = 0.097, ADX = 49.1720) as following a 1D Golden Cross, it entered a very strong rally, which has now neutralized the trend and is consolidating. The 1D RSI is turning into a Bullish Flag, resembling the rally of the previous Cycle that started in January 2021. That rise didn't break under the 1D MA50 before peaking on a massive +3,000% growth. We are bullish, expecting a similar rally (TP = 6.5000).
## If you like our free content follow our profile to get more daily ideas. ##
## Comments and likes are greatly appreciated. ##

Sandbox Breaking Out Of 3Yr ConsolidationBuilding the Future of the Metaverse
The Sandbox is a decentralized virtual world where users can create, own, and monetize digital experiences using blockchain technology. Powered by NFTs and its native token, SAND, it offers tools to design games, virtual real estate, and interactive experiences, all within a thriving metaverse ecosystem.
Future Value Proposition
As the metaverse becomes a key part of the digital economy, The Sandbox is set to lead with its community-driven approach, partnerships with global brands, and innovative monetization opportunities. It’s more than a platform—it's the foundation for creators to shape the next era of digital interaction and ownership.
Target 2.618 Fib=$3.65

SAND/USD Fibonacci TargetsThe current chart shows the most important Fibonacci targets.
Grey: Resistance/support, decisive prices. A dump/pump can happen at these levels, but is not a main target
Red: Main target to take profits or potentially enter shorts
Green: Buy or rebounce expected
Red box: resitance are, mainly caused by the 1.618-1.65 fib level
Green box: Support level, mainly 0.618-0.65 fib
Breaking each target gets us to the next one.

The Sandbox ($SAND): Leading the GameFi and Metaverse RevivalThe GameFi and Metaverse sectors are roaring back, with The Sandbox ( NYSE:SAND ) at the forefront of this resurgence. After a prolonged downtrend, NYSE:SAND has staged a remarkable comeback, surging 292% in just over two weeks. Starting from $0.20, it touched nearly $1 before consolidating around $0.75, currently down 3%. This rally has reignited interest in GameFi projects, positioning NYSE:SAND as a key player alongside Decentraland (MANA), Gala (GALA), and Axie Infinity (AXS), which have also seen significant gains.
Fundamental Catalysts
Several factors underscore NYSE:SAND ’s impressive performance. On-chain data reveals a surge in daily transactions, reaching 11,597—the highest in the past week. This spike indicates growing investor confidence and heightened network activity. Additionally, the rise in exchange withdrawals suggests that long-term holders are moving their tokens off exchanges, signaling a bullish sentiment and reduced sell pressure.
The Sandbox ecosystem has also benefited from renewed interest in the Metaverse and GameFi sectors, as projects with tangible utility and strong communities attract capital during this market phase. This broader revival aligns with the resurgence of decentralized applications and virtual worlds, where NYSE:SAND remains a prominent utility token.
Technical Outlook
From a technical standpoint, NYSE:SAND has broken out of a long-term falling wedge pattern—typically a bullish reversal signal. This pattern had previously led to a 75% decline, but the recent 292% surge marks a significant recovery. The breakout has set the stage for potential further gains, with the next target at $1.40. However, caution is warranted as the Relative Strength Index (RSI) is currently in overbought territory.
A retracement to the 38.2% Fibonacci level could provide a strategic entry point for investors looking to capitalize on the next rally. This correction would be healthy, allowing NYSE:SAND to build a stronger foundation for its upward trajectory.
Broader Market Dynamics
NYSE:SAND ’s performance is closely linked to the broader cryptocurrency market, particularly Bitcoin ( CRYPTOCAP:BTC ). As CRYPTOCAP:BTC eyes the $100,000 milestone, altcoins like NYSE:SAND often mirror its movements. A sustained Bitcoin rally could propel NYSE:SAND toward its $1.20 target and beyond, especially as the GameFi narrative gains traction.
The recent surge in Metaverse-related tokens reflects a growing consensus that virtual worlds and decentralized gaming will play a crucial role in the next phase of blockchain adoption. The Sandbox’s strong fundamentals, combined with its active development and partnerships, position it well to benefit from this trend.
Investor Takeaway
The Sandbox’s rally is more than just a technical bounce; it represents a fundamental resurgence in the GameFi and Metaverse sectors. Investors should monitor key support and resistance levels, stay attuned to Bitcoin’s movements, and watch for signs of continued on-chain strength. NYSE:SAND ’s journey from $0.20 to nearly $1 is a testament to its potential, and the path to $1.40 and beyond could be within reach if the current momentum holds.

0.94 Showdown: Bulls vs. Bears – Who Wins?
The current structure in SANDUSD remains bearish, marked by consecutive BOS (Break of Structure) to the downside. However, the price is currently testing the crucial 0.94 level , which could signal a shift in momentum if broken and held.
- A confirmed break above 0.94 and a sustained move above the EMA Ribbon could signify a potential change to a bullish structure. In this case, the next target lies at 3.1 .
- Conversely, if the price fails to break above this strong resistance zone, it may revisit the accumulation zone at 0.24 , which has previously acted as a significant support level.
The Signal Builder recently provided a bullish signal, but the price is now facing a critical supply zone, adding to the uncertainty.
Key Insights:
- Bullish confirmation requires a breakout and hold above 0.94 .
- A pullback to 0.24 could offer another opportunity for accumulation.
- Watch for how the price interacts with the EMA Ribbon as it aligns with the resistance zone.
👨🏻💻💭 Will SANDUSD manage to break resistance and target 3.1 , or is a retracement to 0.24 more likely? Let’s discuss below!
_________________________________________________________________
The information and publications within the 3Commas TradingView account are not meant to be and do not constitute financial, investment, trading, or other types of advice or recommendations supplied or endorsed by 3Commas and any of the parties acting on behalf of 3Commas, including its employees, contractors, ambassadors, etc.

SANDUSD heading towards the double bottom neckline/channel toptl It appears the gaming/metaverse cryptos have been awakened as they all appear to be getting a nice pump today while the rest of the market appears to be consolidating. Sand has a channel (in dark bluish purple) and a double bottom currently in play. The breakout targets for both are roughly in the same price zone. *not financial advice*

SANDUSD - Big BreakoutSANDUSD has broken out of a major down channel
I think there might be some structure formation before the next move, if not this thing should keep going
Bullish !
Daily timeframe

Sandbox (SAND)After completing its 5th upward impulse wave, Sand entered a corrective phase and now it seems finished. Price broke the downtrend line; have to wait and see if price can break the horizontal resistance area too or not. Let's see what happens.

SAND last wave down?Looks like a triangle. 5 th wave down and then bullrun?? Who know. Just put alarm on the lower trendline. Trade save

will SAND get out the sand Here we have SAND on the monthly TF. Please observe how price is very close to the key level and long-term trend line. Please observe the short-term trend line. If November price breaks that short-term trend line, there is a possibility of a rally. We must wait for the November candle to print.

SAND LongAccumulation at pcz of bullish shark after making ATL. Easy spot to size up.
To consider - Shark isn't perfect as the D extension is short of the 1.618 threshold.
