SANDUSDT Breaks Major Downtrend – Golden Pocket Retest!
Technical Analysis:
SAND/USDT has successfully broken out of a descending trendline that had been capping the price since late 2024. The breakout occurred with increased volume, signaling strong buyer interest.
Following the breakout, price rallied and is now retesting a key support zone, which includes:
A demand zone (yellow box) between 0.2748 - 0.2885, aligning with the Fibonacci Golden Pocket (0.618 - 0.5)
A solid horizontal support around 0.2913
Fibonacci retracement levels are clearly defined:
0.3126
0.3467
0.4010
0.5417
Up to major resistance near 0.9384
---
Bullish Scenario 🟢:
If the price holds above the Golden Pocket zone and prints bullish confirmation (such as a bullish engulfing or hammer candlestick), then further upside potential is likely:
1. Initial targets: 0.3126 and 0.3467
2. Mid-range targets: 0.4010 and 0.5417
3. Long-term potential: 0.6981 and possibly the major resistance at 0.9384
Stronger confirmation would come from a daily candle closing above 0.3126.
---
Bearish Scenario 🔴:
If price breaks below the 0.2748 zone, it could indicate a failed breakout, potentially leading to:
1. Initial support: 0.2700
2. Deeper pullback zone: 0.2131 (previous low)
3. Potential fakeout of the trendline breakout
A daily close below 0.2748 would strongly validate the bearish setup.
---
Chart Pattern Overview:
Descending Triangle Breakout already confirmed
Price is now in the retest phase of the breakout
The Golden Pocket Fibonacci zone is the crucial point of trend continuation or reversal
---
Conclusion:
The breakout from the long-standing downtrend marks a strong shift in structure. However, a successful retest at the Golden Pocket will be key to confirming further bullish continuation. If buyers defend this zone, SAND is likely to print a higher low and resume its upward move.
#SANDUSDT #CryptoBreakout #AltcoinAnalysis #TechnicalAnalysis #FibonacciLevels #TrendlineBreakout #GoldenPocket #BullishSetup #BearishSetup
SANDUSDT trade ideas

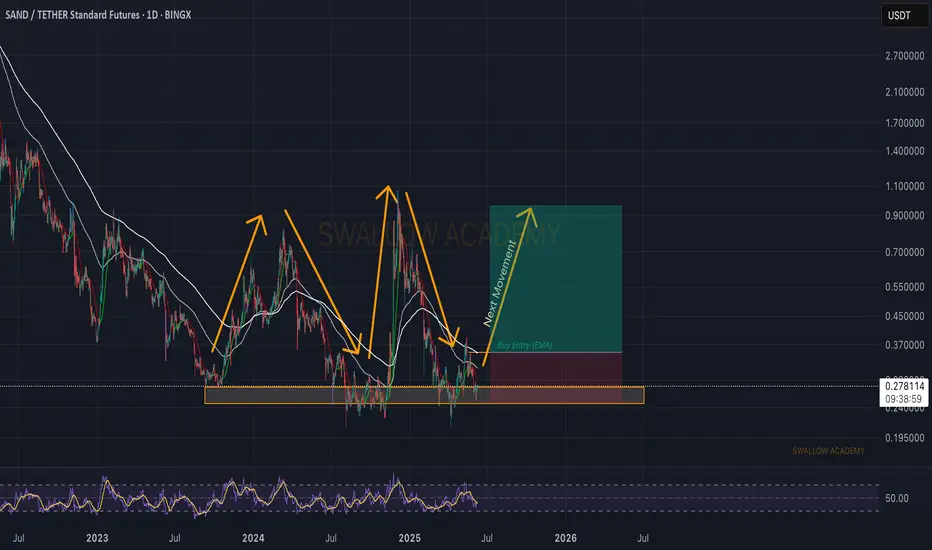
The Sandbox (SAND): Golden Buy Zone | Now or Never...Sand is one of the good long-term coins that caught our attention, where the price is at a local bottom...waiting for a proper breakout from EMAs, which would give us an easy 2.5x on the price.
There is not much to say but rather just wait patiently and enter at the right moment!. Very good R:R trade that we will not miss for sure!
Swallow Academy
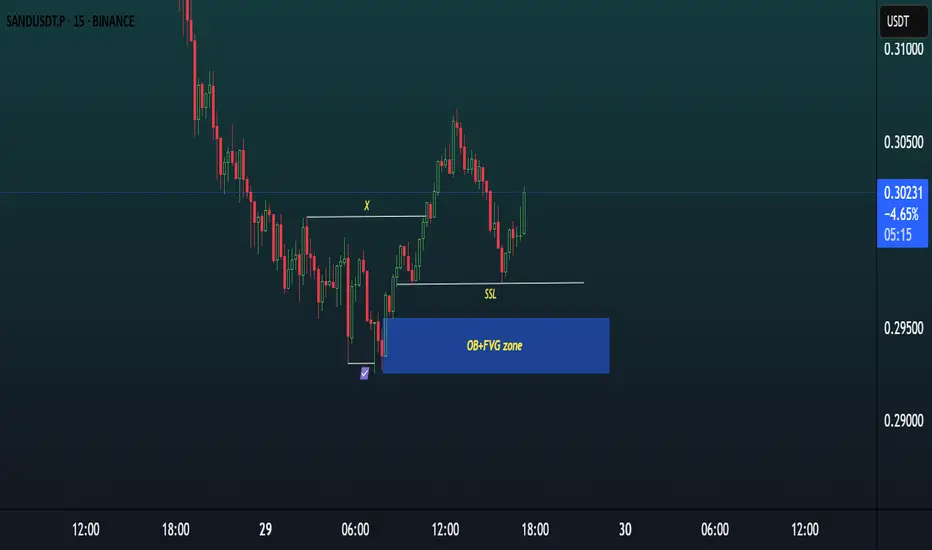
SAND SCALP TRADE IDEA.1. Market Structure:
The chart shows a bullish market structure with a clear Break of Structure (BoS) to the upside (marked by “X”).
After this impulsive move, the price has entered a retracement phase, forming lower highs and lower lows within this short-term correction.
2. Liquidity Engineering:
Sell-Side Liquidity (SSL) is visible just below the 0.2980 level, formed by equal lows and previous swing lows.
This liquidity has not yet been swept, meaning the market may still target this area to grab liquidity before any strong bullish move.
3. Key Demand Zone – OB + FVG:
Below the SSL lies a strong demand zone, marked by a Bullish Order Block (OB) overlapping with a Fair Value Gap (FVG) in the 0.2940–0.2960 range.
This confluence increases the probability of a strong bullish reaction when price enters this zone.
4. Current Price Action:
Price is currently reacting around 0.3000, showing a minor bounce, but no key zone has been tapped yet.
As SSL is still intact and unmitigated, there is a high likelihood that price will first move lower to sweep the liquidity and tap into the OB + FVG zone.
5. Trade Expectation:
Ideal setup: Wait for price to sweep SSL, enter the OB + FVG zone, and then look for bullish confirmation (such as a bullish engulfing, change of character, or lower timeframe BOS) to consider a long position.
Stop Loss: Below the OB zone (~0.2930).
Take Profit: 1.5x to 2x RR, or targeting the recent high around 0.3060–0.3080.
6. Summary:
SAND/USDT is showing bullish intent, but is likely to first sweep sell-side liquidity and tap into the OB + FVG demand zone before resuming the uptrend. Patience is key — await a clean reaction and confirmation before entering long.
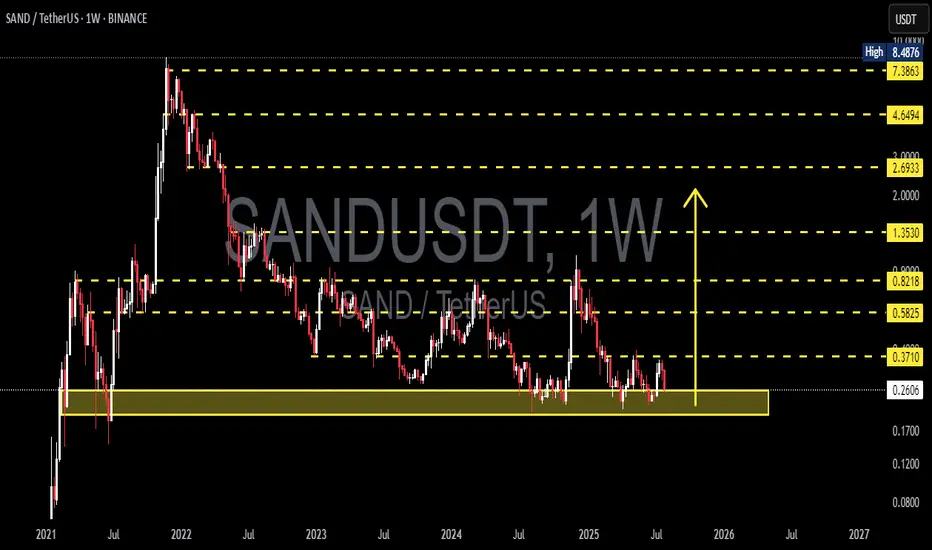
SAND/USDT Analysis – Major Accumulation or Imminent Breakdown?🔍 Overview:
SAND is currently trading at a crucial historical support zone, which has held firm multiple times since mid-2022. The chart shows a prolonged accumulation phase, offering significant potential for a major breakout or a decisive breakdown depending on market reaction.
---
🧠 Price Structure & Price Action:
After reaching an all-time high at $8.4876 in late 2021, SAND has been in a long-term downtrend.
However, over the past year, it has formed a wide base around the $0.26–$0.37 range — a clear sign of potential accumulation.
Price is currently moving sideways in a compression structure, signaling the build-up of energy for the next explosive move.
---
🧱 Key Levels:
Level Function Status
$0.2613 Primary Historical Support Currently being tested
$0.3710 Local Resistance Needs to be reclaimed
$0.5825 Major Resistance Bullish confirmation level
$0.8218 Weekly S/R Flip Mid-range target
$1.3530 Psychological Resistance Potential medium-term target
$2.6933 / $4.6494 Expansion Phase Targets Long-term upside potential
$7.3863 Pre-ATH Resistance Late-cycle target
---
🟢 Bullish Scenario:
1. If price holds and bounces off the $0.26–$0.37 demand zone, a bullish reversal may unfold.
2. A weekly close above $0.3710 would be the first sign of strength.
3. Breaking $0.5825 with solid volume would confirm trend reversal and open the path toward $0.82 – $1.35.
📌 Additional Bullish Confirmation:
Bullish divergence on RSI (if present)
Increasing volume during upward moves
---
🔴 Bearish Scenario:
1. A clear breakdown below $0.2613 on the weekly timeframe would signal a loss of major support.
2. This opens downside risk toward:
$0.17
$0.12
Possibly even $0.08 if the market seeks a deeper revaluation.
3. Such a move would likely represent a full structure reset.
📌 Additional Bearish Confirmation:
Strong bearish candles with high volume
Weak or no bullish reaction within the demand zone
---
🔁 Formations in Play:
Accumulation Rectangle: A sideways range often found at market bottoms before new bull cycles.
Multi-year Base Formation: Can serve as a launchpad for major parabolic moves if resistance is broken.
---
📚 Conclusion:
SAND is at a make-or-break zone. The market is coiled like a spring — preparing either for a new bullish expansion or for further downside pain. Smart traders and investors will:
Wait for breakout confirmation
Or exit positions on breakdown signals
This is a golden zone for preparation, not reaction.
---
📌 Suggested Trading Plan:
✅ Bullish Bias: Scale in within support zone; tight stop below $0.26
❌ Bearish Bias: Short only after weekly close below $0.26
🧠 Neutral/Waiting: Let the market prove itself
#SANDUSDT #CryptoBreakout #AltcoinAnalysis #TechnicalAnalysis #MetaverseToken #SupportZone #BullishScenario #BearishOutlook #SmartMoneyAccumulation #CryptoTA #AccumulationPhase
SANDUSDTSAND/USDT (The Sandbox):
○ Trend: Strong uptrend.
○ Current Condition: Price is consolidating around $0.32-$0.33, after reaching a high of around $0.34-$0.35, and is below significant resistance at $0.39-$0.40. Volume is decreasing during the consolidation phase.
○ Entry Recommendation: Not optimal for entry at this time. It is better to wait for the price to correct to the nearest support area ($0.29-$0.30) and look for a bullish signal from there, or wait for a clear and confirmed breakout above the resistance at $0.39-$0.40 with supportive volume.

Sandbox (SAND): Really Good Buying OpportunitySAND is at a golden spot for potential good upward movement to happen once we see a proper breakout from that 200 EMA line.
We are seeing a great R:R trading setup here so might as well try it out, but wait for a proper break from that EMA.
Swallow Academy

SANDUSDT – Long-term Spot Buy RecommendationSANDUSDT – Long-term Spot Buy Recommendation
Context: Many in the community have suffered from buying SAND at much higher levels, leading to heavily divided portfolios due to continuous DCA during the bottoming phase.
Now, our bottom detection system has been triggered—it's time to accumulate.
Trade Type: Long-term Spot
Entry Zone: Around $0.32 — the price is already attractive, no need to negotiate further.
Profit-taking Strategy:
_Sell based on Weekly (W) and Monthly (M) peaks.
_Current vision: $1, but if the market pushes to $2, we’ll fully exit there.
_Remember: $1 is just today's vision of the future—it is NOT the future.
Action: If you still have capital, it's time to buy.

SAND – Rotation in PlaySAND is showing early signs of strength off the long-term demand zone near $0.23–0.24, where it's been accumulating for several months. Price just printed a strong weekly bounce, up +16%, reclaiming the bottom of the range.
This area has acted as a key base since mid-2023 — with each touch producing a notable reaction. Now trading at $0.286, SAND is attempting to rotate toward the top of the established range.
Key Levels
Support (Range Low): $0.23–0.24 (strong demand zone)
Resistance (Mid-Range): $0.43
Range High: $0.85
A clean flip of the mid-range ($0.43) could open the door to test $0.70+.
📌 Risk management: A break and weekly close below $0.23 invalidates this setup. As long as it holds, the upside potential is attractive from a risk/reward standpoint.
This is a classic accumulation > reclaim > expansion structure. Let the chart speak if the range holds, the rotation is in play.

Sandbox (SAND): Looking For Break of 200EMASandbox has been in a downtrend for quite some time, and currently we are looking for proper upward movement, which could give us a decent switch in trend and an opportunity for long positions.
So as of now we have to wait and once we get that last confirmation of breakout, then we will be looking for a long entry near that same 200EMA.
Swallow Academy

SANDUSDTdowntrend move :
SANDUSDT market structure
for now making correction move, taking inducement before impulsive move.
SANDUSDT Forming Bullish ReversalSANDUSDT is showing a promising technical setup that could attract more attention in the coming days. The chart clearly highlights a well-defined downward channel which many traders recognize as a potential bullish reversal zone, similar to a falling wedge pattern. The good trading volume adds more conviction to this setup, indicating that larger market participants may already be accumulating positions before a breakout. A projected gain of 70% to 80%+ could be realistic if this breakout plays out as expected, making it an exciting watch for swing traders and investors.
The Sandbox (SAND) project has been a popular topic in the crypto community thanks to its role in the metaverse and NFT ecosystems. With the broader market showing signs of recovery and investors regaining confidence, altcoins with strong fundamentals and favorable technical structures like SANDUSDT could outperform. Traders will want to monitor key resistance levels along the descending trendline for confirmation of a breakout, while also keeping an eye on rising volume to validate momentum.
Community sentiment and on-chain data suggest that interest in SAND is steadily picking up again. This aligns perfectly with the technical picture, offering a solid blend of narrative and chart strength. As more traders and investors look for the next big mover, SANDUSDT could easily become a standout performer if this pattern confirms. Always manage risk properly and watch for any signs of rejection to adjust your strategy accordingly.
✅ Show your support by hitting the like button and
✅ Leaving a comment below! (What is You opinion about this Coin)
Your feedback and engagement keep me inspired to share more insightful market analysis with you!

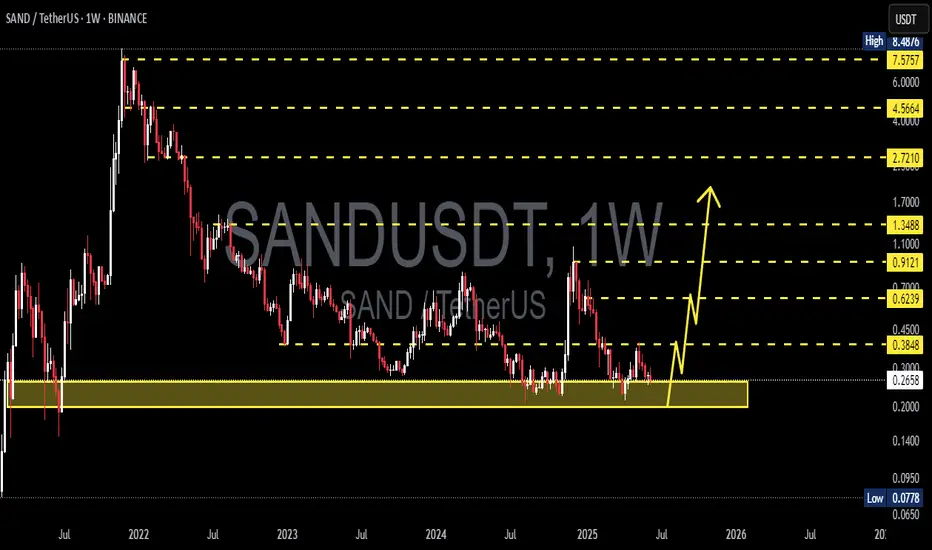
SAND/USDT at Critical Support Zone – Rebound Potential?Detailed Technical Analysis:
The SAND/USDT weekly chart shows the price currently hovering around a historically strong support zone between $0.20 – $0.25. This yellow-marked demand area has been tested multiple times since 2021 and has consistently prevented further downside, making it a crucial decision point for both bulls and bears.
🟢 Bullish Scenario:
If the price manages to hold this key support and prints bullish price action (e.g., a bullish engulfing or hammer candlestick), a reversal is likely. The projected upward path on the chart outlines the next key resistance levels:
1. $0.3710 – Initial resistance.
2. $0.4500 – First major breakout confirmation.
3. $0.5825 - $0.7000 – Mid-term resistance cluster.
4. $0.8218 - $1.3530 – Longer-term targets if bullish momentum sustains.
Bullish Confirmation:
Weekly candle close above $0.37
Breakout with strong volume beyond $0.45
🔴 Bearish Scenario:
If the price breaks below and closes under the $0.20 support zone, it would signal a bearish continuation, with possible downside targets at:
1. $0.14 – Minor historical support.
2. $0.09 - $0.075 – Extreme low support region and historical bottom.
Bearish Confirmation:
Weekly close below $0.20
Strong breakdown volume without immediate bullish rejection
📊 Chart Pattern Overview:
✅ Triple Bottom / Accumulation Zone:
The current support area resembles a potential triple bottom structure or long-term accumulation phase. If confirmed, this pattern could mark the beginning of a new bullish cycle.
🧠 Conclusion:
SAND is at a make-or-break level. As long as the price holds above the $0.20 - $0.25 support zone, bullish recovery remains a valid possibility. However, a breakdown below this level could trigger a significant bearish move.
#SANDUSDT #CryptoAnalysis #AltcoinSeason #TechnicalAnalysis #BullishScenario #BearishScenario #CryptoTrading #PriceAction #SupportResistance #TripleBottom

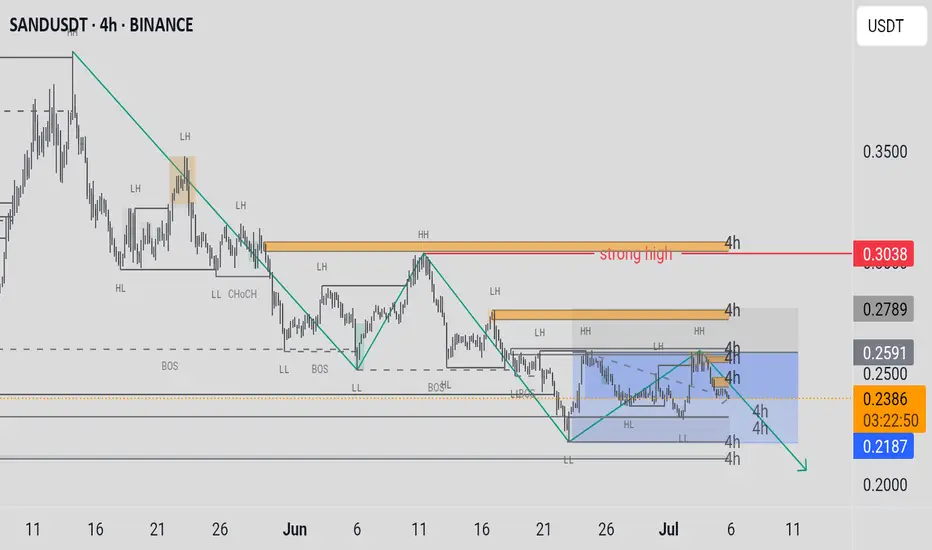
Análisis Técnico Multidireccional SAND USDT. Overall Trend and Price Patterns:
In the long and medium term, SAND's trend is bearish. This is confirmed by the 4-hour charts and higher, where lower highs and lower lows are observed. The "Smart Money Concept" indicator also indicates a "Trend: Negative".
A descending channel has been identified on the 4-hour chart, a bearish continuation pattern that suggests the price will continue to move downward within this channel. Previously, a descending triangle with similar bearish implications was considered.
2. Key Levels (Support and Resistance):
Resistance: Levels around $0.2484 (15m chart) and "Order Blocks" or "Supply Zones" (red-shaded areas) on the 1h and 4h charts.
Support: "Demand Zones" or "Order Blocks" (green/blue shaded areas) on the 1h and 4h charts, and the $0.2361 level (15m chart). The bottom line of the descending channel also acts as dynamic support.
3. Momentum Indicators and Moving Averages:
Short Term (30 min - 1 hour): Investing.com reports "Strong Buy" and the 5, 10, and 20-period Moving Averages show a "Buy" signal. Some oscillators like RSI, Ultimate Oscillator, and ROC are also indicating "Buy". This suggests a very recent bounce or bullish momentum.
Medium/Long Term (5 hours - Monthly): Investing.com reports "Strong Sell". The 100 and 200-period Moving Averages also show a "Sell" signal, confirming the bearish trend in these broader timeframes.
Warnings: Indicators like STOCHRSI, Williams %R, and CCI are in "Overbought" conditions on some timeframes, suggesting that the short-term bounce might be running out of steam and prone to a correction or bearish continuation.
4. Volume:
Volume has been significant during price declines, reinforcing selling pressure. Volume tends to decrease as the price approaches the apex of consolidation patterns.
5. Fund Flows (On-Chain):
Large transfers of SAND (over 1.8 million tokens) were observed leaving Upbit wallets to a specific address in the early hours of June 30, 2025. Such significant movements from exchanges can indicate potential future selling pressure or internal exchange movements.
Overall Conclusion:
While SAND has shown a slight bounce or bullish momentum in the very short timeframes (30 min - 1 hour), the dominant trend in the medium and long term remains bearish, confirmed by price patterns (descending channel), Smart Money Concepts analysis, and longer-duration moving averages. Indicators showing "overbought" conditions in smaller timeframes suggest that this bounce may not be sustainable in the long run and that the price could move downwards again to follow the main trend. Large token movements from Upbit add an element of uncertainty and potential selling pressure.

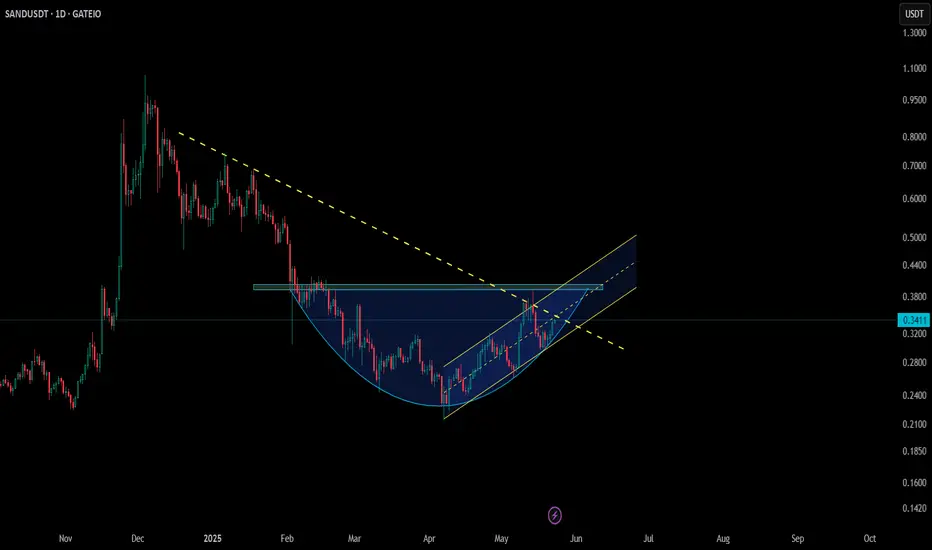
SANDUSDT 1D#SAND is currently trading inside a Falling Wedge on the daily chart.
Let’s see if it can hold the wedge support and bounce from here.
Looking at the bigger picture, it may be forming a Double Bottom.
Just like it broke out of the descending channel in April, we could now see a breakout above the wedge.
⏳ Don’t rush — wait for confirmation before entering.
If a breakout occurs, the potential targets are:
🎯 $0.2539
🎯 $0.2756
🎯 $0.2932
🎯 $0.3107
🎯 $0.3356
🎯 $0.3674
⚠️ As always, use a tight stop-loss and apply proper risk management.

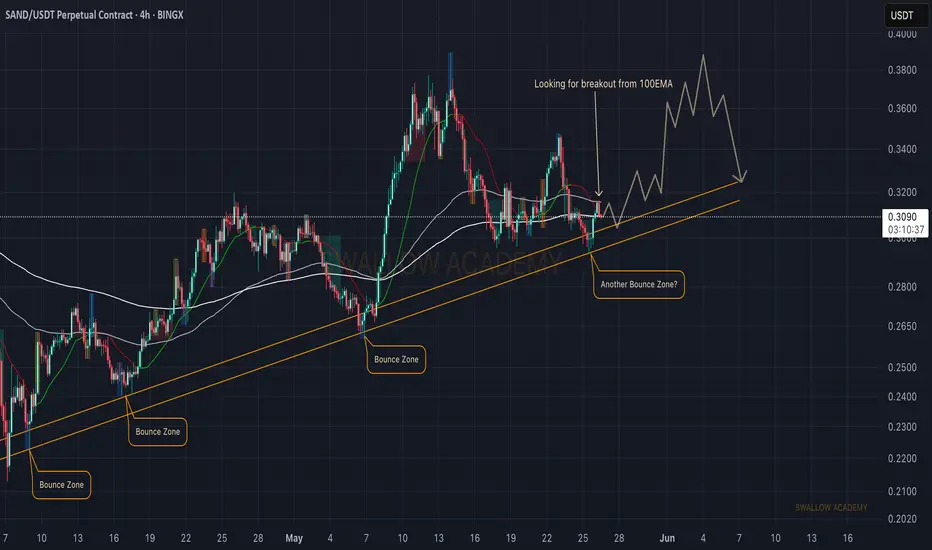
The Sandbox (SAND): Reached Strong Bullish Trend | Bounce AreaSandbox coin has recently touched again the local bullish trend from which we have been seeing some great upward movement (previously). With current bullish sentiment in the markets, we might be seeing a strong upward movement from here, and the 100EMA is our last confirmation for now.
Upon seeing it to be broken, we will be looking for a long position from there.
Swallow Academy
Sandbox (SAND): Patience Is Key | Waiting For Long EntrySandbox is at its local support area, where we are seeing the pressure from sellers, which might turn into a proper foundation for upcoming buyside movement.
We are looking for the area near the 100EMA to be secured by buyers, after which we will be looking for long!
Swallow Academy

Sandbox (SAND): Seeing Break of Structure Forming | Buy Area?Sandbox is another coin that has formed a break of structure, which can send the price higher. As long as we keep the current momentum of volume from side, we are aiming to see that upper area reached within days!
Swallow Academy

SAND analysis: Price is currently testing the support area; a break below this level would indicate a bearish trend. A candle closing below this point will likely lead to more downward movement. You may consider opening a long position, but with a tight stop-loss.

SANDUSDT 1W AnalysisSAND ~ 1W Analysis
#SAND Buy back gradually from here if you still have confidence in this coin with a short term target of at least 20%+ from this support.
sand buy spot "🌟 Welcome to Golden Candle! 🌟
We're a team of 📈 passionate traders 📉 who love sharing our 🔍 technical analysis insights 🔎 with the TradingView community. 🌎
Our goal is to provide 💡 valuable perspectives 💡 on market trends and patterns, but 🚫 please note that our analyses are not intended as buy or sell recommendations. 🚫
Instead, they reflect our own 💭 personal attitudes and thoughts. 💭
Follow along and 📚 learn 📚 from our analyses! 📊💡"

$SAND – Ascending Channel Meets Round Bottom🔥 NYSE:SAND – Structure Building Up
📆 On the daily timeframe, NYSE:SAND is forming a round bottom while also trending inside an ascending channel — signaling strong structural momentum 📈
⚠️ It’s now testing a key trendline resistance around $0.35 — a breakout here could trigger the next move up.
📊 On the weekly timeframe, price is holding above the $0.30 level, keeping the bullish structure intact 🛡️
👀 This is a pivotal zone — if bulls hold strong, the next leg could be big.
SANDUSDT 1D Analysis SAND ~ 1D Analysis
#SAND Buy gradually from here if you still have confidence in this coin with a short term target of at least 15%+ from here.

SANDUSDT BUY/LONGBy utilizing Fibonacci retracement levels, historical patterns, , we can formulate a hypothesis that the market might follow a similar trajectory if bullish sentiment prevails.
