SAND/USDT Bullish Momentum ??? Break the resistance or Reject?💎 SAND has undoubtedly captured our attention, achieving a breakout from the Symmetrical Triangle pattern with a notable ascent. Currently, SAND is at a pivotal juncture, facing a resistance zone that needs to be overcome to maintain its upward trajectory. However, SAND has not yet initiated a downward movement for a retesting phase.
💎 For optimal entry points, we can await confirmation by observing either a breakout from the resistance zone or a pullback to the demand area. If SAND manages to breach the resistance promptly, it's likely to proceed smoothly towards its next targets, the supply zone, and the bearish OB region.
💎 Should SAND face another rejection at the resistance, it might enter a retesting phase at the demand zone. In such a case, SAND would require a definitive bounce to continue its attempts to shatter the resistance barrier.
💎 Failure to do so could result in SAND relinquishing its hold on the demand zone, indicating a potential false breakout and initiating a downward momentum. Consequently, SAND might seek support, potentially testing the resilience of a significant support area below.
SANDUSDT trade ideas

SAND/USDT Ready for an Epic Bullish Journey | SAND Analysis💎Paradisers, focus your attention on SANDUSDT as it presents an intriguing trajectory. Positioned within a demand zone, it has seemingly established buying liquidity and is primed for a potential bullish surge.
💎SAND has been navigating a descending channel formation for an extended period. Recently touching the channel's support, it's now reigniting its upward momentum, fueling confidence in its ability to move towards our projected resistance level.
💎Nonetheless, it's imperative to stay watchful. If the price breaches the demand zone, there's a strong possibility it will revert back to the support level for a retest.
💎Refine your mastery of entry and exit points for Sandbox with ParadiseFamilyVIP. Delve into expert insights on SAND and other promising coins, enhancing your trading strategy.

Sandbox 102323Breaking out and bottoming. Looking for a retest of previous R. Short the rejection or long the bounce with stop at support

SAND - very desirable!Dear my friends,
I continued to observe SAND for several days.
Today, the price broke out of the falling channel.
RSI observation has shown divergence in the final stages.
It's time to retest the resistance zones.
For me, this is the appropriate price range to start entering the first order.
Let's watch and wait patiently!
Best Regards,

Sandbox Trend Whale Address (Starting with 0x73b4) Deposits 28.46 Million SAND Worth $8.57 Million to Binance and OKX, Marking First Large Deposit Since August and Coinciding with a 30% SAND Price Decline Since Then.
Moreover, we miraculously saw a 3% gain today despite the whalers action
SANDBOX ROADMAP ! (WAVES)Sandbox analysis from Badharek
Check my bio first.
In large time intervals, in large degrees of waves, we have one wave that has become diametric and another wave that seems to have a double structure.
In my opinion, this major correction will end when we reach the green area.
Comment if you have any questions
Thank You

#SANDUSDT #LQR #TOBTC #LaqiraProtocolThe price is in a trading range at the highest Level of the seller and at the lowest point of Buyer . Daily limits are specified on the chart. After confirmation and matching with bitcoin levels, you can open a trade this analysis is not an offer to buy or sell.


🌋Bullish Setup SAND like many other tokens has a bullish structure, the price will grow up to the red zone in upcoming weeks.
🚀🚀🚀

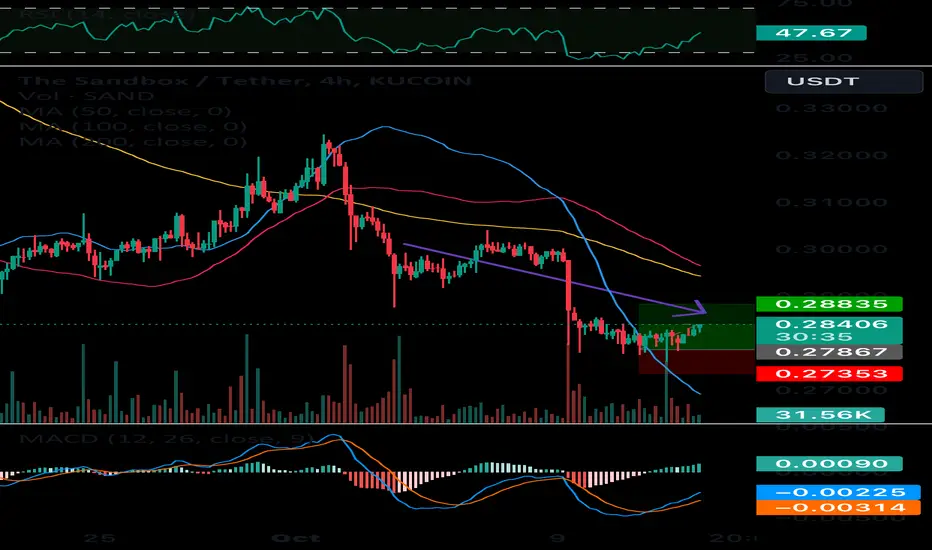
SANDUSDT Bullish ideaThe token found a support at 0.2950 and could go back up to test the last high. We are seeing momentum is being built up and we could see higher market structure.

SANDUSD ❕ correctionTD Sequential formed a reversal signal down (4H TF)
Price and RSI are forming a divergence.
I believe that the asset will correct from the current level.

💡Trade Idea #SAND/USDT:GM ☕️ If everything’s pumping right now let’s architect some long/buy positions then. #SAND looks nice and formed a rounding bottom/scallop, money flow is curving.

Sand-UsdtExpected movement For Sand Usdt - the Price has crossed the Daily Down Trend + made a Reflexive pattern + Good stabilization and retest to the support + Volume has major increase from 2 Months ago till this moment + the accumulation its almost done.
For me, it is a nice opportunity to have a little of Sand for the up coming period Price will increase

#Educational #tutorialtutorial:
as you can see, we have the desired path for a long position (raising from an order block and coming back to it), but the price has gone under the order block. it indicates that it is not a good entrance even though we have the divergence of chart candles with the RSI.
!!! for now, you can monitor SAND/USDT !!!
#sand #binance #educational #tutorial

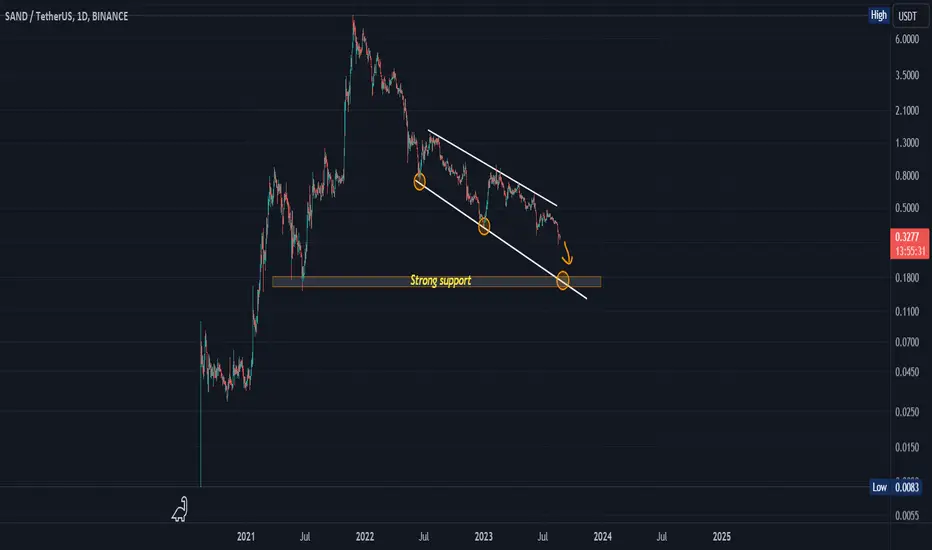
Sand usdt new low Sandbox looks like is going to new lows for the year. The next support from here is 0.1700. The last time this support was tested was in June 2021. Same the bitcoin dominance continues a lot of alt coins will make new yearly lows.

New low near?From the general view of the chart, we find a price channel that contains the currency, and the price is expected to fall to touch the bottom of the channel, and in the same area it is considered a strong support that will hold the currency for a while before making its next move
Please clarify that I am helping you with my point of view, which may be right or wrong, and see my previous analyzes of many currencies and forex in order to judge the owner of this analysis with a more accurate look
Good luck
SANDUSDT is testing the breakout?Should the price of SANDUSDT proceed to break out from this falling wedge, it could present an opportunity for new long positions in line with Plancton's trading rules.
To execute a trade according to Plancton's rules, traders should consider the following steps:
Confirmation: Wait for a confirmed breakout from the upper resistance trendline of the falling wedge. Confirmation is essential to ensure that the price movement is sustained and backed by supporting factors such as increasing volume.
Technical Indicators: Employ relevant technical indicators, such as oscillators, moving averages, and trend confirmation tools, to gauge the strength of the potential breakout and assess the overall market sentiment.
Risk Management: Implement effective risk management strategies, including setting stop-loss levels and determining appropriate position sizes. This is crucial to manage potential losses in case the market movement doesn't align with expectations.
Market Context: Consider the broader market context, news developments, and any relevant factors that could influence the price of SANDUSDT.
Patience: Exercise patience and restraint, waiting for a clear and confirmed breakout before initiating a long trade. False breakouts can lead to losses, so cautious execution is vital.
–––––
Follow the Shrimp 🦐
Keep in mind.
🟣 Purple structure -> Monthly structure.
🔴 Red structure -> Weekly structure.
🔵 Blue structure -> Daily structure.
🟡 Yellow structure -> 4h structure.
⚫️ Black structure -> <= 1h structure.
Follow the Shrimp 🦐

$SANDNYSE:SAND
The price action of NYSE:SAND on macro timeframe level formed out Head and Shoulders pattern level where the price action broke down the Support Trendline level
Marked out the Sell Side Liquidity level after an successfull retest level above we can see further downwards movements as higher timeframe is bearish

sand short A return to the strong trend line in green
Price has risen well above this trend line that is still important
Trend Line extends all the way back to beginning.

Falling Wedge will be done?Weekly Chart
Sandbox BINANCE:SANDUSDT is creating Falling Wedge
Both trend lines acts support and resistance
Daily Chart
Sandbox is below the resistance line and moving to apex zone between support and resistance. Just a breakout will create a massive move and chance to Long/Short depends on market that time.
If price goes up, it can break falling wedge and open a new bull run and otherwise, price goes down lower
Wait and see what happen

sandIn my opinion, the correction will continue until the green box. I will check inside the green box to buy. At that time, the movement momentum and the market situation will be considered.

🚨 Trade Update: SAND/USDT (5-10x)🚨 Trade Update: SAND/USDT (5-10x)
📈 Long Entry: 0.340 - 0.366
OTE (Optimal Trade Entry): 0.353
SL: 0.329
B/E Move: When it moves close to TP2
TPs:
Short Term: 0.370 - 0.375 - 0.380 - 0.387 - 0.395
Mid Term: 0.420 - 0.450 - 0.490 - 0.550 - 0.610 - 0.660
**Disclaimer: Past profits do not guarantee future results.
Is there a risk? Of course. The whole financial market is subject to risk; any fundamental reason or sudden change in the market sentiment can reverse the current market dynamic and cause a loss. Do not take excessive risks which you cannot afford to lose. There is no obligation to take this trade; please avoid the trade if you disagree with the trade analysis.
EDK FORUM TRADING®

SAND BULLISH TRIANGLE 1HWill it pump? That's a question. Can we trade that with good risk management? Yes, that's for sure. All you need can be seen on the 1-hour chart. All we need are good market volumes from buyers. We need to update local highs and set stops lower - you can see the main resistance levels on the chart. Anyway, volatility is low, and this can be a perfect moment to enter. This is not a recommendation; this is a subjective overview, and a bullish pattern can also fail. Keep this in mind. If this fits your strategy, you can enter. Good luck.
How to trade that pattern?
(a) Well, you can wait for confirmations, such as new local highs with volumes.
(b) Wait for the last low (if it happens), and if you see that the price is not going lower, you can enter there (that's risky).
(c) You can enter with split orders: at the last low and the next confirmation with new highs.
Keep in mind that BTC is currently in a flat phase, and it's not very clear what will happen next. Globally, I see limits from buyers to hold the BTC price and some markets that pumping. HOWEVER, the sellers are active 29,500 and currently, I can't see strong bullish candles on the 1-hour BTC chart; instead, I observe sellers' pressure. Be prepared for a potential breakdown, below 29,300.
