SCRTUSD BullflagA bullflag is forming outside the 2.618 fibonacci circle level of the strongest downtrend.
This is within an up channel
Coincides with a touch upon the 50MA
Potential
SCRTUSD trade ideas

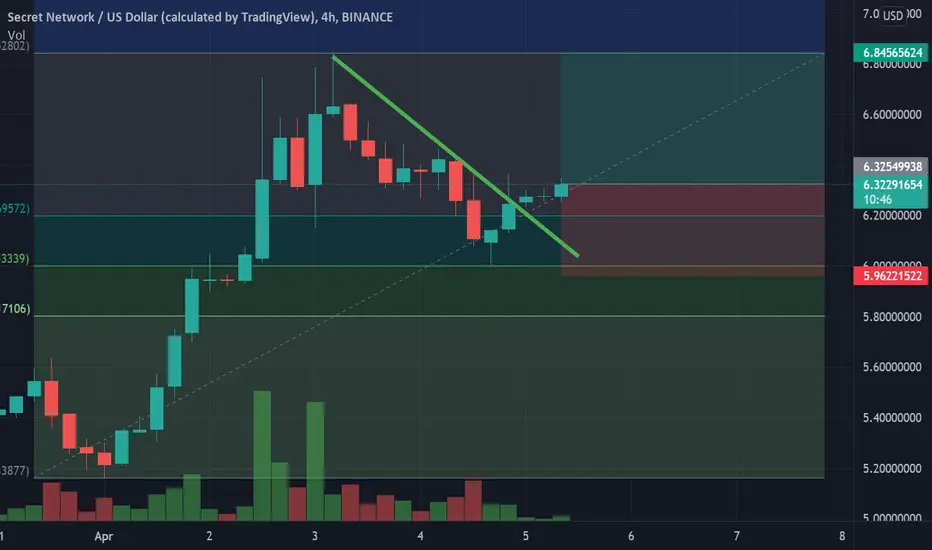
long SCRT $SCRT broke through the descending resistance line after the bounce off the Fibonacci 0.5 retracement level. Bullish trend is expected to continue and reach the Fibonacci 1 level.
SECRET NETWORK LOOKING GOODSecret Network is the first blockchain with data privacy by default, allowing you to build and use applications that are both permissionless and privacy-preserving.
Happy new month!!!!

SCRT, the rise begins.The following content is machine translation:
Bottom support near 4.2.
It stopped falling near 4.2.
To the 5 range sideways shocks.
Today, it broke through and stood firm 5 and rose.
Near the upper resistance level of 7.
Aim to look around 7.

SCRT This is the nest scenario for SCRT. in next 2 weeks I think its going to hit $5.9 before hitting $3.6 to get a completed B wave. Also we have a trend breakout so you should wait for the retest for the best time entry
peace :)

Bullish Gartley patternBullish Gartley Pattern:
It starts with a bullish XA move. AB is then bearish. BC is bullish, and CD is bearish again.
XA: This can be any price activity on the chart. There is no specific price movement in Gartley chart formation.
AB: The AB move should be approximately 61.8 % Fibonacci of XA and should not cross the starting point X. If it crosses X then the pattern becomes invalid.
BC: The BC move should finish between 38.2% and 88.6% Fibonacci of XA and should no cross point A. If it crosses point A then the pattern becomes invalid.
CD: The CD move will be the final and important part of the pattern and to place a long trade when CD is 78.6% of XA. Ideally point D should represent 127% to 161.8% Fibonacci of BC. Look for entry at point D once you see the trend reversal. Note point D cannot be cross the starting point X. If it crosses then the pattern becomes invalid.
Profit Targets:
The full target price of the pattern is the 161.8% Fibonacci extension of the AD. However, there can be 3 intermediate targets before the final target
which are:
Target 1: point B swing
Target 2: Point C swing
Target 3: Point A swing
Target 4: Point E 161.8% Fibonacci of AD
Note that you can only draw (AD) Fibonacci retracement once the pattern has completed at point D and the price has reversed.
Stop Loss : should be just below X with a support channel.
If you like my TA & ideas!! Want to keep yourself updated with current market action, then please follow my profile for more analysis.

Privacy coins will be a demand in the next yearsSo... privacy coins will surely be a demand in the next years due to the regulations and people looking for privacy with their money.
Better if the privacy is with smart contracts+defi, we have Secret Network as the next big thing (IMO)
i'll keep accumulating and looking for the next levels on the next bull run.
(*this is not a financial advice.)

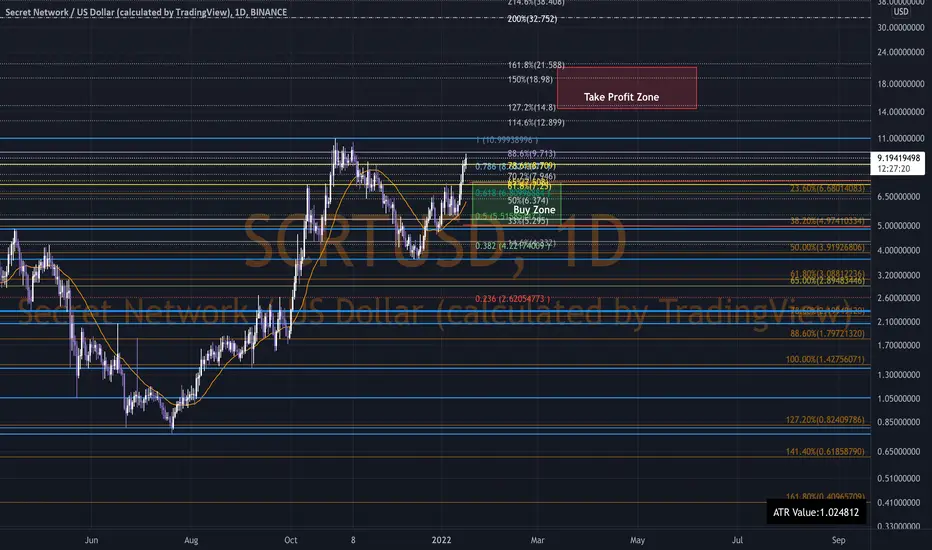
SCRTUSD H16: 1500% gains THE BEST LEVEL TO BUY/HOLD(EXCLUSIVE)Why get subbed to me on Tradingview?
-TOP author on TradingView
-15+ years experience in markets
-Professional chart break downs
-Supply/Demand Zones
-TD9 counts / combo review
-Key S/R levels
-No junk on my charts
-No MACD / RSI /MA/FIBONACCI
-Frequent updates
-Covering FX/crypto/US stocks
-24/7 uptime so constant updates
-no moonboy/crazy targets
-TA that makes sense and
-setups that payout
SCRTUSD H16: 1500% gains THE BEST LEVEL TO BUY/HOLD(EXCLUSIVE)
IMPORTANT NOTE: speculative setup. do your own
due dill. use STOP LOSS. don't overleverage.
🔸 Summary and potential trade setup
::: SCRTUSD 16hour/candle chart review
::: accumulation in progress now
::: updated/revised outlook
::: setup still valid as of today
::: bullish 5 waves sequence
::: chart is LOG SCALE
::: get ready to BUY LOW later
::: BUY LOW near 16c
::: entry - March 2022
::: CORRECTION MODE NOW
::: once wave4 is complete
::: will last 4-6 weeks
::: up to 1500% gains possible later
::: short-term pullback/correction
::: wave4 correction/pullback
::: correction/pullback is 55%
::: however chart looks strong
::: SPECULATIVE SETUP
::: do your own due dill
::: and use proper risk management
::: TP bulls is +1500% gains
::: details: see chart
::: recommended strategy: BUY/HOLD after pullback
::: TP BULLS +1500% gains
::: SWING TRADE: BUY/HOLD IT
::: bull run not over yet
::: good luck traders!
::: BUY/HOLD and get paid. period.
🔸 Supply/Demand Zones
::: N/A
::: N/A
🔸 Other noteworthy technicals/fundies
::: TD9 /Combo update: N/A
::: Sentiment mid-term: BULLS
::: Sentiment short-term: PULLBACK/WAVE4
RISK DISCLAIMER:
Trading Crypto, Futures , Forex, CFDs and Stocks involves a risk of loss.
Please consider carefully if such trading is appropriate for you.
Past performance is not indicative of future results.
Always limit your leverage and use tight stop loss.

Monero is my Fav but... $SCRT will be shakin! $SCRT has a very interesting probalistic moves ahead, something between around $11/$13 (+notes on the chart.)
Times of regulation and speculation of anything that goes around with the squizophrenic mainstream media ideology, privacy coins are the choices. (demand)

SCRTUSD H16: 1500% gains THE BEST LEVEL TO BUY/HOLD(EXCLUSIVE)Why get subbed to me on Tradingview?
-TOP author on TradingView
-15+ years experience in markets
-Professional chart break downs
-Supply/Demand Zones
-TD9 counts / combo review
-Key S/R levels
-No junk on my charts
-No MACD / RSI /MA/FIBONACCI
-Frequent updates
-Covering FX/crypto/US stocks
-24/7 uptime so constant updates
-no moonboy/crazy targets
-TA that makes sense and
-setups that payout
SCRTUSD H16: 1500% gains THE BEST LEVEL TO BUY/HOLD(EXCLUSIVE)
IMPORTANT NOTE: speculative setup. do your own
due dill. use STOP LOSS. don't overleverage.
🔸 Summary and potential trade setup
::: SCRTUSD 16hour/candle chart review
::: accumulation in progress now
::: updated/revised outlook
::: setup still valid as of today
::: bullish 5 waves sequence
::: chart is LOG SCALE
::: get ready to BUY LOW later
::: BUY LOW near 16c
::: entry - March 2022
::: CORRECTION MODE NOW
::: once wave4 is complete
::: will last 4-6 weeks
::: up to 1500% gains possible later
::: short-term pullback/correction
::: wave4 correction/pullback
::: correction/pullback is 55%
::: however chart looks strong
::: SPECULATIVE SETUP
::: do your own due dill
::: and use proper risk management
::: TP bulls is +1500% gains
::: details: see chart
::: recommended strategy: BUY/HOLD after pullback
::: TP BULLS +1500% gains
::: SWING TRADE: BUY/HOLD IT
::: bull run not over yet
::: good luck traders!
::: BUY/HOLD and get paid. period.
🔸 Supply/Demand Zones
::: N/A
::: N/A
🔸 Other noteworthy technicals/fundies
::: TD9 /Combo update: N/A
::: Sentiment mid-term: BULLS
::: Sentiment short-term: PULLBACK/WAVE4
RISK DISCLAIMER:
Trading Crypto, Futures , Forex, CFDs and Stocks involves a risk of loss.
Please consider carefully if such trading is appropriate for you.
Past performance is not indicative of future results.
Always limit your leverage and use tight stop loss.

long on SCRTRetest of the broken descending trendline on $SCRT confirmed the breakout by bouncing off with the huge volume spike. Bullish movement is expected to continue and reach the resistance at 5,7$

SCRT HTF Key areas of support and resistance.Currently in a bullish upwards channel.
If we break below the channel then there is an area where there's stacked levels of support: volume, multiple fib levels and a daily which should all act as strong support, if that breaks then there is the overall trendline.
If all of those support levels are broken I would still look for a swing failure pattern at the bottom of the range and would accumulate heavily.
Above there is some intraday resistance that is areas of previous high volume and different VWAPS stacked in the same area.
Above that is the daily and top of local range. If the top of this range is broken then there isn't much resistance until the daily by the ATH
In the coming days I will look for signs of strength to confirm the idea that the range will be broken to the upside, such as the key area of support holding.
As we are at the bottom of the upwards channel and close to stacked levels of support, I would look to accumulate at these levels for a likely x2 move in the coming weeks.

Privacy Platform For Web 3 (SCRT/USDT Analysis) 📈📉❇️Hello Crypto community Welcome to this introduction for another high potential crypto project.🚀💰
🔰What Is SCRT ?
Secret is the native coin of Secret Network, a blockchain with data privacy for smart contracts by default, allowing you to build and use applications that are both permissionless and privacy-preserving. This functionality protects users, secures applications, and unlocks hundreds of never-before-possible use cases for Web3.
With blockchain technology, we have the potential to create a more empowering and inclusive internet - what is often referred to as Web3.
🔹Rank #82 ,/ kind : COIN / Market Cap:$973,270,837===> GOOD✅👍
Total Supply: 1190,165,060/// Circulating Supply: 163,295,557.00 SCRT ====> GOOD✅👍
------------------------------------------------------------------------
📈📉 TECHNICAL
As you can see on the WEEKLY timeframe for SCRT/USDT , It is trading about $5.93 right now.
It has formed cup and handle pattern and also it has been rising in a upward channel ,
also its trading near first support zone and can start rising vas soon as the crypto market turn green ,because it hasn't any specific resistance right now to stop the price so it can reach the tps respectively .
anyway if not be able to rise and by losing current support it can drop to next lower support areas , but if break out the uptrend channel the trend turn completely bearish in this case.
🛑resistance level: $ descending trendline
❇️support levels: $4.88-$5.30 / 2.88$- $ 3.4 / $1.234-1.6
--------------------------------------------------------------------------------------------------------------------
👉This analysis is my personal opinion ,not a financial advice ,so do your own research.
💜 if you're a fan of my analyses PLZ follow me ,give a big thumbs 👍 and drop comment 🗯💭

$SCRT SCRT 5 waves completed ABC in progress potential targets5 wave completed
ABC in progress
Can expect buyers to show up at blue box areas, calculation in equal legs.
While BTC is preparing to make its big move lower, we can anticipate alts will get destroyed.
Cycle I has ended in November peak, double correction across the board for most major cryptos to end cycle II before starting cycle III up.
Target does seem low, but if BTC is gunna makes its move down towards the mid 20s than these low (calculated) targets should hit.
Could be great to short em and then bag em downtown.
NFA . DYOR.
Just sharing ideas. Feel free to leave comments, hit like to show support and if you manage to hit targets from these ideas, please let us know.
Tips are always welcomed :)
Thank you for viewing, sharing and safe trading to you all!

SSSHHH!!! Keep it SECRET!!!A mega symmetrical triangle in formation?!
A very good base for entry for good potential reward!
Long in it!

SCRT - Long -Almost ready for a Bull Run Bullish and heading for TP1
30 days forecast = TP1
Like this idea ? ....Please do a thumbs up.
Thank you for watching.

Secret network is bullish $SCRT is giving us a perfect buying opportunity. Price is bouncing off the long-term bullish trendline and the major support level. In case of bounce off the trendline, bullish movement to resistance level at 9,6$ is expected to happen.

the last leg of corrective 2nd wave to prepare for the 3rd wavecrab harmonic pattern:
AB=0.61 XA
BC=0.38 AB
0.78 BC=$0.66
0.88 BC=$0.75
1.41 BC=$1.45
1.6 BC=$1.88
2 BC=0.78 XA=$2
2.24 BC=$4
0.88 XA=$5
2.6 BC=$6.52
1.13XA=$16.58
3.6 BC=$22.65
1.27 XA=$33.29
4.23 BC=$48.88
1.41 XA=$65.52
1.6 XA=$181

Build a fixed orders bot to acumulate SCRTThis pair is in equilibrium pattern. I am going to create a Flash Crash Bot to acumulate SCRT. That is a bot with fixed orders.

Secret network is bullish $SCRT reached the buying zone. It is bouncing off the support arean and the bullish trendline. Bounce off the level and bullish movement to resistance level at 9,57 is expected to happen.

SCRT LongFinished the cup with handle and breakout. You might wait for another retest to buy or with small position at current level. Cosmo ecosystem remain strong recently $ATOM $ROSE $LUNA are continue to outperform the market. IBC as a cross-chain ecosystem is bullish. Target, stop loss and add/sell point are shown on the chart. #DYOR and manage your risk.

SCRT USD Possible 5th WaveSecret appears to be in a correction wave and due for a 5th wave with the target of the 1.272 or 1.618. Would be a a 2:1 minimum. SCRT has a 33% APY and specializes in private smart contracts and is in the ATOM Ecosystem an ecosystem I think will make a big move in 2022.
SCRT/USDT Breakout So Ready to 50% upward move ?$SCRT/USD Breakout Chart :-
#SCRT broke out Resistance with good volume.
I am expecting Best entry around Retest zoneZ
Entry:- $6.89-$6
Targets:- $8.60/$10.30
As per chart I am expecting 50% Move from breakout.
