SEI 8H – Same Fib Zone, Same Bounce… Same Outcome?SEI just tapped the exact same golden pocket zone that launched its last major breakout — and it’s already showing signs of a repeat performance. The 8H chart displays a nearly perfect mirror setup, with price double-tapping the 0.5–0.618 retracement zone and bouncing with momentum.
With Stoch RSI
Trading activity
Transactions 530
BuysSells
305225
Volume 4.08 MUSD
Buys volumeSells volume
2.22 M1.86 M
Traders 150
BuyersSellers
8664
About SEIUSDC_F8E349.USD
Related DEX pairs

SEI - MACD Liquidity Tracker Nailed the Long, Now Flipping ShortThe MACD Liquidity Tracker Strategy just clocked a +103% long trade on SEI before momentum flipped and a short signal fired on this 8H chart.
The previous long captured a textbook impulse — clean MACD crossover, EMA alignment, and breakout confirmation. Now price is back under the 50/100 EMA, and M

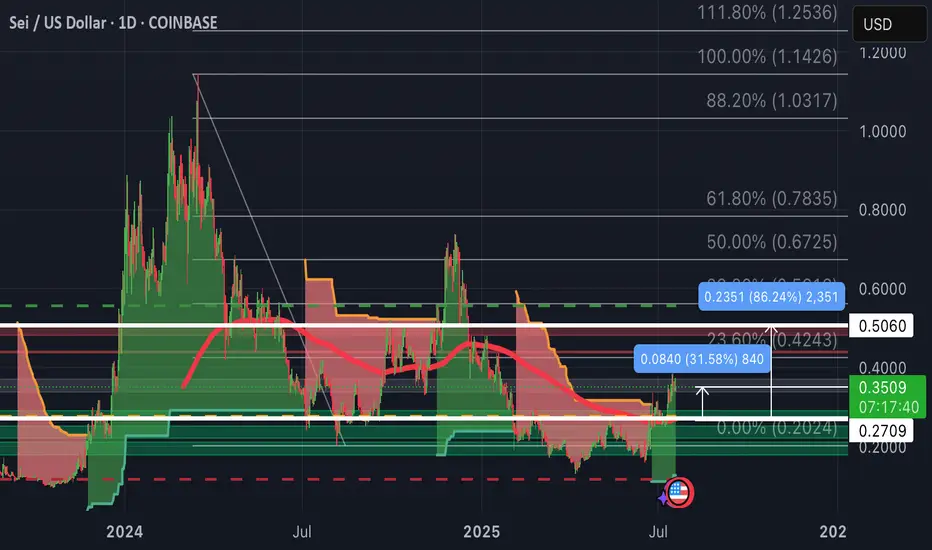
SEI-Update:Up 31% so far as we wait for the big retest back @ $1Entry was at $0.27, made a dip below this support line then recovered.
Macro retest would be 100% Fibonacci Correction back to $1.00.
First we shall break thru the $0.50 Resistance (will be a 86% gain).
Then push up past 50% Fibonacci at $0.6725, then $0.7835.
$SEIUSD - looks great for a longCOINBASE:SEIUSD
Looks great long term and targets provided should be hit by EOY.
Open active trade = $0.2930
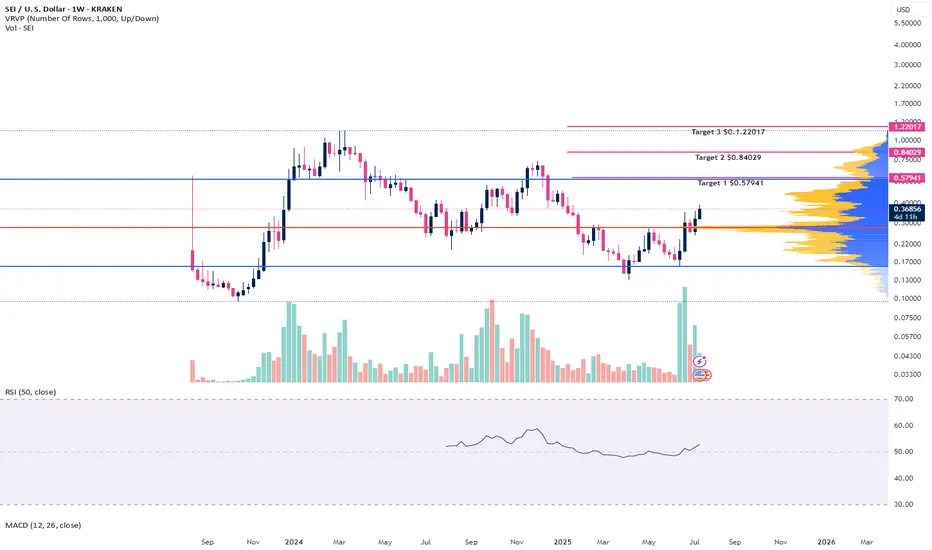
SEI - I love the look of the chart. NYSE:SEI is a new crypto I have come across. Fundamentals look great and the chart looks even better.
I have just opened my first trade on it.
It should target $0.58 to $1.23 this cycle with a few stops along the way highlight in green.
Let's see how it plays out.
Good luck to everyone invo

SEI up to 221% ROIFrom a total of 17 technical indicators, 12 calls to buy, and 3 to sell, the prediction sentiment short-term is bullish based on technical price analysis. The first major uptrend resistance for SEI is at the $0.3001 level, it needs to close above that level to continue to move higher, and bottom sup

SEI Turns Bullish After A Zig-Zag CorrectionSEI Turns Bullish After A Zig-Zag Correction, as we see it sharply bouncing from projected support that can send the price higher by Elliott wave theory.
SEI with ticker SEIUSD is waking up exactly from the channel support line and equality measurement of waves A=C, which is perfect textbook suppo

SEI breaks the downtrend targets 30cThe SEI network is currently displaying positive price movement after recently breaking out of a downward trend channel that had been in place since the peak on December 5th. On the daily chart, it has been trading sideways within the upper channel, indicating a potential retest of that breakout. Ho

Definitely like SEIUSDT Bounce off the $0.1473 Level Looking at SEIUSDT - for a bullish candle move off the support zone.
Would like to see a move into the $0.30 - $0.50 cent range.
And why not scoop some up at these lower levels.

SEI will reach at 1.4$
Price Movement and Trend:
The chart shows a significant upward movement starting around mid-2024, peaking at a high (likely around $1.14-$1.20 based on the vertical scale), followed by a sharp decline.
After the peak, the price enters a consolidation phase with lower volatility, fluctuating around

See all ideas
Summarizing what the indicators are suggesting.
Oscillators
Neutral
SellBuy
Strong sellStrong buy
Strong sellSellNeutralBuyStrong buy
Oscillators
Neutral
SellBuy
Strong sellStrong buy
Strong sellSellNeutralBuyStrong buy
Summary
Neutral
SellBuy
Strong sellStrong buy
Strong sellSellNeutralBuyStrong buy
Summary
Neutral
SellBuy
Strong sellStrong buy
Strong sellSellNeutralBuyStrong buy
Summary
Neutral
SellBuy
Strong sellStrong buy
Strong sellSellNeutralBuyStrong buy
Moving Averages
Neutral
SellBuy
Strong sellStrong buy
Strong sellSellNeutralBuyStrong buy
Moving Averages
Neutral
SellBuy
Strong sellStrong buy
Strong sellSellNeutralBuyStrong buy