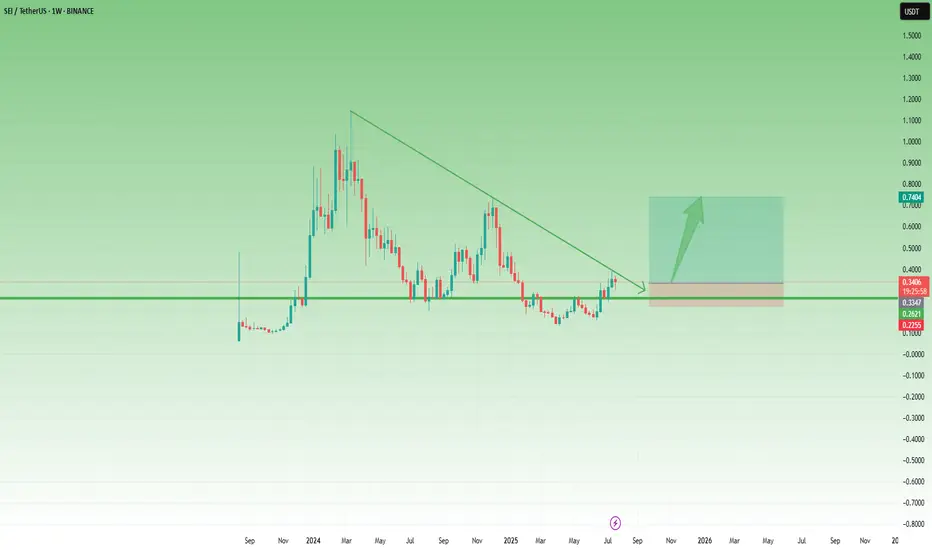
SEI Breakout Setup: Buy the Dip Before the Next Leg UpAfter the low around 0.13 in April, SEI started to recover, and although the first attempt to reclaim the 0.25–0.26 zone failed in mid-May, that key area—a former support from last year—was finally broken at the end of June.
Now, this previous resistance has turned into support, and even though gai
Sei long to $0.3556just now opened up a long position on sei. Aiming for 0.3556
Tp1: $0.35
Tp2: $0.3556
Sl: $0.3374

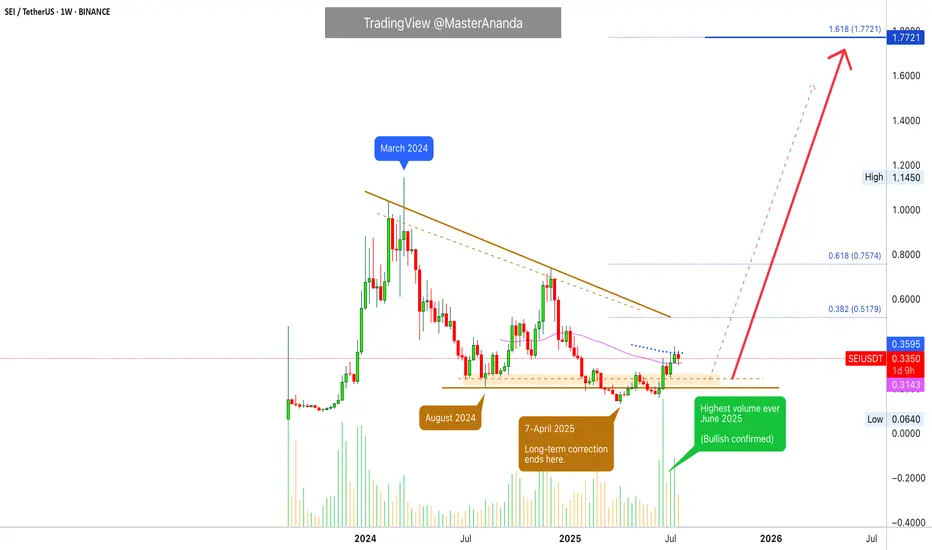
SEI | Full AnalysisHere is the top-down analysis for Sei as requested 🫡
Weekly Timeframe:
We have a potential large structure forming on the weekly chart that will be activated once we break the ATH. Its target zone lies between $1.8 and $2.2.
My sell targets for SEI this cycle are:
TP1: $0.73
TP2: $1.14
TP3: $

SEI/USDT at a Critical Level Golden Pocket Reaction Will Define?🔍 Technical Analysis:
1. Market Structure:
SEI/USDT is in a recovery phase after a significant downtrend.
Price is currently testing a crucial area between the Fibonacci retracement levels of 0.5 (0.2778) and 0.618 (0.2515) — known as the Golden Pocket Zone.
2. Key Support & Resistance Levels:

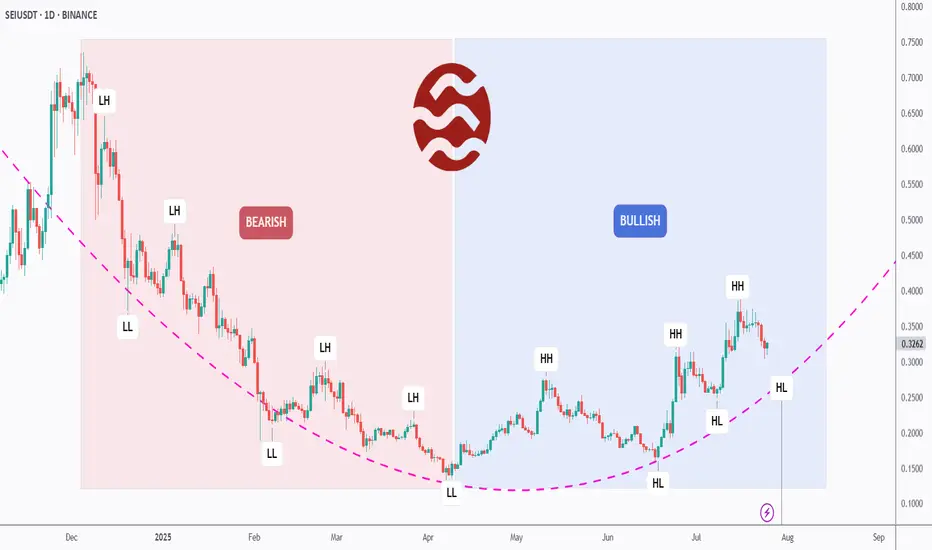
[Deep Dive] SEI – Edition 2: From Pain to Power: A Bull Cycle?SEIUSDT may have just flipped the script.
After months of consistent lower highs and lower lows, SEI has officially broken its bearish structure and is now printing clear higher highs (HH) and higher lows (HL) — a textbook sign of a trend reversal.
📉 Left Side: Bearish Breakdown
From late 2023
SEI : The best future belongs to this coin.Hello friends🙌
Given the rapid growth that this coin has had and I think it will continue, now that the price is correcting, there is a good opportunity to buy in stages with risk and capital management and move with it to the specified goals.
🔥Follow us for more signals🔥
*Trade safely with us*

Sei · Technical Analysis · Beyond Trading —The Soul in the ChartThis is a nice chart. It is well structured. It is also basic and standard. You can know where a project is at based on the drawings (patterns) on the chart. When you look at hundreds of charts, for years, you can see the signature of the trading bots on each chart. Each exchange has a different set
SEI $0.33 back to ath?SEI since December bearish momentum to June.
Around June the bullish momentum started.
We´re looking for NYSE:SEI to continue and break through support at $0.34.
Macd = Avg Bullish
Rsi = Avg Bullish
Stoch Rsi = Bullish
If this zone holds, the risk/reward setup favors bulls with clear upside tar

Sei short to $0.2556 todayOpened a short position on sei just now. Aiming for $0.2556
market likely to push for another low again.
Sl: $0.2808
Tp: 0.2556
Market might push up a bit more. I didn't wait for ideal confirmation but invalidation is valid.

SEI — Breakout & D1 OB Target1. Support 0.33–0.36 holding
2. Entry after SR breakout
3. Target: D1 OB 0.47–0.54
4. Stop below 0.33

See all ideas
Summarizing what the indicators are suggesting.
Oscillators
Neutral
SellBuy
Strong sellStrong buy
Strong sellSellNeutralBuyStrong buy
Oscillators
Neutral
SellBuy
Strong sellStrong buy
Strong sellSellNeutralBuyStrong buy
Summary
Neutral
SellBuy
Strong sellStrong buy
Strong sellSellNeutralBuyStrong buy
Summary
Neutral
SellBuy
Strong sellStrong buy
Strong sellSellNeutralBuyStrong buy
Summary
Neutral
SellBuy
Strong sellStrong buy
Strong sellSellNeutralBuyStrong buy
Moving Averages
Neutral
SellBuy
Strong sellStrong buy
Strong sellSellNeutralBuyStrong buy
Moving Averages
Neutral
SellBuy
Strong sellStrong buy
Strong sellSellNeutralBuyStrong buy
Displays a symbol's price movements over previous years to identify recurring trends.