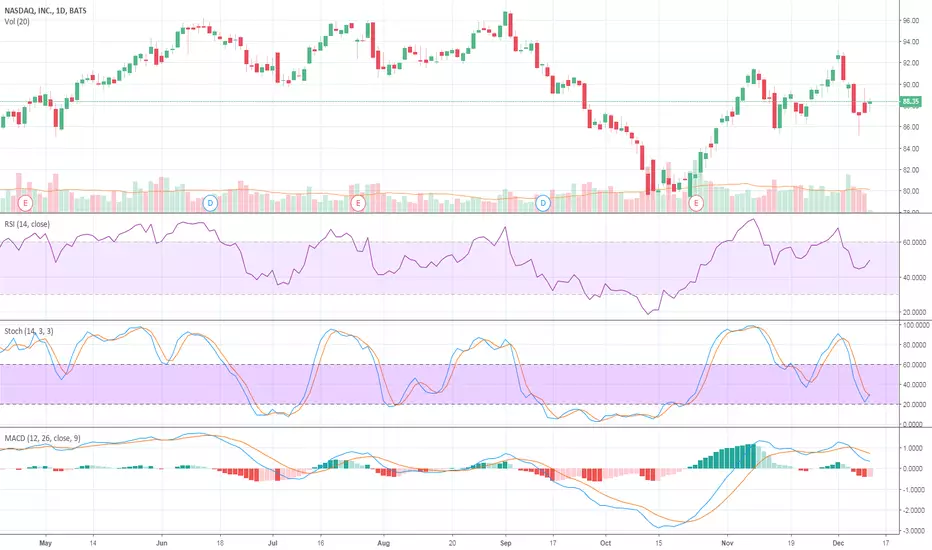
NASDAQ sitting on the 100 weekly MA. Bearish sentiment remains.The NASDAQ is currently sitting on the 100 weekly moving average and on a previous support zone, but I suspect it will be broken and we will come down to test the 200 weekly moving average. The overall market sentiment has turned very bearish. I do want to point out, we saw a triple top formation form (shown by the light-blue line on the price action) and we saw the RSI make a lower-high after each attempt to break that high. This is referred to as a Bearish Divergence, and we saw it play out because after the third touch that unsuccessfully broke that peak, price dropped sharply. We could be now entering into a pretty critical time for the stock market, because if we start to break some of these larger weekly moving averages, but could be setting up for downside as we enter into 2019.
Moving average guide (All in the weekly time-frame for this chart):
10 MA in Orange
20 MA in Pink
50 MA in Green
100 MA in Yellow
200 MA in Red
What to watch for:
-A break of the 100 weekly moving average, and a retest of the 200 weekly moving average.
NDAQ06 trade ideas

Dot com 2.0 is overNumerous tech startups with no real business model hemorrhaging money to obtain fleeting users who just get bored of that app and go to the next app 2 months later.
Tech stocks are all time highs with trillion dollar company valuations?
Yep it's another dot com bubble and it's popping right now.
Get out while you still can.


NDAQ - RED HANDED- red candels
- resistance not broken on weekly
- all the assumptions are still there for a bearish market
read the rest posts about VIX and DJI. We are still going down.

no higher lows - Nasdaq: my take on the matter- certain stocks may grow and i diversify myself in that direction
- some others will go bust
DIVERSIFY AND HAVE SMALL LOTS. DO NOT GO FULL RETARD ON A CERTAIN STOCK - WE ARE IN VERY MERKY WATERS HERE.
PLAN YOUR TRADES AND DIVERSIFY - ON LONG AND SHORT TOO !
Should I buy right now? Whats up guys, my name is David. After some time working for a hedgefund I recently left to start trading on my own. I currently trade futures, forex, and stocks. I have also began managing private portfolios, nothing major just some clients’ accounts that I am trying build up. You guys could follow me on twitter if you like, @CapitalMadison I just made the account so that is why there are no followers yet.
This is the first time the 50-day moving average has dipped below the 200-day moving average in almost two years. I would wait until the 50-day MA crosses above the 200-day MA to trade a long position. The market has shown that the 50-day MA does not stay below the 200-day MA for a long time. I do see the market recovering, but I would wait to put on any long trades until the 50-day MA crosses the 200-day MA..

Ready for a retrace back to 2015 levels?The fib retrace shows strong support at the 2015 levels.
Shits about to get real.


NASDAQ made it's Lower Low!Situation : LL Breakout
Now Waiting : Retracement on the boxes area (LH in small/bigger scope)
Bias : ShortTerm Bearish
Remember your risk management! Adios, HA.


NDAQ ShortOur Quant Algo has been flashing a short signal on NDAQ. This signal is the result of a quantitative analysis.
Expect the price to fall to atleast $80.00.


NASDAQ at the top of the 3-wave?It sure looks like it if you ask me!
1. Trend got stopped at the 1.618 extension fib
2. Made a head and shoulders trend reversal pattern on the top
3. Had a strong pullback after
4. And is now making an ABC correction to the upside now to get the sellers on board and to go down to the .618 fib retracement.
This is where I expect where the 5th wave will start.
We need some bad news and bearish sentiment to play out so I think we'll see that in the next few months. So fasten your seat belts and ride the waves!
This is my first published non-crypto analysis, so I would be glad to hear what you guys think!


Will NASDAQ drop next week? NDAQ is overbought on stochastics and RSI. RSI has dropped below 70. Showing the sign of a reversal after hitting the resistance.

BEAUTIFUL 2618 ON NASDAQ100. GO SHORT NOW! 2618/3618 trade. Triple top and a 618 reversal has just appeared!
Reasons to enter.
1. 2618
2. Reversal candle already shown
3. RSI overbought
Execution
1. Look to trade back to structure!
2. SL placed just above previous resistance high, for a 1:1 risk reward trade
Good luck, enter now!

Nasdaq, Bullish, DecemberThe price is crossing the bullish MM70 over another bullish MM210 on a weekly chart.
The most likely scenario is a price pullback until an inverted shoulder-head-shoulder is formed and a bullish break in December.
This is correlated with the signals published in the previous posts.
