USDSGD 04/04/2022Monthly:
-Monthly highs.
-Impulse and correction pattern. Expecting another impulse.
Weekly:
-H&S pattern.
-Weekly bearish candle.
Daily:
-Bearish W pattern.
-H&S pattern (IC).
4H:
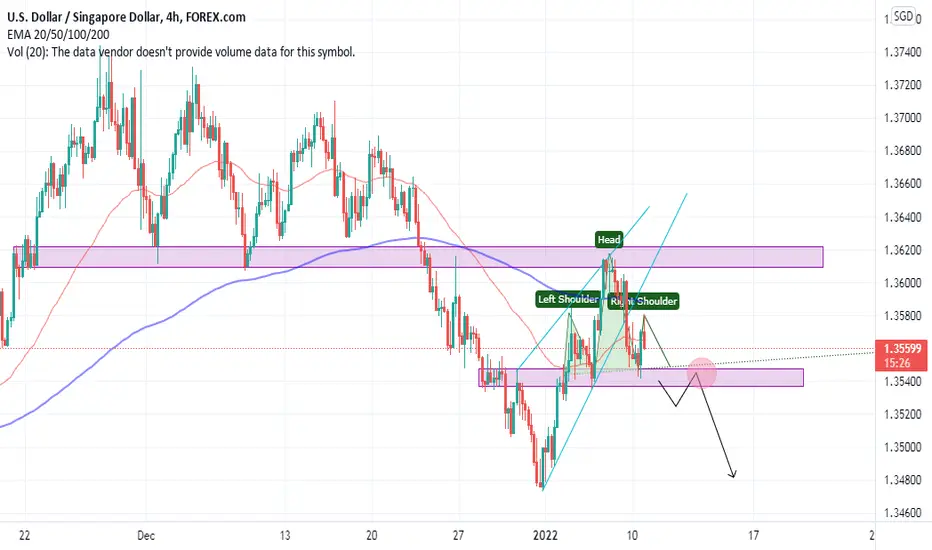
-H&S pattern.
SGDUSD trade ideas

USDSGD 04/04/2022Monthly:
- H&S
- S&D Zone
Weekly:
- H&S
- Bearish W
Daily:
- H&S
- Bearish W
- IC
4H:
- H&S


USDSDGHi traders:singapore dollar shaped short time sell and i set my entry after the correction compeleted,
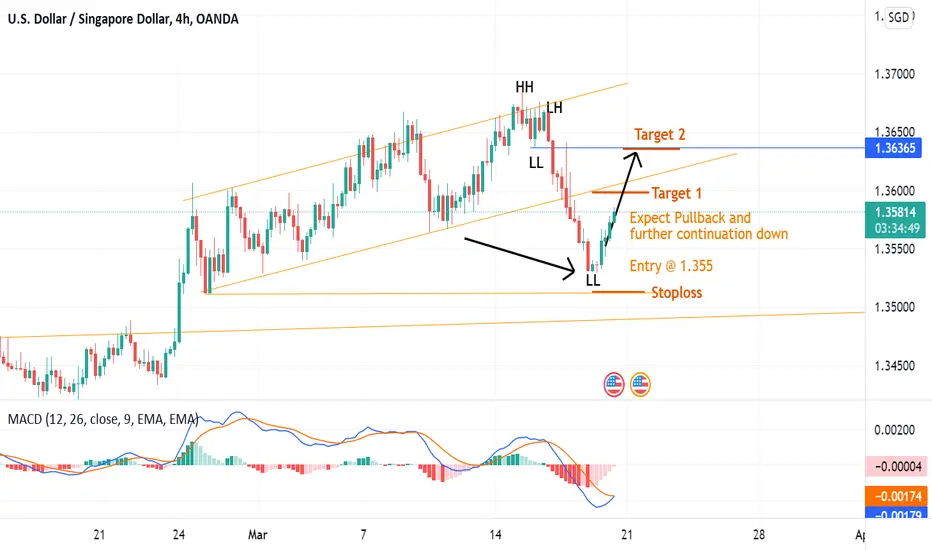
W7-11 _ Short Term Bearish Idea _ USDSGD H4The price action has created a new LL.
Therefore I expect a pullback, creating a new LH and further continuation down.

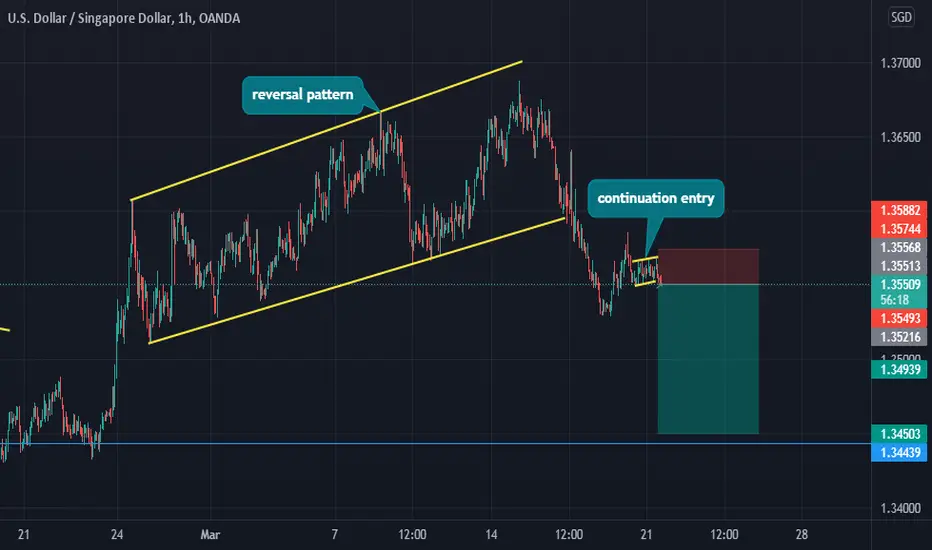
Take Profit: 1.36933 (USDSGD)Price closed above diagonal resistance. Diagonal resistance becomes support after price closed above level.
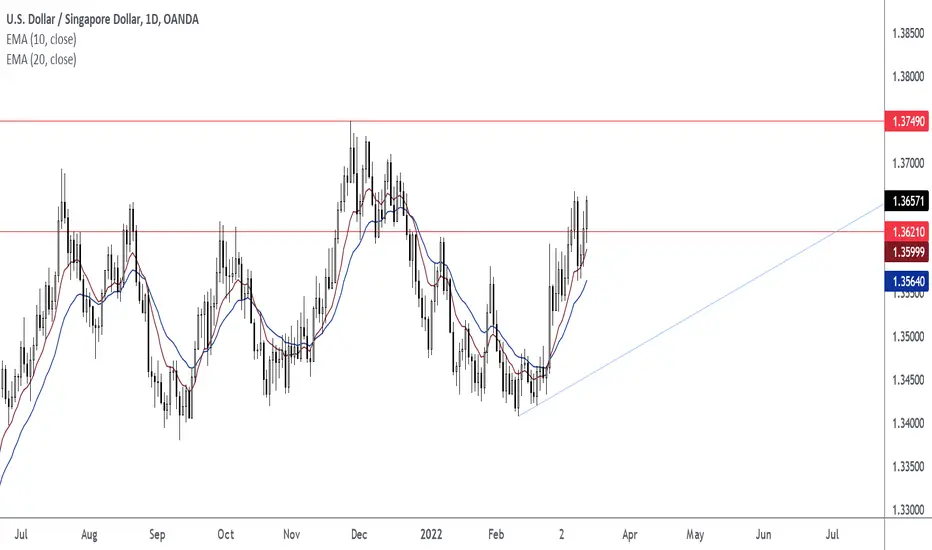
USDSGD on watchLook for break down or a bounce here. For break below, 1.351 should offer some support

USDSGD : Anticipation for next weekDaily did a liquidity sweep and created an OB+
We are now waiting on H1 for this bullish OB to be retested to give us an H1 bullish trade.
GLGT

USDSGD | Bounce from SupportUSDSGD has bounce from the support zone and bulls are all ready to peak the price again. One should adop buy on dip strategy as long as it is above the support zone. Break of which would result in bearish trend.
Trade your levels accordingly.
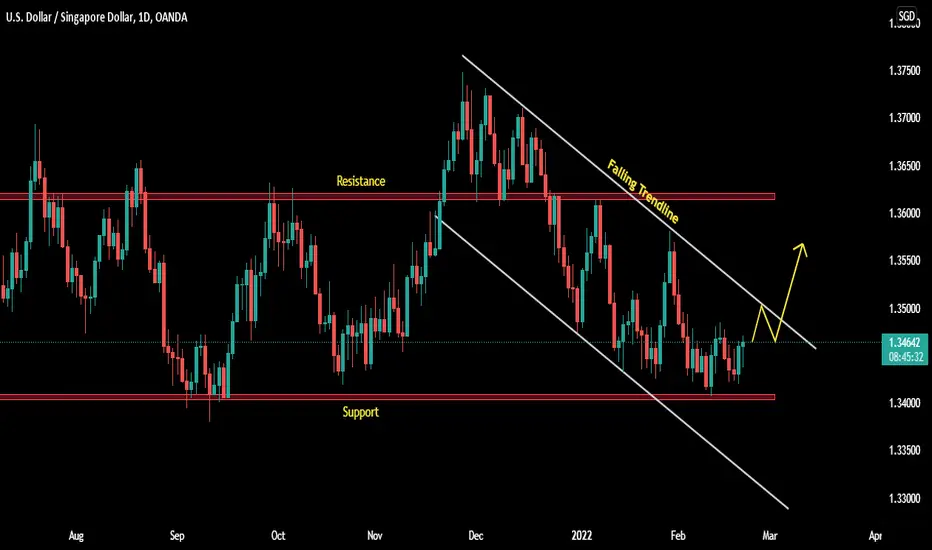
USDSGD Good Sell Setup (swing trade)USDSGD structure is bearish, with a potential H&S developing on the chart. price is converging in falling wedge pattern. i think this pair
will retrace back to resistance area marked on the chart, however, there's a huge possibility price can reject to a break candle I marked down. but overall, i am sell biased on the pair. Good luck!

USDSGD, macroviewNext 3 years would be bullish years for USDSGD. It seems another criminal inflation waits SGD. Good luck in trades, buddy.


USDSGDtha small trend line is broken and there is a double bottom pattern confluence with fibo 38 and 50 u can take buy at the neck line if u see candlestick pattern
Please follow and like the idea for Support and More ideas like this and share your ideas and charts in Comments Section..!!
Thanks for Your Love :)

USD/SGD Weekly Outside barWeekly Long trade on USD/SGD
Nice Outside Bar formed on the weekly looking to Long
Enter @ 1.35213(retracement to 61.8)
SL @ 1.34615
TP1 @ 1.36781
TP2 @ 1.37379

💡Don't miss the great buy opportunity in USDSGDTrading suggestion:
". There is a possibility of temporary retracement to the suggested support line (1.3463).
. if so, traders can set orders based on Price Action and expect to reach short-term targets."
Technical analysis:
. USDSGD is in a range bound, and the beginning of an uptrend is expected.
. The price is above the 21-Day WEMA, which acts as a dynamic support.
. The RSI is at 72.
Take Profits:
TP1= @ 1.3508
TP2= @ 1.3549
TP3= @ 1.3605
TP4= @ 1.3668
TP5= @ 1.3713
SL= Break below S2
❤️ If you find this helpful and want more FREE forecasts in TradingView
. . . . . Please show your support back,
. . . . . . . . Hit the 👍 LIKE button,
. . . . . . . . . . Drop some feedback below in the comment!
❤️ Your support is very much 🙏 appreciated!❤️
💎 Want us to help you become a better Forex / Crypto trader?
Now, It's your turn!
Be sure to leave a comment; let us know how you see this opportunity and forecast.
Trade well, ❤️
ForecastCity English Support Team ❤️

💡Don't miss the great buy opportunity in USDSGDTrading suggestion:
". There is a possibility of temporary retracement to the suggested support line (1.3463).
. if so, traders can set orders based on Price Action and expect to reach short-term targets."
Technical analysis:
. USDSGD is in a range bound, and the beginning of an uptrend is expected.
. The price is above the 21-Day WEMA, which acts as a dynamic support.
. The RSI is at 72.
Take Profits:
TP1= @ 1.3508
TP2= @ 1.3549
TP3= @ 1.3605
TP4= @ 1.3668
TP5= @ 1.3713
SL= Break below S2
❤️ If you find this helpful and want more FREE forecasts in TradingView
. . . . . Please show your support back,
. . . . . . . . Hit the 👍 LIKE button,
. . . . . . . . . . Drop some feedback below in the comment!
❤️ Your support is very much 🙏 appreciated! ❤️
💎 Want us to help you become a better Forex / Crypto trader ?
Now, It's your turn !
Be sure to leave a comment; let us know how you see this opportunity and forecast.
Trade well, ❤️
ForecastCity English Support Team ❤️

USDSGDUSDSGD is currently in a descending channel
Levels to look out for:
1.342 this is where the previous lows were at, price needs to bounce off this level strongly for it to climb back to 1.35 level.

USDSGD - long - Overall trend is bearish. The market is at a daily support zone, and has rejected it 3x. Could possibly be a double bottom forming, however its too soon to be certain. A pinbar rejecting candle and a doji have also formed at support on the 4hr tf. There is also a pinbar on the daily tf. If the double bottom is completed, I’m biased for a buy after the break and retest of the neckline, which also happens to be another daily s/r zone. I will hold off on trading, until I see more confirmation.

Short for formation parallel channelWaiting to when price touches upper end of a potential parallel channel

USDSGD - long biasDaily trend is bearish. The market appears to be breaking out of the immediate trend line. There is RSI divergence on the 4hr timeframe suggesting a change in direction. I’m biased for a buy to the daily trend line. Looking for the market to retest the broken out s/r zone.

USDSGDafter break support zone and pullback it look for sell setup
Please follow and like the idea for Support and More ideas like this and share your ideas and charts in Comments Section..!!
Thanks for Your Love :)