💡Don't miss the great buy opportunity in USDSGDTrading suggestion:
". There is a possibility of temporary retracement to the suggested support line (1.3420).
. if so, traders can set orders based on Price Action and expect to reach short-term targets."
Technical analysis:
. USDSGD is in a range bound, and the beginning of an uptrend is expected.
. The price is below the 21-Day WEMA, which acts as a dynamic resistance.
. The RSI is at 40.
Take Profits:
TP1= @ 1.3440
TP2= @ 1.3466
TP3= @ 1.3489
TP4= @ 1.3515
TP5= @ 1.3550
TP6= @ 1.3605
SL= Break below S2
❤️ If you find this helpful and want more FREE forecasts in TradingView
. . . . . Please show your support back,
. . . . . . . . Hit the 👍 LIKE button,
. . . . . . . . . . Drop some feedback below in the comment!
❤️ Your support is very much 🙏 appreciated! ❤️
💎 Want us to help you become a better Forex / Crypto trader ?
Now, It's your turn !
Be sure to leave a comment; let us know how you see this opportunity and forecast.
Trade well, ❤️
ForecastCity English Support Team ❤️
SGDUSD trade ideas

USDSGD-Is getting ready for wave C) ? wave 1 completed ?Market Commentary:
LEARNING ELLIOTT WAVES IS LITTLE BIT TOUGH (FOR ME IN BEGINNING) BUT I TOOK IT AS A CHALLENGE AND THAT IS NOT IMPOSSIBLE ALSO...
First have an look for the positional trend i shared here previous....if you are a follower of me...and sometimes i will share the counter trend trade also in 15 mins and 1hr...but that is risky ones...so if the trend is bearish or bullish, if i am expecting the correction...book the profit there and wait the correction to end and again go with the trend....DONT TRADE THE COUNTER TRADE SETUP...you will took loss too...try to identify the short term pull back and the long term pull back after that took small lots in the short term PB with strict stop and go with big lots in the trend side that is long term. I WONT TOOK ALL THE TRADE PLAN SHARED HERE...
Read the market commentary inside the chart what i shared here carefully and try to learn Elliott waves...otherwise its tough to understand the market commentary and my analysis. I wont give a entry, stop loss and take profit in my chart...it is only for EDUCATIONAL PURPOSE and i am sharing how i am analysing the pair and labelling them according to the Elliott wave theory...I AM JUST SHOWING THE TREND HOW IT MAY GO AND MY VIEW(it may wrong too)..so DON'T FOLLOW BLINDLY MY CHART. Take this as a reference and if it correlate to you strategy took the trade as per your strategy...DON'T ASK ABOUT YOUR RUNNING TRADES i wont comment on them and I WONT SUGGEST TO TAKE MY TRADE SETUP.
I am a technical analyst based on trendline, channel, fib retracements, expansion, stochastic for divergence, EMA's and MA's are finding the pull backs and MAJOR IS ELLIOTT WAVES...those mentioned above are using as a TOOLS only. I am not a fundamental, sentimental trader...but only the fundamental will boost my technical analysis to reach my target or sometimes it will go against me and then i will manage the trade according to the Elliott waves alternate views...Each and every trade plan i am sharing here has a alternate view and i am sharing only the most probabilities(70-80%) here...sometimes the other (20-30%) may market do..then i will change the wave counts and labelling according to the price action.
All labelling and wave counts done by me by manually and i will keep change according to the LIVE MARKET PRICE ACTION. So dont bias, hope on my trade plans...try to learn and make your own strategy...Following is not that much easy...I AM NOT RESPONSIBLE FOR ANY LOSSES IF U TOOK THE TRADE ACCORDING TO MY TRADE PLANS....THANKS LOT..CHEERS

9th Sept 2021 USD/SGD Daily Chart Buy SetupNice buy signal formed today on the Singapore dollar pair on the Daily FX chart. You can read my notes on the chart to see what I'm thinking about this set up. Cheers.

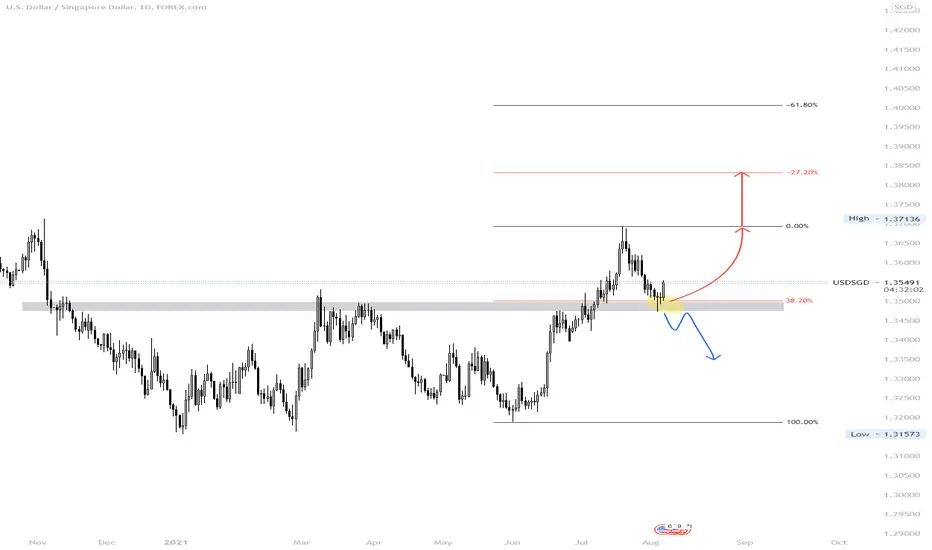
USDSGD: Classic Structure Trade Explained
Singapore dollar dropped to a key daily demand cluster.
Forming a bullish flag pattern on 4H, the price broke and closed above its resistance
approaching an underlined yellow area.
Now growth is expected.
First goal - 1.3468
❤️Please, support this idea with a like and comment!❤️

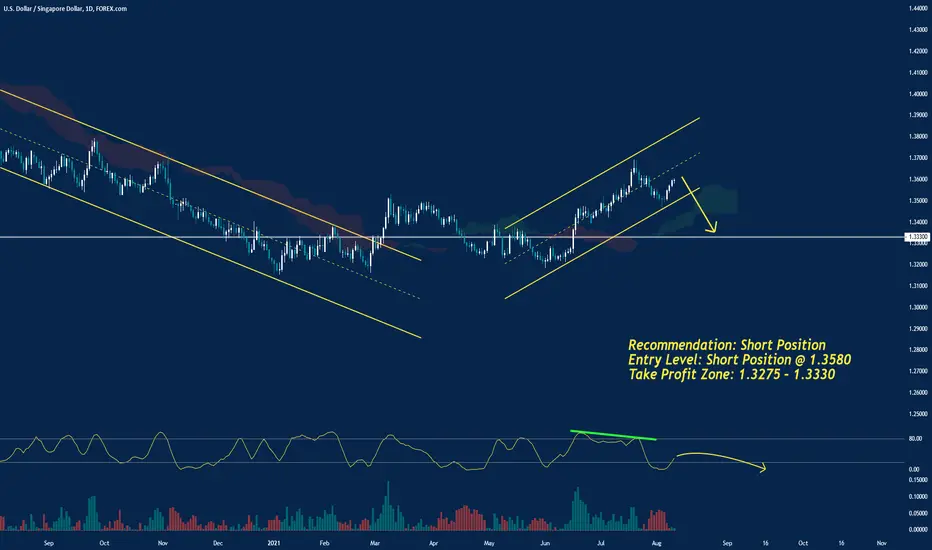
USDSGD Short Based off my technical analysis USDSGD has been overall bearish ( measured from monthly chart ) Using my fibs tool the bullish move was only a retrace to 38.2 fib level (measure from weekly chart ). You can see I have my bullish trend line measured. That trend line was broken through, which is a signal for a good sell move. Price also failed to break through resistance level. A double top reversal pattern was also formed at the resistance level. Take profit area can possibly be around 1.31545.
Lastly price has to retraced near the double top neckline and where it broke the bullish TL. This will mean that price will be good to buy up until 1.3500 area.
If you agree with my analysis please like or comment your input.


26 Aug: USDSGD bounce incomingHi everyone, USDSGD is approaching the support zone in line with the 78.6% retracement and ascending trend line which presents an opportunity to buy. A break above the resistance zone at 1.35980 could see a further upside in prices.

usdsgd longusdsgd long.
into support.
profit target in a moving average will be be adjusted over time.

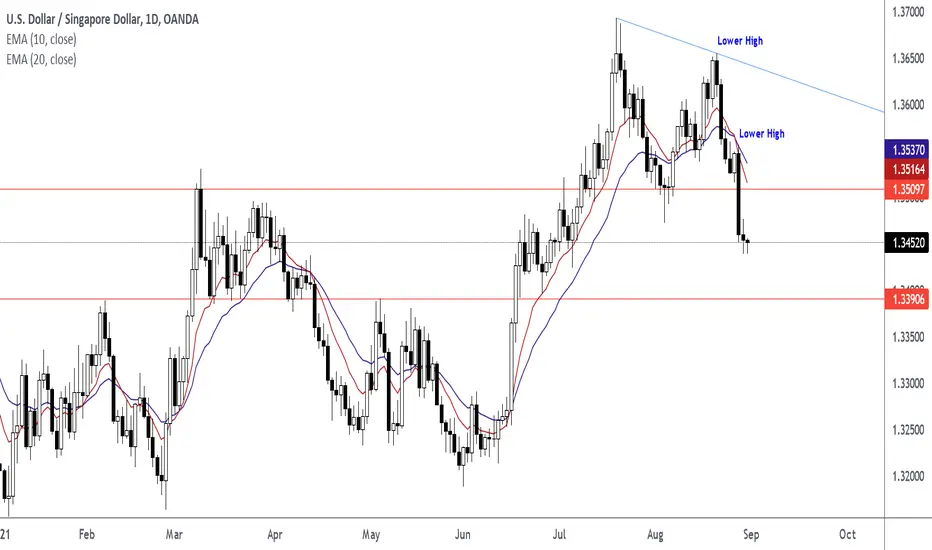
USDSGD Bearish Reversal, Expect Down Move here
Hi everyone:
Here on USDSGD, there's potential opportunities for a bearish continuation to happen.
We can see after a strong bearish impulse phase on the higher time frame, price begin to correct within a larger expanding correctional structure.
With a few swing highs and lows, price had a move up, but failed to continue higher. with any further bullish corrections.
Instead it formed a reversal impulse move down, follow by a bearish continuation.
This all good indication that the expanding structure has hit the top, and a bearish continuation of the higher time frame is possible.
Watch for lower time frame price action to form continuation correction after breaking out to look for entries down the recent lows.
Thank you

USDSGD selling opportunity USDSGD SELL SETUP
- USDSGD breached below a bullish counter-trendline
- Structure is pushing down
- We have a break in market structure
- Price is approaching Low of the day (we can expect a pullback to our area of interest marked in as rectangle on the chart)
- Trend predilection is (BEARISH)
- Momentum (Bearish)
- Environment (Bearish)
- Plan is to wait for a Short opportunity on USDSGD
- Take the trade when your rules are fulfilled
A BEARISH MOVE is probable in this market.

Ascending within Ascending + Breakout bear Flag entryWe have An ascending Structure within a larger Ascending structure, Price looks like it may be forming a HTF "M" style pattern but the sell off may come sooner, that's why the focus is on the the ascending within and when it completes. Looking for tight LTF correction after the breakout for the entry.

USDSGD-Will reach 1.34 for b) or triangle or irregular ?Market Commentary:
LEARNING ELLIOTT WAVES IS LITTLE BIT TOUGH (FOR ME IN BEGINNING) BUT I TOOK IT AS A CHALLENGE AND THAT IS NOT IMPOSSIBLE ALSO...
First have an look for the positional trend i shared here previous....if you are a follower of me...and sometimes i will share the counter trend trade also in 15 mins and 1hr...but that is risky ones...so if the trend is bearish or bullish, if i am expecting the correction...book the profit there and wait the correction to end and again go with the trend....DONT TRADE THE COUNTER TRADE SETUP...you will took loss too...try to identify the short term pull back and the long term pull back after that took small lots in the short term PB with strict stop and go with big lots in the trend side that is long term. I WONT TOOK ALL THE TRADE PLAN SHARED HERE...
Read the market commentary inside the chart what i shared here carefully and try to learn Elliott waves...otherwise its tough to understand the market commentary and my analysis. I wont give a entry, stop loss and take profit in my chart...it is only for EDUCATIONAL PURPOSE and i am sharing how i am analysing the pair and labelling them according to the Elliott wave theory...I AM JUST SHOWING THE TREND HOW IT MAY GO AND MY VIEW(it may wrong too)..so DON'T FOLLOW BLINDLY MY CHART. Take this as a reference and if it correlate to you strategy took the trade as per your strategy...DON'T ASK ABOUT YOUR RUNNING TRADES i wont comment on them and I WONT SUGGEST TO TAKE MY TRADE SETUP.
I am a technical analyst based on trendline, channel, fib retracements, expansion, stochastic for divergence, EMA's and MA's are finding the pull backs and MAJOR IS ELLIOTT WAVES...those mentioned above are using as a TOOLS only. I am not a fundamental, sentimental trader...but only the fundamental will boost my technical analysis to reach my target or sometimes it will go against me and then i will manage the trade according to the Elliott waves alternate views...Each and every trade plan i am sharing here has a alternate view and i am sharing only the most probabilities(70-80%) here...sometimes the other (20-30%) may market do..then i will change the wave counts and labelling according to the price action.
All labelling and wave counts done by me by manually and i will keep change according to the LIVE MARKET PRICE ACTION. So dont bias, hope on my trade plans...try to learn and make your own strategy...Following is not that much easy...I AM NOT RESPONSIBLE FOR ANY LOSSES IF U TOOK THE TRADE ACCORDING TO MY TRADE PLANS....THANKS LOT..CHEERS


USDSGD Target Price 1.36933USDSGD. Waiting For Price To Reach 1.36933.
Weekly Time Chart
Daily Time Frame Chart For Pin Bar On August-4-2021 (Replay Chart)

USD/SGD: FUNDAMENTAL ANALYSIS+PRICE ACTION & NEXT TARGET|SHORT🔔The final Singapore GDP for the second quarter decreased 7.2% quarterly and increased 14.7% annualized. Economists predicted a decrease of 2.0% and an increase of 14.2%. Forex traders can compare this to the previous Singapore GDP for the second quarter, which decreased 7.7% quarterly and increased 14.3% annualized. The Singapore Current Account for the second quarter was reported at S$25.64B. Forex traders can compare this to the Singapore Current Account for the first quarter, reported at S$24.42B.
The US CPI for July is predicted to increase 0.5% monthly and 5.3% annualized. Forex traders can compare this to the US CPI for June, which increased 0.9% monthly and 5.4% annualized. The US Core CPI for July is predicted to increase 0.4% monthly and 4.3% annualized. Forex traders can compare this to the US Core CPI for June, which increased 0.9% monthly and 4.5% annualized. The US Monthly Budget Statement for July is predicted at -$307.0B. Forex traders can compare this to the US Monthly Budget Statement for June, reported at -$174.0B.
The forecast turned bearish for the USD/SGD turned bearish as the advance is closing in on its end phase. Will bears gather enough momentum to force the USD/SGD into its horizontal support area?
Check the Links on BIO and If you LIKE this analysis, Please support our page by hitting the LIKE 👍 button
Traders, if you like this idea or have your own opinion about it, please write your own in the comment box . We will be glad for this.
Feel free to request any pair/instrument analysis or ask any questions in the comment section below.
Have a Good Day Trading !
We Play In A Re Distribution .We are in a re distribution on USDSGD and i predict approximately 5 years from now to end , i normally make long term sell investment on this situations but on shorter term perspective we finished a re accumulation inside of this re distribution we can get a short term long and targeting 1.46 , but we have to be aware we are in a long term choppiness on this pair .

Daily Forex Charts Tuesday 10th August 2021Here are 4x new trade setups on the Forex Daily charts. You can refer to my notes on the chart and also my audio from the video. Cheers. Jim


USDSGD// SwingHuge spread, possible entry on a slight pull back. Price has a long way to go.
Prev analysis linked.
USD/SGD (INTRADAY!) short possibility!Hello traders,
Exotic pairs are not often to good for daytrading because of the higher spreads they calculate for these pairs.
But here is a pretty nice setup where we can have a solid entry with a pretty tight stoploss and a solid profit-point.
Structure first needs bearish momentum before we take our indicators and check the entry point.
So keep an eye on this one.
Kind regards.

