USD/SGD: DAILY PRICE ACTION + HARMONIC GARTLEY 🔔Welcome back Traders, Investors and Community!
Analysis of #USDSGD
If you have found this useful then help us support my page by hitting the LIKE button.
If you are not subscribed yet then please feel free to follow my page for daily updates and ideas. Thank you
It means a lot to us!
***
Strategy: We can see a Flag pattern + Bearish Gartley Pattern - We will be waiting for all the confirmations to enter in this trade.
A clear chart is Always the best business card for a trader.
***
Your support and feedback will always welcome
Thank you for your time.
The information contained herein is not intended to be a source of advice or credit analysis
Regards,
Walter
SGDUSD trade ideas


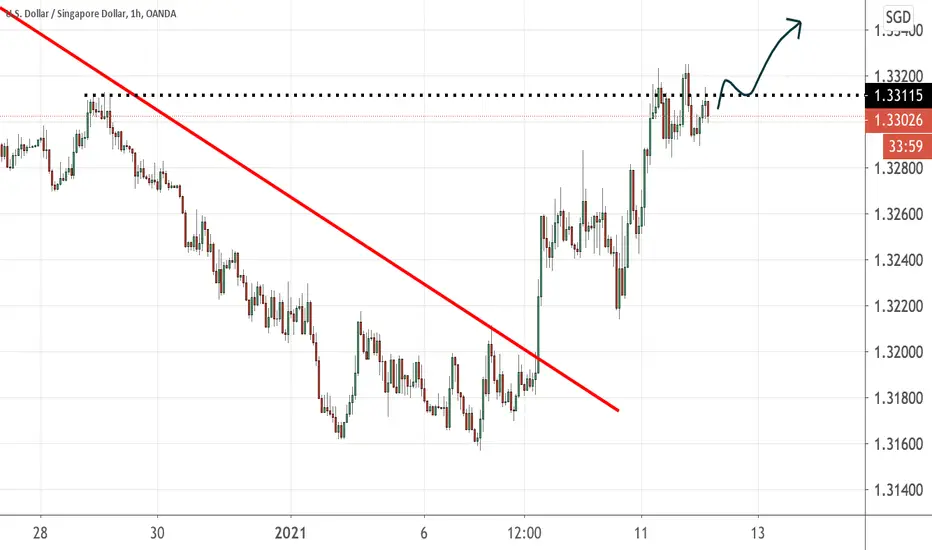
USDSGD Trade Set UpThis pair has been trending down since march 2020. I expect a total reversal now or a higher degree corrective structure. If it breaks the rejection zone then I expect a bull run. It can still take off after it takes its previous low. As the pattern develops i will keep this idea updated, so like, comment, follow so you don't miss any update. Thank you.


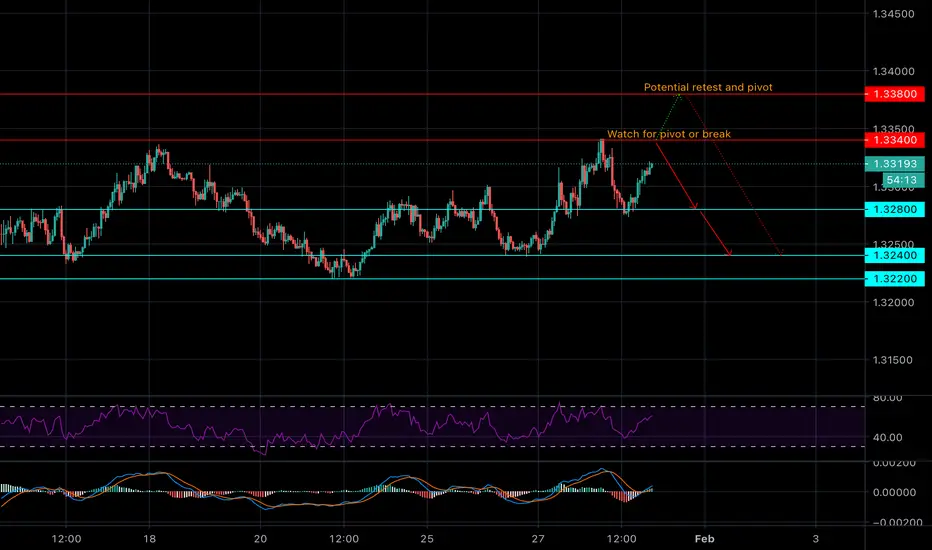
Analysis off resistance rejectionLooking for a pivot at marked resistance for a sell. These levels are 1.33400 and 1.33800.
Look for a clear pivot off these levels for a sell entry. Currently MACD and Signal are above zero lines with potential cross through high volume Histogram bins telling us a retest is in play.
A pivot off one of these rejections will initiate a macd/signal down cross to proceed towards 0 line.
This is a strict analysis. Please comment with thoughts and ideas. Thank you.
USDSGD: BUYDuring 2020 the Singapore dollar strengthened against the US dollar from 1.3453 to 1.3211. The Singapore dollar’s modest appreciation despite the sharp decline in the dollar in 2020 reflected the impact of MAS’ neutral SGD NEER policy set in response to the COVID-19 shock. This neutral policy will set the tone for USDSGD trading for the entire year of 2021, setting constraints for Singapore dollar gains despite extended dollar weakness and potential improvements in current account surpluses. Further monetary easing is unlikely this year as fiscal policy is doing the heavy lifting.
Taking a look at our Trade Plan this week on USDSGD, we see a great spot for Bulls to enter now right around 1.32499 and expect areas of TP to be at 1.33667 . This is not a usual pair we trade, however, when there's opportunity clearly seen, we must take them.
If you enjoy our analyses, please do comment and let us know how we're doing.

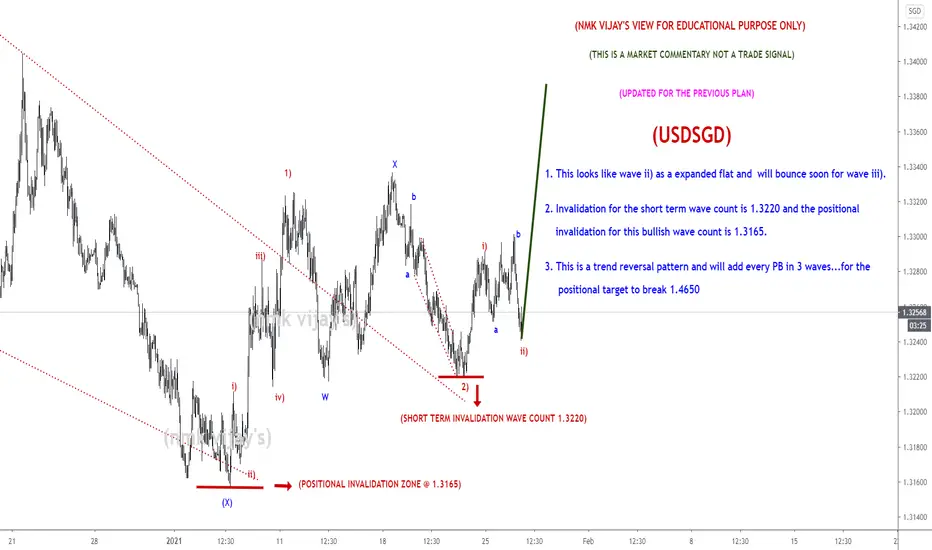
USDSGD-Looking for a bullish PA and INVALIDATION as SLMarket Commentary:
LEARNING ELLIOTT WAVES IS LITTLE BIT TOUGH (FOR ME IN BEGINNING) BUT I TOOK IT AS A CHALLENGE AND THAT IS NOT IMPOSSIBLE ALSO...
First have an look for the positional trend i shared here previous....if you are a follower of me...and sometimes i will share the counter trend trade also in 15 mins and 1hr...but that is risky ones...so if the trend is bearish or bullish, if i am expecting the correction...book the profit there and wait the correction to end and again go with the trend....DONT TRADE THE COUNTER TRADE SETUP...you will took loss too...try to identify the short term pull back and the long term pull back after that took small lots in the short term PB with strict stop and go with big lots in the trend side that is long term. I WONT TOOK ALL THE TRADE PLAN SHARED HERE...
Read the market commentary inside the chart what i shared here carefully and try to learn Elliott waves...otherwise its tough to understand the market commentary and my analysis. I wont give a entry, stop loss and take profit in my chart...it is only for EDUCATIONAL PURPOSE and i am sharing how i am analyzing the pair and labeling them according to the Elliott wave theory...I AM JUST SHOWING THE TREND HOW IT MAY GO AND MY VIEW(it may wrong too)..so DON'T FOLLOW BLINDLY MY CHART..take this as a reference and if it correlate to you strategy took the trade as per your strategy...DON'T ASK ABOUT YOUR RUNNING TRADES i wont comment on them and I WONT SUGGEST TO TAKE MY TRADE SETUP.
I am a technical analyst based on trendline, channel, fib retracements, expansion, stochastic for divergence, EMA's and MA's are finding the pull backs and MAJOR IS ELLIOTT WAVES...those mentioned above are using as a TOOLS only. I am not a fundamental, sentimental trader...but only the fundamental will boost my technical analysis to reach my target or sometimes it will go against me and then i will manage the trade according to the Elliott waves alternate views...Each and every trade plan i am sharing here has a alternate view and i am sharing only the most probabilities(70-80%) here...sometimes the other (20-30%) may market do..then i will change the wave counts and labeling according to the price action.
All labeling and wave counts done by me by manually and i will keep change according to the LIVE MARKET PRICE ACTION. So dont bias, hope on my trade plans...try to learn and make your own strategy...Following is not that much easy...I AM NOT RESPONSIBLE FOR ANY LOSSES IF U TOOK THE TRADE ACCORDING TO MY TRADE PLANS....THANKS LOT..CHEERS
USDSGD: H4: ShortPrice under downtrend. Medium trend line breakout. Bears are strong. D1 momentum is begin.. Let's short!!

USD SGD BUY (US DOLLAR - SINGAPORE DOLLAR)Hi there. Price is forming a continuation pattern to the upside.
Watch strong price action at the current levels for buy.


USD/SGD breakdown bearish wedgeDollar index weaker and 1.9T stimulus
Breakdown bearish wedge today, full red candle
Prefer to SELL
Take 30-50 pips profit
JUST FOR IDEAS!!
DISCLAIMER!!
This is for general information purposes only. It is not investment advice or an inducement to trade.

USD/SGD POSSIBLE BOTTOM FORMATION ABOVE 1.333Pivot 1.325
Long signal on the 4hr targets 1.333 then 1.357 Stop 1.325
Break of 1.325 targets 1.300 then 1.200
Long term downtrend
Medium term downtrend
Short term downtrend (possible bottom if 1.325 holds)

USDSGD on a counter channel 🦐USDSGD on the 4 chart is moving inside a daily descending channel.
The market after the bounce on the weekly support, bounce until the 0.786 Fibonacci retracements inside a channel.
If the price will break below, according to Plancton's strategy, we can set a nice short order.
–––––
Follow the Shrimp 🦐
Keep in mind.
🟣 Purple structure -> Monthly structure.
🔴 Red structure -> Weekly structure.
🔵 Blue structure -> Daily structure.
🟡 Yellow structure -> 4h structure.
⚫️ Black structure -> >4h structure.
Here is the Plancton0618 technical analysis , please comment below if you have any question.
The ENTRY in the market will be taken only if the condition of the Plancton0618 strategy will trigger.

UPDATE: short confirmation USDGDThe macd crossed over the signal line giving us a buy signal, I bought in at the resistance point but it is not too late for a good risk reward ratio. Set stop loss at latest swing high and let the momentum run its course.

REPUTATIONi need 5 reputation in order to be able to chat so i can learn, For this chart i think it will bounce off the resistance line i drew and continue the previous downtrend, take a look on the 4hr chart too.

big potential reversal if it cant get through this resistanceUSDSGD
Could have a big swing down if it gets enough momentum bouncing off this resistance line at the 200 ema, look for a reversal signal
PLEASE UPVOTE FOR REPUTATION SO I CAN CHAT :)

USDSGD Short short & Short!
We are yet to have meaningful progress in this currency pair upside trajectory. Therefore we short further!
This is not financial advice.

USDSGD bullish swing to $1.3685One of the limits for the year has been triggered by this instrument so I am long the currency pair. I typically close instruments based on weekly close so a weekly close below $1.3206 is my reason to close and potentially switch sides. This trade will be held for weeks once it goes into profit.
I got filled at $1.32935 with a SL of $1.314 with a target of $1.3685
This is for entertainment purposes only.
Trading come with risk and you should consult a financial advisor for financial advice.


SGDUSD soars like a Phoenix.And keeps going strong. Strong bullish signals on this one to take us even higher. A good change in light of many Asian pairs going red.


USDSGD to 1.35Guys, this is what I am looking at for now. It does not mean that the bear trends is over but the way I look at the chart, this could be a relief rally of sort. So, I am merely taking advantage of this situation and go long temporarily.....
1.35 is a guide , it could be even higher or lower and I would update as frequently as I could.