Don't miss the great buy opportunity in USDSGDMidterm forecast:
. While the price is above the support 1.3430, beginning of uptrend is expected.
. We make sure when the resistance at 1.3754 breaks.
. If the support at 1.3430 is broken, the short-term forecast -beginning of uptrend- will be invalid.
Technical analysis:
. The RSI downtrend #1 is broken, so the probability of beginning of uptrend is increased.
. A peak is formed in daily chart at 1.3985 on 06/22/2020, so more losses to support(s) 1.3550 and minimum to Major Support (1.3430) is expected.
. Price is below WEMA21, if price rises more, this line can act as dynamic resistance against more gains.
. Relative strength index (RSI) is 50.
Take Profits:
TP1= @1.3754
TP2= @1.3885
TP3= @1.4035
TP4= @1.4270
TP5= @1.4635
TP6 Free
❤️ If you find this helpful and want more FREE forecasts in TradingView
. . . . . Please show your support back,
. . . . . . . . Hit the 👍 LIKE button,
. . . . . . . . . . Drop some feedback below in the comment!
❤️ Your Support is very much 🙏 appreciated! ❤️
💎 Want us to help you become a better Forex trader ?
Now, It's your turn !
Be sure to leave a comment let us know how do you see this opportunity and forecast.
Trade well, ❤️
ForecastCity English Support Team ❤️
SGDUSD trade ideas

Don't miss the great buy opportunity in USDSGDMidterm forecast:
. While the price is above the support 1.3430, beginning of uptrend is expected.
. We make sure when the resistance at 1.3754 breaks.
. If the support at 1.3430 is broken, the short-term forecast -beginning of uptrend- will be invalid.
Technical analysis:
. The RSI downtrend #1 is broken, so the probability of beginning of uptrend is increased.
. A peak is formed in daily chart at 1.3985 on 06/22/2020, so more losses to support(s) 1.3550 and minimum to Major Support (1.3430) is expected.
. Price is below WEMA21, if price rises more, this line can act as dynamic resistance against more gains.
. Relative strength index (RSI) is 50.
Take Profits:
TP1= @1.3754
TP2= @1.3885
TP3= @1.4035
TP4= @1.4270
TP5= @1.4635
TP6 Free
❤️ If you find this helpful and want more FREE forecasts in TradingView
. . . . . Please show your support back,
. . . . . . . . Hit the 👍 LIKE button,
. . . . . . . . . . Drop some feedback below in the comment!
❤️ Your Support is very much 🙏 appreciated! ❤️
💎 Want us to help you become a better Forex trader ?
Now, It's your turn !
Be sure to leave a comment let us know how do you see this opportunity and forecast.
Trade well, ❤️
ForecastCity English Support Team ❤️

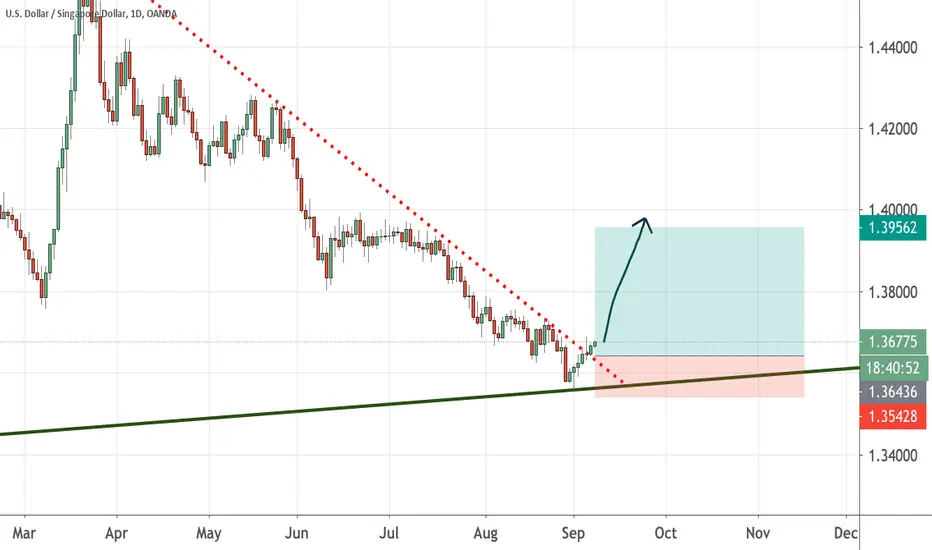
7% discount for USDSGD The USDSGD has peaked on 13th March at 1.46 and has since tumbled down 7% to a low of 1.356 on 1 Sept 20. It has just broke out from the bearish trend line and I believe this is a great opportunity to go long once more and ride it to 1.40 and then 1.42.
You can see the risk is pretty low as if the market moves against us by returning the price back to either the bearish trend line or worse, below the weekly bullish trend line (taking 1 Sept 1.356 as guide)
See you at 1.40 later ,guys !

The weak economic projections for the Singaporean economyThe weak economic projections for the Singaporean economy are very detrimental to the country’s beloved currency. Prices of the US dollar to Singaporean dollar exchange rate are bound to go up to their support level thanks to the recent reports about Singapore’s economy which cast a massive cloud of gloom in the country. Most experts say that Singapore’s economy is expected to shrink drastically in the third quarter of the year thanks to the coronavirus pandemic. The economic contraction in Singapore is said to be the country’s worst quarterly contraction in history according to the Singapore Department of Statistics. Meanwhile, the US dollar might finally see positive waters in the coming weeks as the US economy records better signs amidst the chaos faced by the country. The upbeat US jobs report last week was the main factor why the dollar gained as it eased the hopes of new stimulus measures from the government.


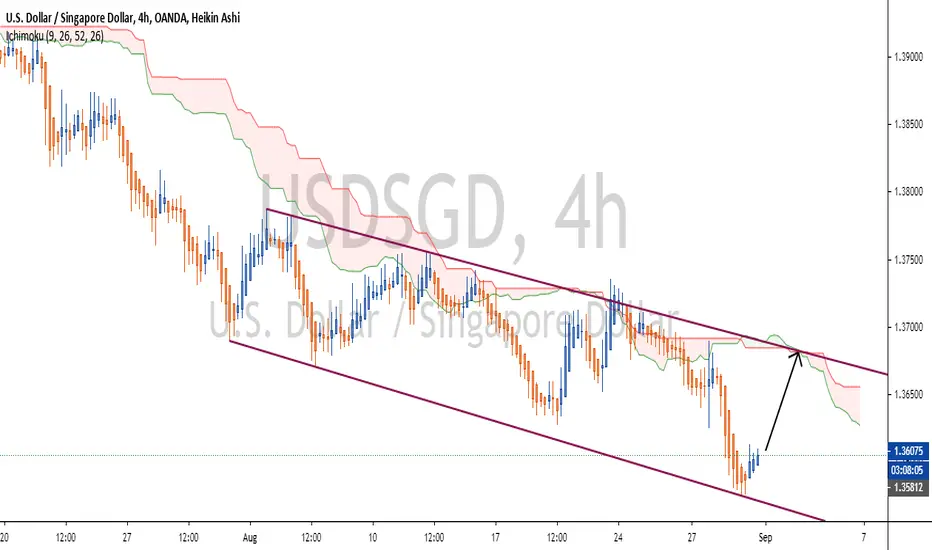
USDSGD Remains Bearish Selling Opportunities continue for USD Singapore Dollar.
Wait for the trendline break to go short


USD/SGD short, Daily with a 4 hour entry.Looking for a short entry here if price breaks 4 hour pull;back tradnline. Looking for a 100pip move here. Measured move


USDSGD Key Resistance LevelPrice at key resistance on the trendline support
Wait for break and confirmation to enter short

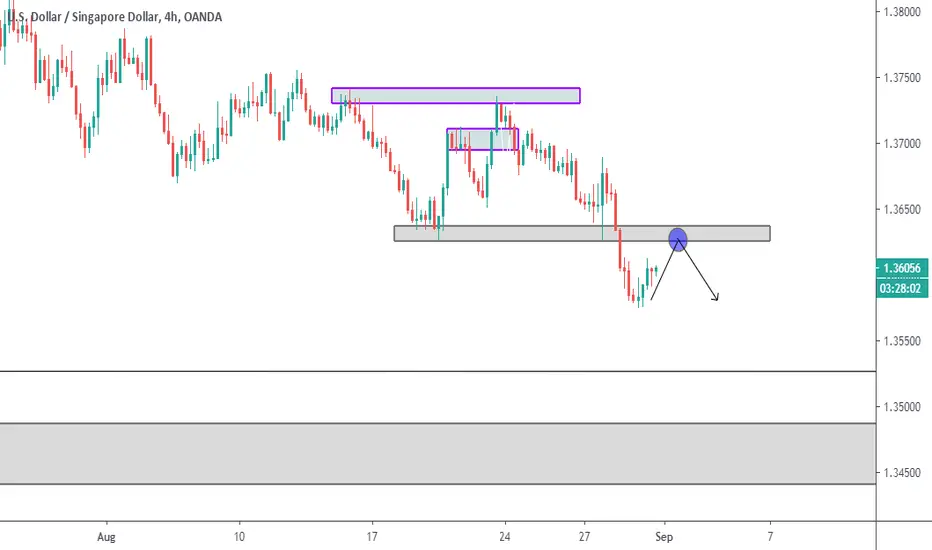
USDSGD Sell LimitUSDSGD is in a clear downtrend on H4, breaking and retesting horizontal levels.
I expect it to test this marked level and continue its downtrend

Possible SHORT Opportunity on USDSGDLooking for a Retest at the previous S/R Zone with rejecting wicks to look for Short opportunity.
USD/SGD Long-term outlookUSD/SGD currency pair testing multi-year rising support.
On the 23rd of March this year the USD/SGD currency pair topped out at the 2nd of January 2017 highs (Double Top) and has since declined relentlessly. Now testing multi-year rising (A) and falling wedge support at (1). A good buying opportunity for the long term could present itself above (1) with 1.37300s as a first resistance zone to watch for, followed by 1.38449 and 1.39458 whereby a good selling opportunity could hinder the bulls’ efforts for the short term before the uptrend resumes.
Alternatively, if the bears can breach this dual support zone now in play, and push prices below the January ‘20 lows at 2 (1.34469) we can expect to see an increase in selling pressure forcing prices furthermore to low 133s, followed by 1.31665 and 1.30039 in extension.

USD / SGD Potential Rebound Strong SupportHave to watch this support line very clearly. The strong support that was tested 3 times prior.


USD SGD BUY (US DOLLAR - SINGAPORE DOLLAR)Hi there. Price is forming a reversal pattern to change its direction. Watch strong price action at the current levels for buy.

USDSGD counter-trend tradeOption 1 : BUY
Support T-Line 2014 July
Buy and take 50-100 pips
Note: Wait for rejection candles and 50MA crosses 200MA
Option 2: SELL
Breakdown T-Line and retest, SELL
Take 80-100 pips
Note : Strong Support level 1.34500
JUST FOR IDEAS!!
DISCLAIMER!!
This is for general information purposes only. It is not investment advice or an inducement to trade.

Bearish Usd/Sgd Set-upA bearish view for Usd/Sgd done over SnR break and Zig Zag pattern
----------------------------
Ideas in this page are speculative and not a financial market investment advice , please apply your own analysis and confirm it with price action.
