USDSGD ↘️ Rising wedge breakout .150+ Hello Everyone 🙋🏽♂️
🔴 1.36704
🟢 1.35540
🟢 1.34735
We are not responsible of any losses for anyone, our trades are profitable more for long terms and we take losses as everyone,
manage your lot size as well and your SL and TP
Don't forget to hit the like bottom and write a comment to support us.
Follow us for more 🙋🏻♂️
Best Regard / EMA Trading .
Disclaimer:
----------------
It's not a financial advise, As everyone we take losses sometime but for long term trading we are profitable traders, so manage your account well with SL and TP and your lot size to keep your account safe and stay in the market .
SGDUSD trade ideas

USDSGD - Text Book Reversal!USDSGD has recent topped with a beautiful rejection! We had the 50 fibonacci, channel AND an ending diagonal, all indicating a reversal!
Now that we've topped, we can look for any pullbacks to add a position for the massive drop.
Trade idea:
- Watch for pullback
- once pullback appears, look for a trendline break or structure rejection
- Enter with stops above the highs (above 50 fib)
- Targets: 1.305 (700pips), 1.27 (1000pips)
Goodluck and as always, trade safe!

USDSGD Channel Up trading strategyWe haven't looked into the USDSGD pair in a long time (May 16), with the last idea giving a great bullish break-out signal:
The pair has since entered a Channel Up pattern, with the latest bullish leg since July 14, just reaching the top (Higher Lows trend-line) of the pattern. This is also the 0.5 Fibonacci retracement level from the 2022 High. As long as the price trades under it, we will be short, targeting the 1D MA50 (blue trend-line) at 1.36250. If the 0.5 Fib breaks, we will close the sell and go long instead, targeting 1.38600 (Resistance 1).
-------------------------------------------------------------------------------
** Please LIKE 👍, FOLLOW ✅, SHARE 🙌 and COMMENT ✍ if you enjoy this idea! Also share your ideas and charts in the comments section below! **
-------------------------------------------------------------------------------
💸💸💸💸💸💸
👇 👇 👇 👇 👇 👇

USDSGD could perform well this weekUSDSGD has been in a sell-off last week undervaluing the USD vs the Singaporian dollar... Knowing that the US dollar could rally in the coming days due to macro economic circumstances, a undervalued pair like this one could be a great opprtunity for a BUY.

USDSGD - In Bullish TrendThis pair is printing consistent HHs and HLs without any sign of reversal. This seems to suggest it will continue to move upward.

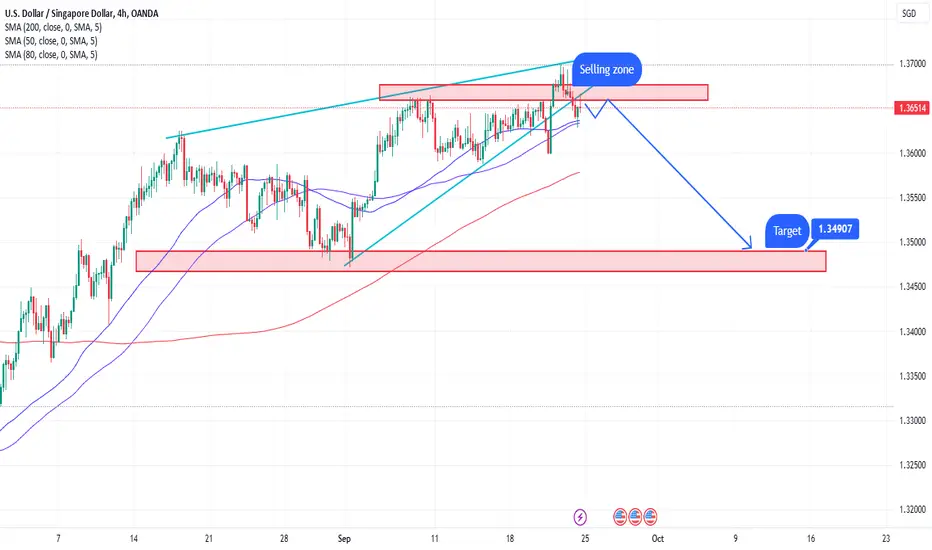
sells USDSGDUSDSGD looks good for some sells because its at a strong resistance , i believe once the 1.36809 holds we shall see sells towards 1.34907. before taking this trade look for good rejection candles to the upside
USDSGD Head & Soolders Chart Pattern.Hello everyone
AS you could see we have here a head and shoulders pattern with a Break of structure
for The Higher high with creating lower low to retest the ascending channel
You could set a SL : 1.35000
TP : 1.37900
Please support us with a like comment and Follow.


Michigan consumer sentiment will shock us all In 6 days we have a major update to come and technically speaking we have what i call a sandwich panel set up in which a bearish candle is stocked in between 2 bullish ones now once the said second bullish candle close exceeds the high of the said bearish lone candle we can count on a perfect trend reversal .

Ichimoku RSI AnalysisPrice was in overbought area, so we expect that price come down and touch the Kumo!

Long USDSGDIt appears that USDSGD may be setting up for a multi-day bull run.
Last week USDSGD posted a green weekly Heiken Ashi candle and I suspect it may do it again.
It is also the case that USDSGD posted a green daily Heiken Ashi candle after multiple red Heiken Ashi candles on the daily.
This signals to me that we may be in for a bull run this week.

USD/SGDI might try a long down here if it holds the 38 fib.
target the top resistance
With a stop somewhere below the bottom of the flag.

USD/SGD IS MAKING BULLISH HARMONIC PATTERN.USD/SGD will make AB=CD pattern if the divergence will formed on point D. Currently we are waitnig for the break out of point B so we will short it

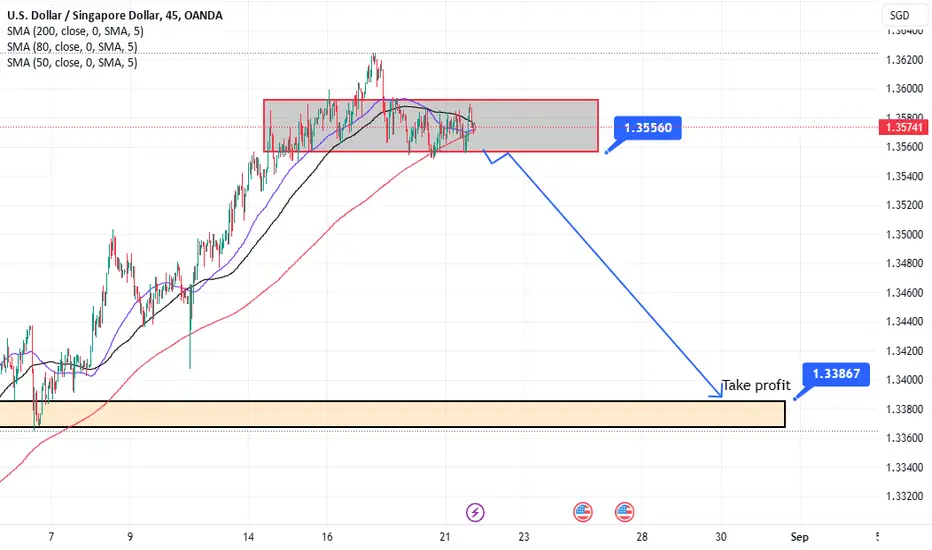
Sells USDSGDUSDSGD is at a very strong resistance , price has formed a bearish flag and also there is a crossover of three moving averages 80,100 and 200 indicating high probability of sells.wait for price to break 1.35560 and take sells towards 1.33867
USDSGD at structure high USDSGD at structure high ,soon will be looking
to short the dollar. structure guides us

Potential Short USDSGD 1HUSDSGD 1H forming potential head and shoulders. Once break neckline should continue to fall.
SHORT
EP = 1.35616 (can enter now if you are risk taker)
TP = 1.3508
#USDSGD

USD/SGD - Potential Trend Reversal to BearishIn 15 minutes time frame this pair has formed a bearish divergence along with a rising wedge bearish reversal pattern. This could be a sign of a trend reversal to bearish.

USDSGD Potential Pullbacks to shortLooking for pullbacks to short at these levels. Basically selling off the yearly close, seeing shorter term usd flows as being bearish.

Where else can it go?Price is testing the broken flag support. There is too much bearish pressure for a comeback. It may try go to higher but I think the sellers are just waiting to add to their positions if it happens. I just opened a short position, if it goes up I'll add another short. It may take a few more days to drop when it falls it does it very fast.

SELL SETUPThe market has reached the daily swapzone,our daily resistance. The market is trending in the daily timeframe, in this market we might considere looking for sell opportunities. to be on the safe side always follow the trend, even if you get stopped out on your trade you will know why. it might be early entry, you entered before manipulation has happened.
It is important to execute trades after manipulation has happened or after having your buy or sell properties, but most importantly don't trade what you always see in the market, have a plan and execute your plan, in that way i am 100&10 percent sure that you will become a consistant trader.

USDSGD for buyersUSDSGD for buyers ,price could just take off from current price or give us that 3rd sweet touch plus a new low

USD/SDG - In Bullish TrendThis pair is following along the bullish trendline and print consistent HHs and HLs which indicates it will continue its bullish trend.

Technical Analysis: USDSGD Forex Pair 📈 #ForexAnalysis #USDSGD #ShortPosition #BearishPressure 📉
🔍 Technical Analysis: USDSGD Forex Pair 🔍
Hey traders! 📊 Today, let's take a closer look at the US Dollar/Singapore Dollar (USDSGD) Forex pair and explore some interesting insights that could potentially guide our trading decisions. 🤝
📉 Price Action and Trend Observation:
The USDSGD pair has recently experienced a significant event - the breaking of its support levels from January 4th, 2021. 📅 This bearish move suggests a potential shift in the trend, indicating a possible downward direction.
💔 Broken Flag Support:
As of now, the price is testing the broken flag support, which could act as a resistance level. 🚧 This retest offers traders an opportunity to take advantage of the bearish momentum in the market.
🐻 Too Much Bearish Pressure:
The prevailing bearish sentiment is evident, and it appears that there is substantial bearish pressure that may deter any immediate bullish comeback. 📉 The sellers seem to be waiting eagerly to add to their positions if the price attempts to rally, which might act as a barrier to any upward movement.
📉 Short Position Strategy:
Given the bearish environment, I have just opened a short position in the USDSGD pair. If the price happens to rally, I'm prepared to add another short position to capitalize on potential further downside. 💼 However, it is essential to stay cautious and manage risk appropriately, considering the volatile nature of the Forex market.
⏳ Time Frame and Potential Scenario:
This analysis is based on a 1-week time frame, suggesting that the anticipated downward move may take a few more days to unfold. But keep in mind, when the price falls, it often does so rapidly, offering excellent trading opportunities for short-term gains.
Remember, successful trading involves a combination of analysis, risk management, and discipline. 🚀 Always use proper risk-to-reward ratios and employ stop-loss orders to protect your capital.
#ForexTrading #TradingOpportunities #TechnicalAnalysis #ShortingOpportunity #TradeSmart #RiskManagement #USDSGDAnalysis
Disclaimer: This analysis is for informational purposes only and should not be considered as financial advice. Trading Forex involves substantial risk, and traders should exercise caution and conduct their research before making any trading decisions. Always do your due diligence and consult with a qualified financial advisor if needed. Happy trading! 📈📉
