Gold rinse and repeatSimple, more shorts on gold as it looks like a rinse and repeat from previous sessions price action
Gold Futures
AU1! trade ideas
WE GOT THE SWEEP ON GOLD!!!!THIS is the move I was waiting for! we got the full sweep on levels. looking for price to flip back to bullish pressure from here. Now we just wait for the entry to show as we move into the Asian Killzone.

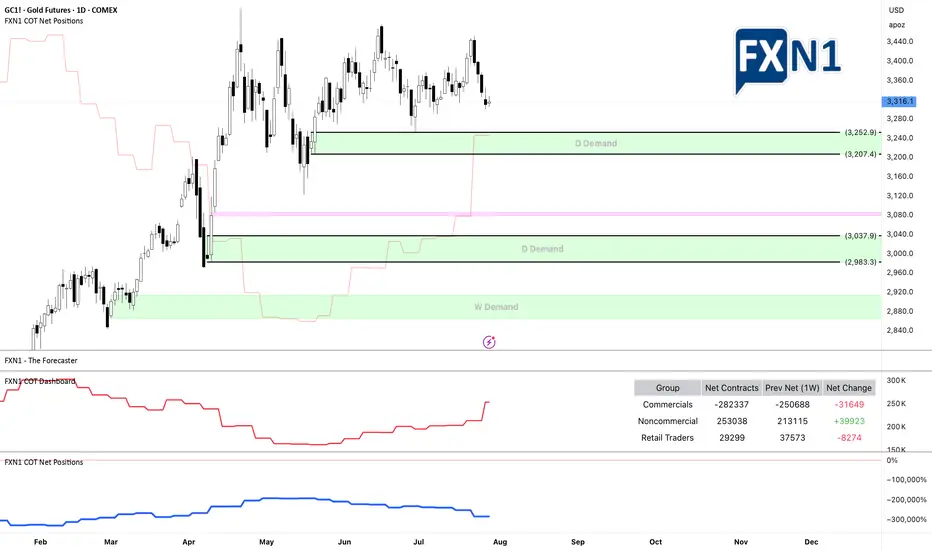
Gold Price Analysis (GC1! or XAU/USD): Challenges and OutlookSince reaching a historic high of $3,509 on April 22, 2025, gold has struggled to maintain its upward momentum. On the daily timeframe, the price experienced a sharp rejection spike after touching that peak, prompting a sideways range as the market seeks a clearer direction.
From a technical perspective, a stronger US dollar typically puts downward pressure on gold, making it a more expensive investment for holders. However, examining the chart of GC1! * alongside the DXY shows that even during periods of a robust dollar, gold has continued to rise. Additionally, recent years have seen seasonality effects on gold largely ignored, with the yellow metal persistently climbing. The underlying reasons are multifaceted, but a key factor is gold’s status as a safe-haven asset—investors prefer to hold gold during times of uncertainty and economic turmoil.
* GOLD and DXY correlation
Looking ahead, investors are awaiting the Federal Reserve’s upcoming monetary policy announcement scheduled for Wednesday. According to the CME FedWatch tool, the consensus is that the Fed will keep interest rates steady at 4.25%-4.50%, marking the fifth consecutive meeting with unchanged rates.
From both fundamental and technical viewpoints, recent data suggest a cautious outlook. Notably, non-commercial traders added nearly 40,000 long contracts last week, indicating bullish sentiment. Conversely, retail traders have reduced their positions, which could signal a potential shift in market dynamics.
The key question remains: where might be a strategic entry point if gold resumes its upward trend?
In the chart, I’ve highlighted two daily demand zones and a strong weekly demand area. There’s a possibility that the price may not revisit the weekly demand zone to accommodate new longs, instead triggering entry signals from one of the daily demand zones. I recommend adding these zones to your watchlist as potential entry points.
What are your thoughts? I look forward to your insights!
✅ Please share your thoughts about GC1! in the comments section below and HIT LIKE if you appreciate my analysis. Don't forget to FOLLOW ME; you will help us a lot with this small contribution.
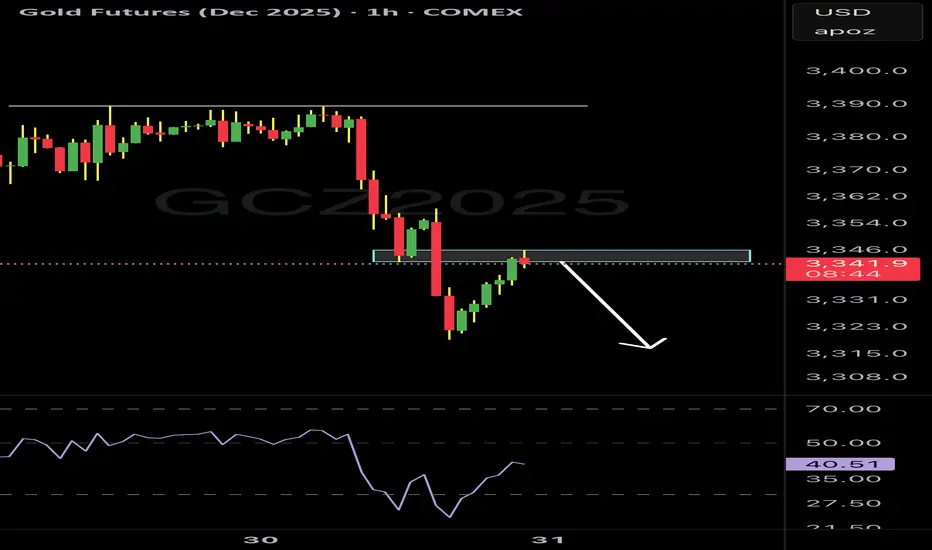
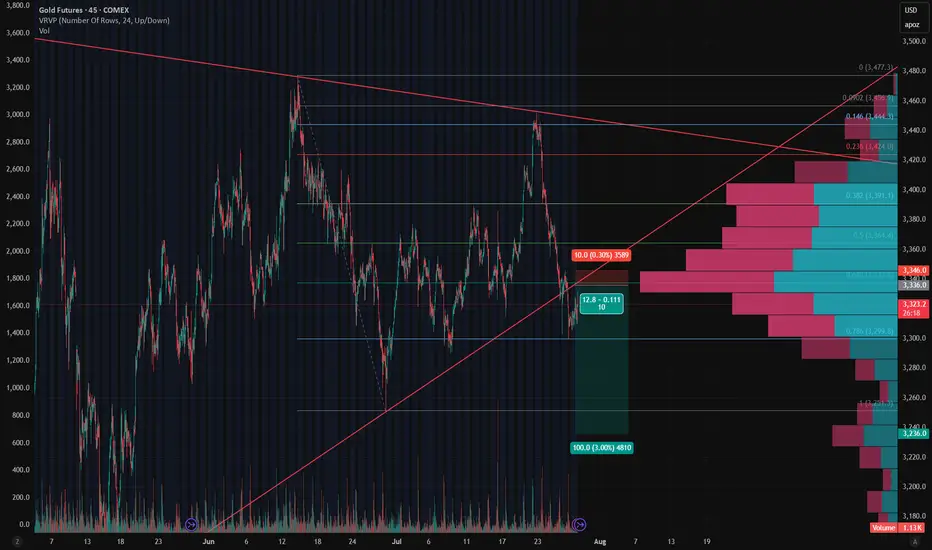
Gold - Short Setup Off Major Trendline Rejection📉 Gold - Short Setup Off Major Trendline Rejection
Gold has broken down through the rising trendline and is now retesting it — the moment of truth! 🧐
🔻 Short Entry: 3,336
🎯 Target: 3,236 (Fib 1.0 + HVN gap fill)
🛑 Stop: 3,346 (Above trendline retest)
⚖️ Risk/Reward: ~1:10
📊 Bonus: High volume node above adds resistance. Bearish volume profile structure confirms the breakdown bias.
Watching for volume to pick up on the move down. Let's see if GC bleeds into August. 🩸📆
Has gold Bottomed Out? Will the Bullishness continue from here?Looking for the bullish activity to continue from here but need to see a sweep and reject of the Previous daily Low before I want to get active. This would give confirmation that the price want to continue with this bullishness.

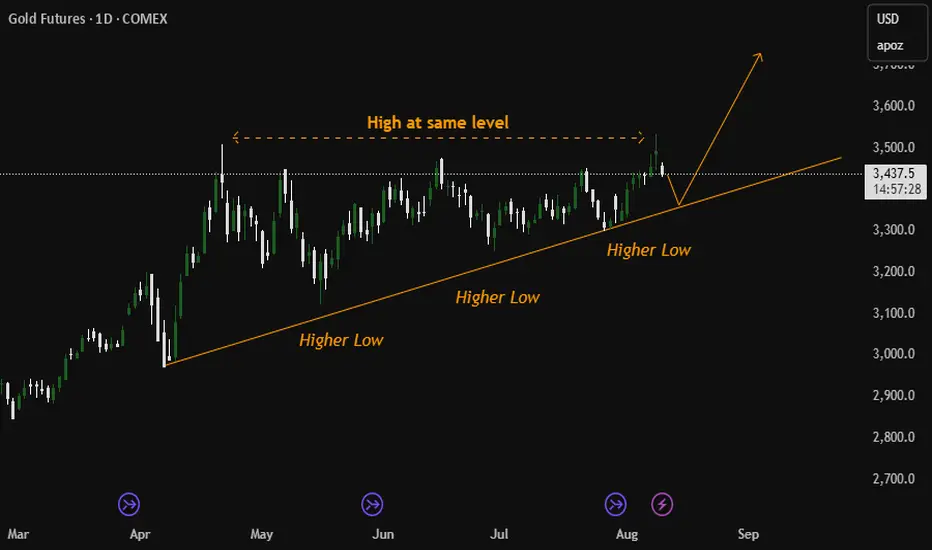
Gold Forms Triangle (Futures)Gold (Futures) contract appears to be forming a higher low pattern, with highs repeatedly testing the 3500 level. This indicates the formation of an ascending triangle. If the neckline breaks, the next upside targets would be 3572 and 3635. On the downside, a break below 3338 could lead to further declines.
Shorting GoldWell, it does looks like short needs to be shorted.
I mean on bigger timeframes, the price has been rejected and corrected hard from the 3,533 area. This also means that there is tons of liquidity that is waiting to be taken above that level.
So just to cut short the confusion, technically, once the price tapped into that level, it rejected and broke a bullish leg. So technically i would say that we are at least going to correct.
Also i have identified the area of interest with entry and targets.
Hopefully it goes through.
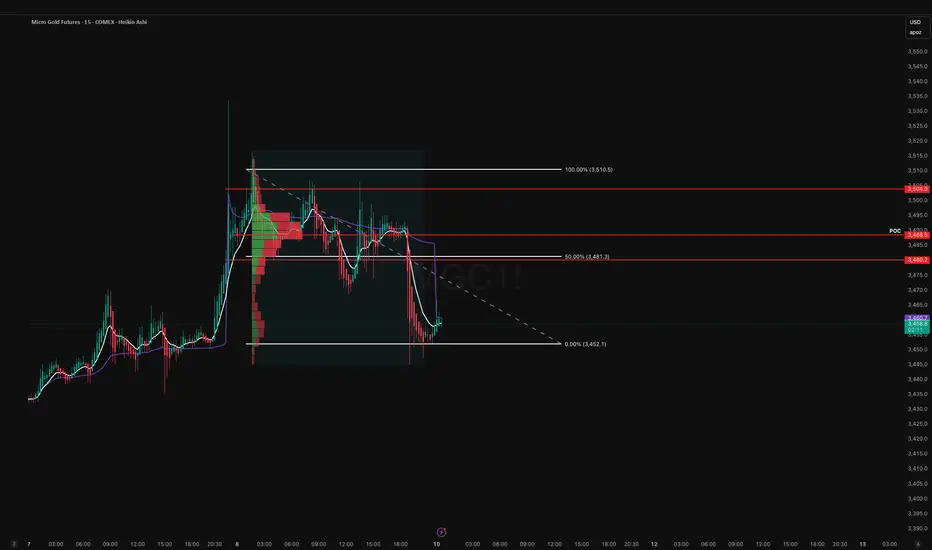
Tokyo Gold Fight Club. First Rule: Respect the POCGold is setting up for a clean Tokyo session play, and the chart structure couldn’t be clearer. We’re currently sitting just above the 0% Fib at 3,452.1, after a controlled rotation down from the Point of Control at 3,488.5. That POC is key it’s where the highest traded volume of the session sits, meaning it’s a true decision point for buyers and sellers.
The 50% Fib at 3,481.3 lines up with a low volume node, which often acts as a springboard or rejection zone depending on who’s in control. Above that, we have a tight resistance cluster the POC, the psychological level at 3,500, and the 100% Fib at 3,510.5 all stack together, creating a major liquidity magnet if price can rally into it.
My primary bias into Tokyo is bearish (around 65% probability) unless we see a decisive breakout above 3,500. The preferred short setup is a push into 3,480–3,490 that fails to hold, with stops above 3,500 to stay safe from any thin session spikes. In that case, I’m targeting the session low at 3,452.1 first, then 3,435 for the second scale-out, and finally 3,420 if sellers press the advantage.
The alternative scenario, with a 35% probability, is a clean break and hold above 3,500, which flips bias long. In that case, the upside play would be to enter on a breakout retest, with stops back under the POC at 3,488, targeting the Fib high at 3,510.5 first and then 3,525 as a stretch target.
Tokyo tends to give one of two plays in gold: either a low volume POC retest that rejects and runs in the prevailing direction, or a sharp reclaim of a key level that forces an aggressive squeeze. Until proven otherwise, I’m watching 3,480–3,490 as the battleground and planning to short rejection wicks there, keeping risk tight and targets clearly defined.
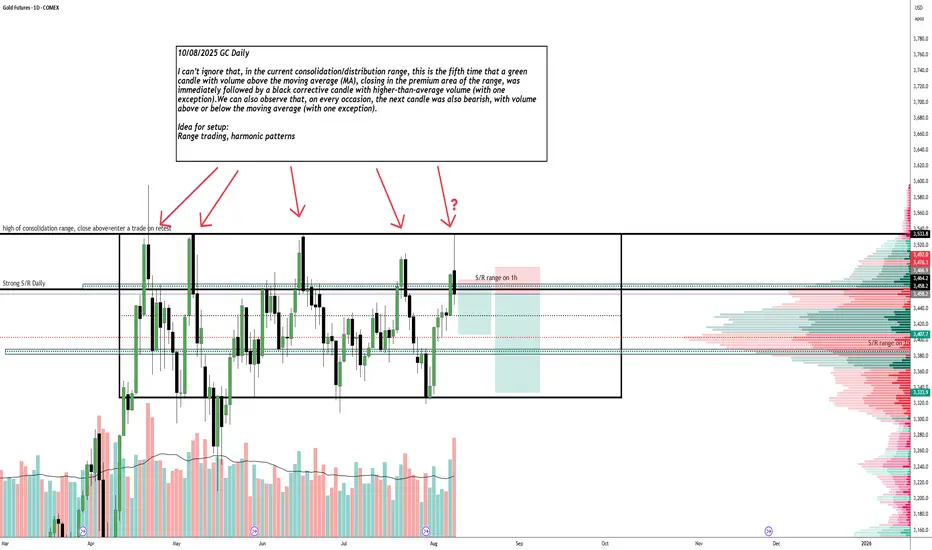
GC shortAs on Chart, failed breakout of the range
Daily range, price test the top of the range, it happened 4 time before, low of the range isn't weakening, to many news, it looks like noone is sure what will happen with economy and we are stuck in this range
Gold. Weekly Walkthrough. 10.08.2025,SundayCOMEX:GC1!
One-sided bullish expansion on Gold. Already outlined in the previous video

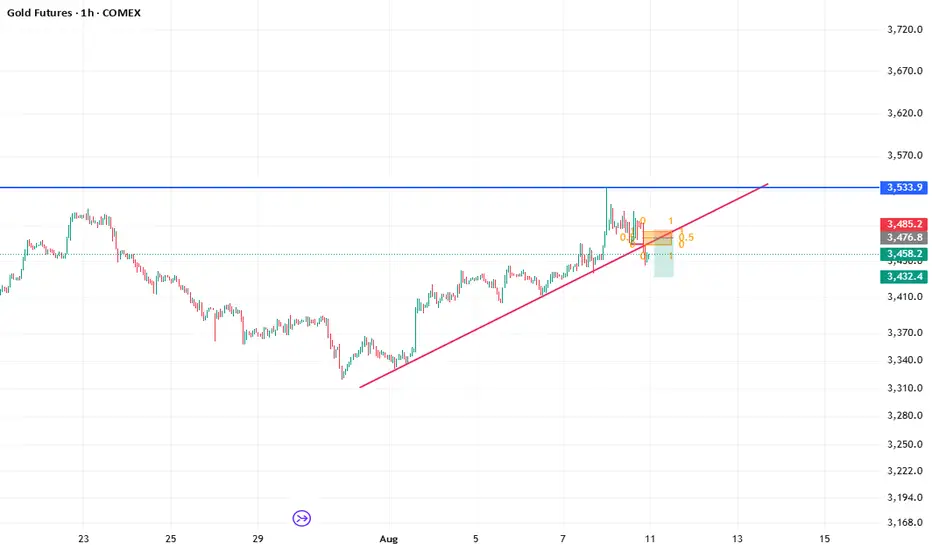
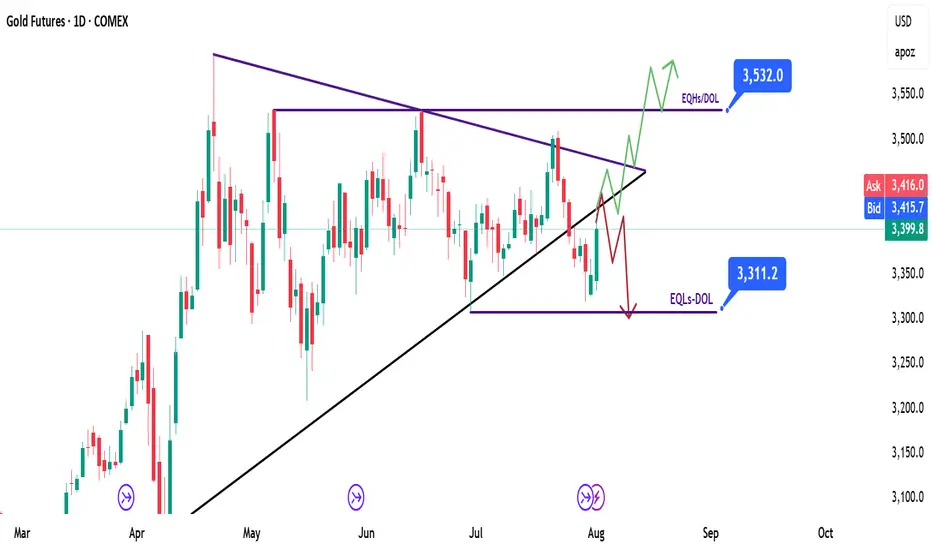
GOLD | XAU/GC - Weekly Recap & Gameplan - 03/08/25📈 Market Context:
Gold is currently trading within an accumulation zone as the market begins to price in a potential 0.25% rate cut by the Fed.
This macro expectation is supporting the broader bullish bias in the commodities market.
🧾 Weekly Recap:
• Price broke below the HTF bullish trendline — a key sign of weakness and potential structural shift.
• However, a sharp drop in the DXY (US Dollar Index) provided a bullish tailwind for gold, resulting in a mid-week bounce.
• This mixed action sets the stage for two potential outcomes next week.
📌 Technical Outlook & Game Plan:
I’m preparing for two possible scenarios:
1️⃣ Bearish Scenario (Red Path):
→ Price retests the broken trendline and rejects it
→ Continuation to the downside
→ Play: Short setup
2️⃣ Bullish Scenario (Green Path):
→ Price reclaims the broken trendline and closes above it
→ Continuation higher toward next resistance
→ Play: Long setup
🎯 Setup Trigger:
I will wait for a clear break of structure (BOS) on the 1H–4H timeframe to confirm directional bias.
📋 Trade Management:
• Stoploss: Below the demand zone (for longs) or above supply (for shorts) on the 1H–4H chart
• Target:
→ Bullish: $3,536
→ Bearish: $3,305
💬 Like, follow, and comment if this breakdown supports your trading! More updates, setups, and educational posts coming soon — stay tuned!
Gold’s weekly chart looks strong Gold futures has been teasing $3500 for a few weeks now and every time it gets to $3350 the shorts roll in and the buyers continue to show their strength.
If prices breaks above and maintains the $3475 support before the week ends; then we will see a strong run above $3500 next week.
Lastly, the EMA 20 & 50 as well as the RSI are all bullish on the 1hr, 4hr, and 1w timeframes.
Always remember the trend is your friend!

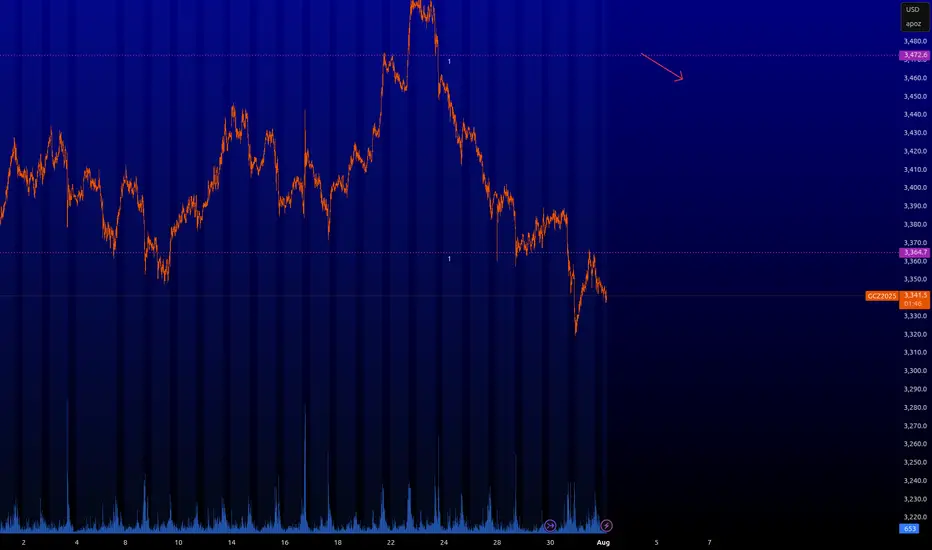
GC : Key levelsHere are the key levels that the market will be interested in. You can scalp from 3.472.
⚠️ VOLATILITY WARNING ⚠️
Trading around major news can be extremely unpredictable. Trade responsibly!
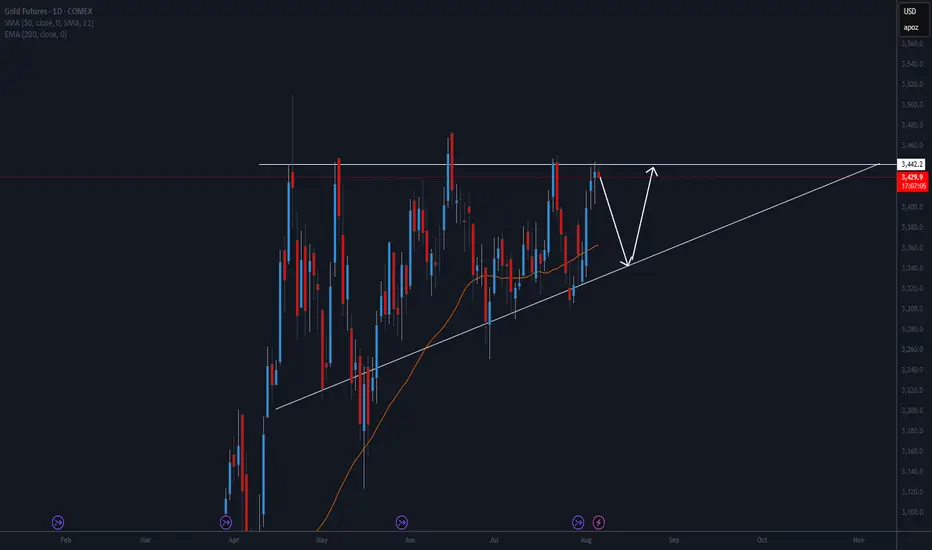
Potential breakout As we observe GC in the Daily timeframe, it's been consolidating in this sort of range for a while now. With the higher lows and 3442 level acting some sort of resistance, we may see some sort of breakout soon. If not, we can see it going back down and MAYBE creating another higher low
Gold Analysis On 4th Aug 2025As analyzed, the market took support at the accumulation zone and then moved in its original upward direction, reaching around 100,600. Currently, the market is still within the same zone. Further analysis will be done next Monday. Thank you all
Key Zone 100600

#GOLD #XAUUSD Seems to have ended the correction FX_IDC:XAUUSD Gold Spot might have completed the correction as a complex 3-3-5 FLAT, and is currently turning higher in wave (ii), however this get invalidated if THE LAST LOW OF 3268.19 BREAKS. Till the pivot 3268.19 stays strong, the move should be impulsive and take us to new high near term.

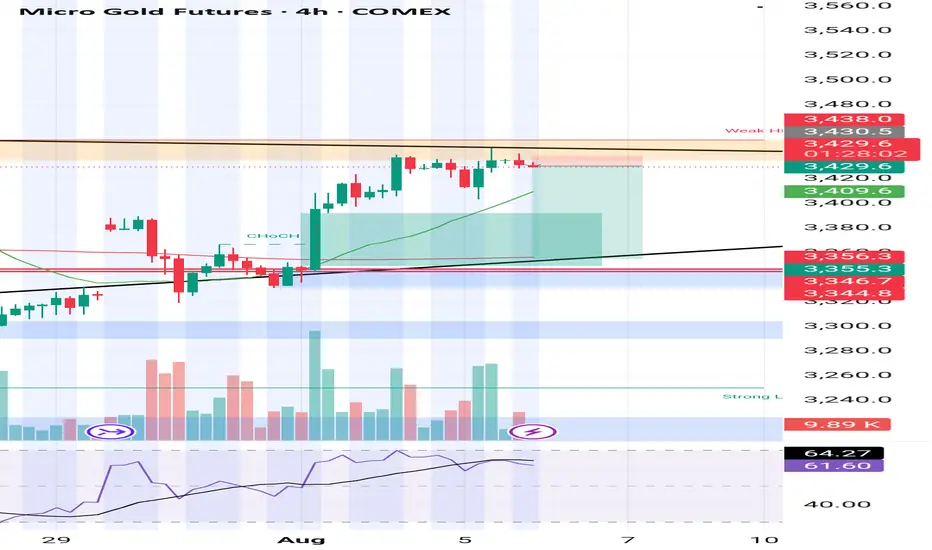
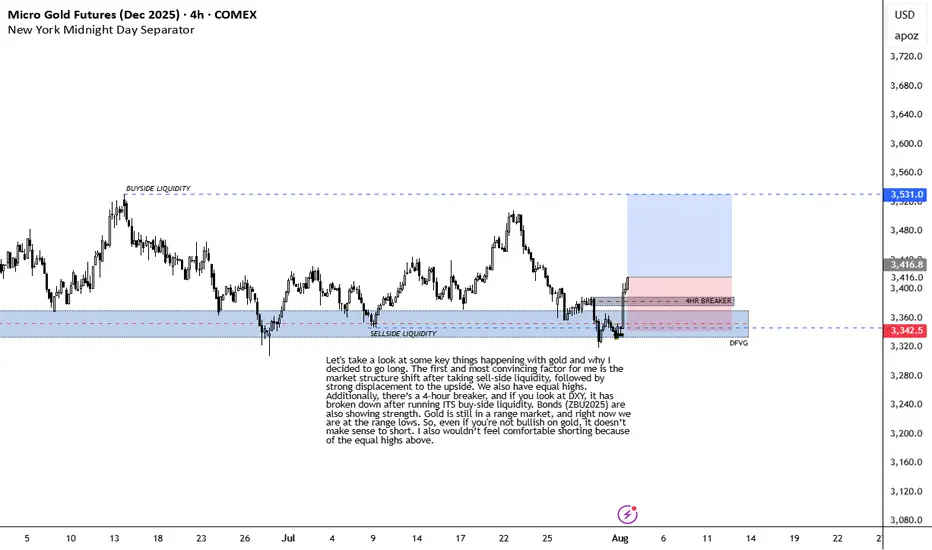
BULLISH ON GOLDLet's take a look at some key things happening with gold and why I decided to go long. The first and most convincing factor for me is the market structure shift after taking sell-side liquidity, followed by strong displacement to the upside. We also have equal highs. Additionally, there’s a 4-hour breaker, and if you look at DXY, it has broken down after running ITS buy-side liquidity. Bonds (ZBU2025) are also showing strength. Gold is still in a range market, and right now we are at the range lows. So, even if you're not bullish on gold, it doesn’t make sense to short. I also wouldn’t feel comfortable shorting because of the equal highs above.
INVALIDATION IS RECENT 4HR LOW.
Gold Futures Super Strong Resistance - Price Coming Back StrongGold Future has been very strongly pushing up without filling any gapes in the short side before pushing up more further.
One unique line is probably the target super strong resistance.
In a daily chart, probably better wait until it reaches that point to try to check for strong short entries maybe.
Still arriving there it would explode up even more further to transform that line into a super strong probable support.
Keep watching!
(Do we actually have to believe that gold is secretly targeting $10,000) in the Yearly Chart?... Since February 2022 it just went berserk!)

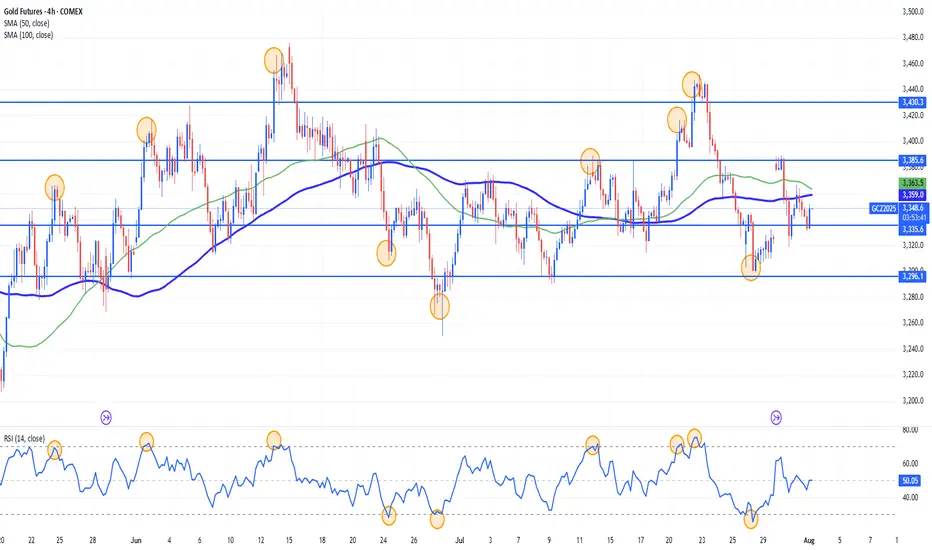
Gold Range-Bound and Ripe for Mean Reversion Plays?Gold has been locked in a sideways, range-bound regime for months, largely oscillating between the 3400 and 3160 levels. This lack of clear directional trend stems from conflicting fundamental forces: on one hand, sticky inflation and resilient U.S. data have bolstered the U.S. dollar and yields, weighing on gold. On the other, global growth concerns and geopolitical tensions continue to underpin demand for the metal as a safe haven. The push and pull of these opposing themes has created an environment of indecision and choppy price action.
While long-term investors may find this frustrating, range traders and mean reversion strategies are thriving. With technical boundaries so well-defined, short-term oscillations within the range are offering repeated opportunities for disciplined entry and exit.
Currently, XAUUSD is trading just under the 3296 level after a recent rejection from the 3350s. The bearish structure suggests a potential leg down toward the 3160–3180 support zone. However, absent any major economic surprises or geopolitical shocks, this could merely be another deviation from the mean rather than a true breakdown. Indicators like RSI and Stochastic Oscillator are already hinting at early signs of bullish divergence.
If price holds above or near 3160, the setup for another mean-reversion trade back toward the mid-range (around 3296 or higher) could unfold. In the current environment, fading extremes rather than chasing trends remains a strategy of edge, as depicted by the 14 period RSI.
Gold’s Compression Coil Looks Ready to DetonateMGC continues to reject the 50% Fibonacci retracement level from the $3,386.5 swing high, currently trading at $3,347.3. Price has now spent multiple candles trapped under this level, unable to reclaim $3,355, with clear upper wicks and no bullish follow-through.
This is classic midday NY session compression, often setting up a late-day directional move. All signs currently point to continuation lower toward $3,306.2, completing a textbook measured move.
Staakd Probability Model
Based on historical setups where MGC pulls back to 50% and stalls mid-NY:
Scenario Probability
- Continuation down to $3,306.2 68% High-probability path if $3,347 breaks
- Sweep to $3,355–$3,360 before drop. 26%. Possible liquidity grab
- Break and hold above $3,360 6% Invalidation of the short idea
Key Levels
Level
- 100% Fib High $3,386.5 - Swing high
- Supply Zone $3,347–$3,355 - Rejection area + equilibrium zone
- Current Price $3,347.3 - Compression below fib midpoint
- Target Zone $3,306.2 - Measured move / demand structure
- Invalidation $3,360.0+ - Break above this invalidates the short
Trade Idea (Pending Trigger)
- Bias: Bearish
- Entry Zone: $3,345–$3,350
- Target: $3,306.2
- Invalidation: Above $3,360
- Reward-to-Risk: 2.2R–2.5R depending on entry execution
This is shaping into a high-probability continuation setup. NY session has done the heavy lifting: a weak bounce, heavy rejections, and no reclaim of structure. Unless we see a sudden reclaim of $3,355 or a spike in late NY volume, this looks ready to break and expand lower. Keep it simple. Trust the structure. Let price walk itself to the target.

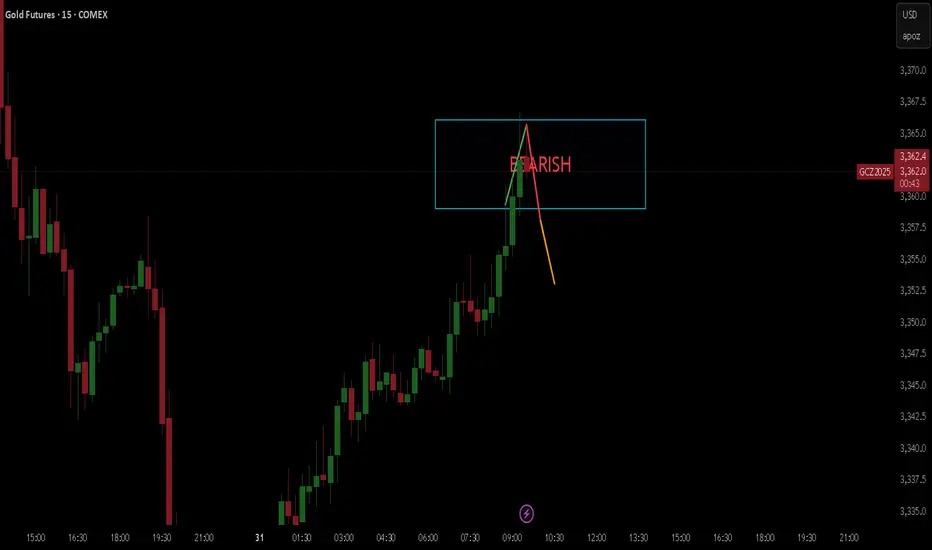
GOLD BEARISHHello,
I hope you are well.
I have an excellent opportunity for you on gold.
I see a 90% chance that gold will start to fall, so get your strategies and money management ready!