ABB📊 ABB Ltd (OMXSTO) – Technical Analysis
🔹 Overall Trend
• The long-term trend is bullish.
• Price is moving inside an ascending channel.
• Higher highs and higher lows are still intact.
⸻
🔹 Moving Averages (EMA)
• EMA 9: Short-term momentum, price is currently testing it.
• EMA 50: Acting as dynamic support.
• EMA 200: Well below price → confirms strong long-term uptrend.
As long as price stays above EMA 50 & EMA 200, the bullish structure remains valid.
⸻
🔹 Fibonacci Levels (Key Zones)
Important Fibonacci retracement levels visible on the chart:
Support zones:
• ≈ 58.8 – 56.8 → 0.236 Fib (major support)
• ≈ 53.5 – 52.0 → EMA 50 + Fib overlap (strong support)
• ≈ 49.0 – 46.5 → deeper correction zone (trend still bullish if held)
Resistance zones:
• ≈ 64.5 – 65.0 → recent high / Fib 0
• ≈ 68 – 70 → upper channel resistance
⸻
🔹 RSI (14)
• RSI is around 50–55
• This shows neutral momentum
• No overbought or oversold condition
• Healthy for a continuation after consolidation
⸻
🔹 MACD
• MACD is flat to slightly negative
• Indicates short-term consolidation
• No strong bearish divergence visible
• Momentum can turn bullish again if price holds support
⸻
🔹 Pattern & Price Action
• Price is consolidating near the upper half of the channel
• This looks like a bullish flag / correction within an uptrend
• Blue arrows suggest a possible pullback → continuation move
⸻
🔮 Scenarios
✅ Bullish Scenario (Preferred)
• Price holds above 56–58
• Bounce from EMA 50
• Targets:
• 64.5
• 68
• 70+ (upper channel)
⚠️ Bearish / Correction Scenario
• Break below 56
• Next supports:
• 53
• 49
• Even a drop to 49 would still be a healthy correction, not trend reversal
⸻
🧠 Conclusion
• Trend: Bullish
• Current phase: Consolidation / pullback
• Bias: Buy on dips, not chase highs
• Best entries are near EMA 50 & Fib supports
⸻
⚠️ Disclaimer
This analysis reflects only my personal technical view. I have no responsibility for your buy or sell decisions. Please manage your own risk and confirm with your own strategy.
ABB Ltd. TEMP
No trades
Market insights

ABB - much needed consolidationABB - after years of steady rise it is time to correct the wave 3 (red count)
This will give investors who believe in the company a good opportunity to get more shares at a discount price.
I predict that at around 440 - 500 SEK the stock will continue to rise in valuation with a potential of about 50% increase before starting the next correction (wave 4) as part of the green wave degree.

ABBN - CHF | Chart & Forecast SummaryKey Indicators on Trade Set Up in General
1. Push Set Up
2. Range Set up
3. Break & Retest Set Up
Active Sessions on Relevant Range & Elemented Probabilities;
* Asian(Ranging) - London(Upwards) - NYC(Downwards)
* Weekend Crypto Session
Trend | Time Frame Conductive | Daily Time Frame
- General Trend
- Measurement on Session
* Support & Resistance
* Trade Area | Focus & Motion Ahead
# Position & Risk Reward | 15 Minutes Time Frame
- Measurement on Session
* Retracement | 0.5 & 0.618
* Extension | 0.88 & 1
Conclusion | Trade Plan Execution & Risk Management on Demand;
Overall Consensus | Buy


ABBN - ShortABB broke the lower boundary of the trend channel. Rebound to the channel possible with target in the marked resistance area
________
🚀 Follow for daily posts
🎯 About my posts: They are kept self-explanatory in order to avoid overcomplicating and confusion. Mostly price signals and trend analysis combined with chart patterns.
Disclaimer: This is not an investment advice

ABB of SwedenABB went sideways in a wedge pattern since 2009 and broke out to the upside in February of 2021. The stock is in a strong upward trend and is showing confirming downward/sideways flag patterns. After the recent breakout to a new all time high (ATH) the strong trend is likely to continue and the stock seems to be going through a fundamental reevaluation by the market which seems to have discovered the potential of the company, which is operating among other things in the automation and robotics segment.


ABB LTD - BUY ABB LTD has recently touched a very solid support. Right now, there is a beautiful buy opportunity.
The target is shown with an arrow.


ABB looking for buy entryABB is of interest because fundamental analysis says it could reach SEK 244,-
However, at the moment it doesn't seem to have enough power to break through the overhead resistance just yet.
On the 4h chart we have clear divergence between the price action and the RSI, AND we have declining volume. All indicators of a unsustainable trend. In the process it seems to be forming a bearish rising wedge as well.
So price should retest support below (190-193) and fill the gap at 196 in the process.
Then the longer term upward trendline will provide support as well, hopefully giving ABB enough power to break the resistance at the next try.

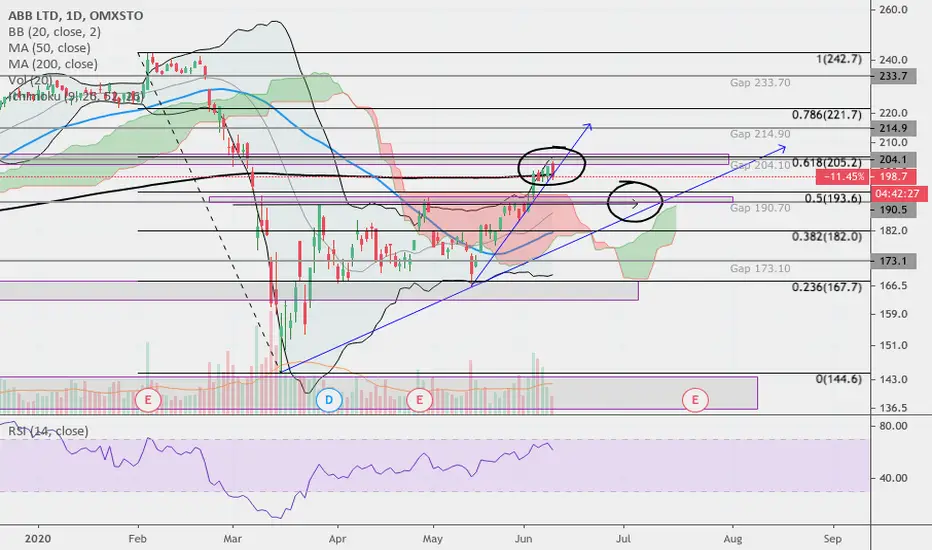
ABB buying opportunityAs analysts are giving ABB a target of around 240, I am looking for a buying opportunity.
At the moment ABB might be rejected at the current resistance area around 202-206. This resistance also represents the 0.618 fib retrace of the 'corona dump'. The trendline (blue) is still holding, but if it breaks a retrace is to be expected.
THEN I'll be looking at a buying opportunity around 190-192.5 as there is a confluence of support there; the upward trendline (blue), horizontal support (purple/gray zone) and we have a gap still to be filled there at 190.60.


5th test, is it one more upside ?ABBN, the support has hold 4 times already. We are one the 5th time and it seems that buyers are coming.
Validation if we end the week above the support. We will have the answer friday at the closing bell.
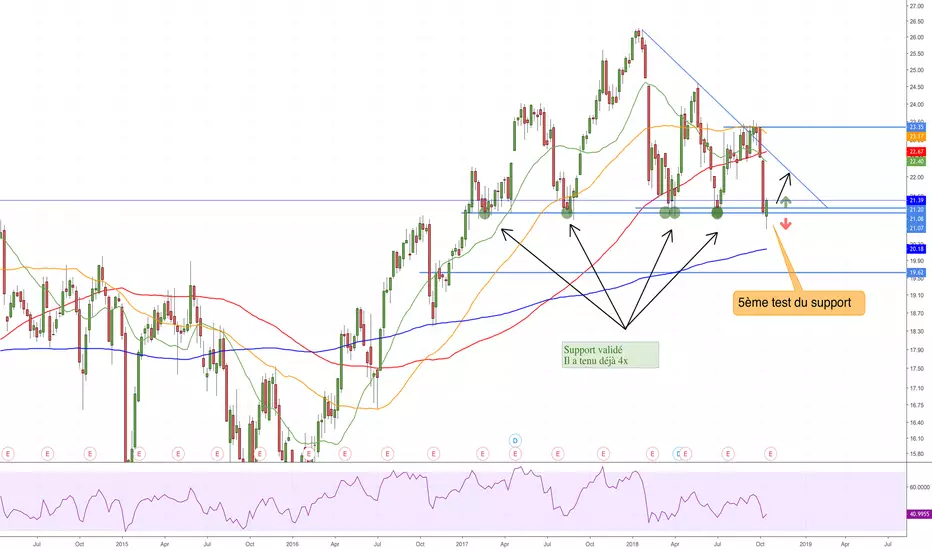
ABB 60min - Looks more upsideABB looks like it wants to go up some more. Don't buy until ut proves it wants to go up and that is if it breaks the falling trendline in yellow. Make sure you have a working strategi for breakouts before you pull the trigger.
