Buys or Sells1)Bullish Trend
2)Break of Structure
3)Above 50Moving Average.
I see a bullish start of the week for most markets, but very well could go to the downside to continue a very uncharacteristic 4th quarter. I believe fundamentals will play a huge part in trading decisions through the holiday season for most traders. I'm thinking about not trading at all the market is looking choppy.
Market insights

US100 Technical Analysis! SELL!
My dear followers,
I analysed this chart on US100 and concluded the following:
The market is trading on 25404 pivot level.
Bias - Bearish
Technical Indicators: Both Super Trend & Pivot HL indicate a highly probable Bearish continuation.
Target - 25303
Safe Stop Loss - 25465
About Used Indicators:
A super-trend indicator is plotted on either above or below the closing price to signal a buy or sell. The indicator changes color, based on whether or not you should be buying. If the super-trend indicator moves below the closing price, the indicator turns green, and it signals an entry point or points to buy.
Disclosure: I am part of Trade Nation's Influencer program and receive a monthly fee for using their TradingView charts in my analysis.
———————————
WISH YOU ALL LUCK
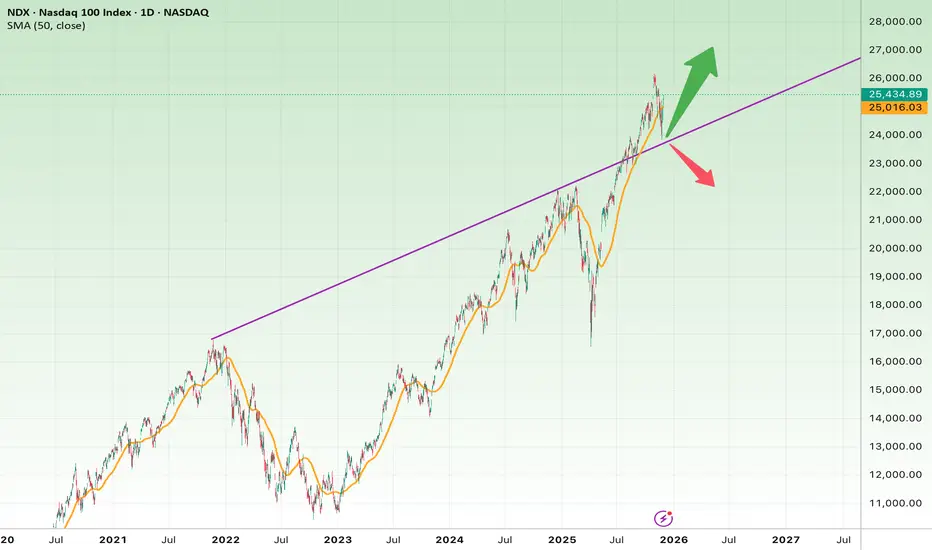
Nasdaq 100 (NDX) – Daily Chart AnalysisThe chart shows that the Nasdaq 100 has been in a strong multi-year uptrend from 2023 to 2025 and is now touching a major long-term ascending trendline (purple line).
This is one of the most critical decision zones for the index.
Bullish Scenario (More Likely at the Moment)
Price is currently holding above the long-term trendline and is also trading above the SMA50 (orange line), which still has a positive upward slope.
If the price continues to respect this trendline:
Bullish Targets
• 26,600
• 27,200
• 28,000 (major upside target)
Signals that strengthen the bullish case:
• A breakout above the previous high near 25,900–26,000
• Strong closing candles above the trendline
• Increasing bullish volume
Bearish Scenario (If the Trendline Breaks)
If the index breaks below the ascending trendline and then loses the SMA50, it could enter a broader corrective phase.
Bearish Targets
• 23,800 – first major support
• 22,500
• 20,800 – key structural support
Bearish confirmation signs:
• A strong breakdown candle below the trendline
• Failure to reclaim the SMA50
• Weak or failed retest (pullback) of the broken trendline
Logical Stop-Loss Zones
• Long positions: Below 24,600
• Short positions: Above 25,900
Quick Summary
• NDX is sitting right on a major long-term trendline.
• Bullish scenario remains stronger as long as the trendline holds.
• Breaking the trendline would likely trigger a deeper correction.
• Holding above it could push price toward 27K–28K.
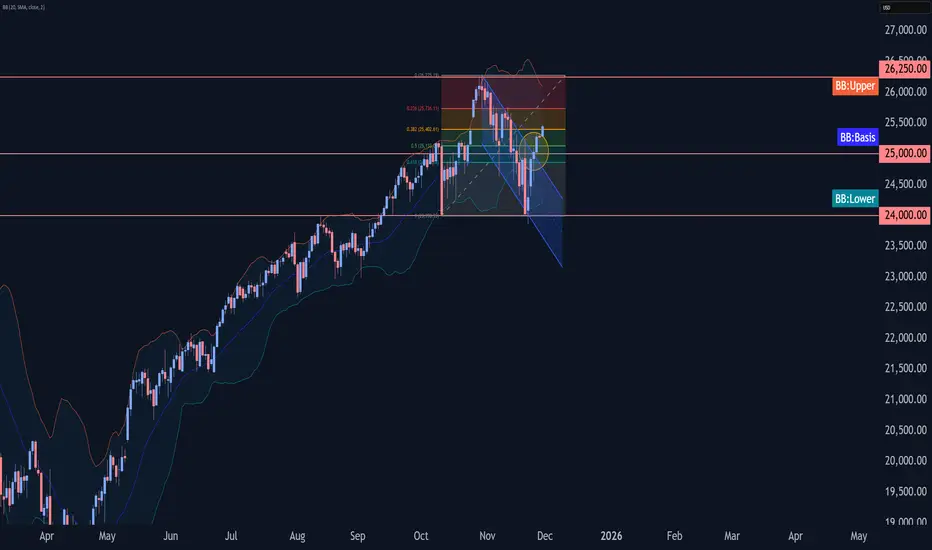
Hanging man monthly candleIf we draw fib from November 2021 peak to October 2022 bottom we can see strong reaction from 1.272 and 1.618 levels. The next important fib is 2.618 at 27000 level, so many people may expect Nasdaq to reach that level and get some correction from there. But it can fail to reach it.
We just got a solid hanging man candle on November close. We may see a higher high on S&P500 and a lower high on Nasdaq in December - just like in 2021.

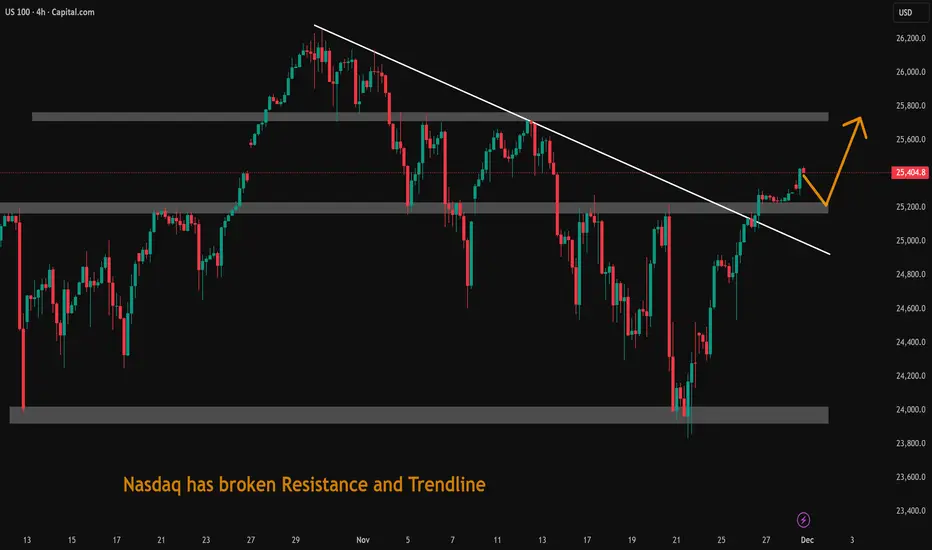
Nasdaq has broken Resistance and TrendlineNasdaq has broken Resistance and Trendline. US economy is doing well. Uptrend may continue.
Nasdaq-100 Wave Analysis – 28 November 2025
- Nasdaq-100 broke resistance zone
- Likely to rise to resistance level 0.3000
Nasdaq-100 index recently broke the resistance zone between the round resistance level 25000.00 and the resistance trendline of the daily down channel from October (which encloses the previous primary ABC correction 2).
The breakout of this resistance zone accelerated the active short-term impulse wave 1 of the intermediate impulse wave (1) from November.
Given strong daily uptrend, Nasdaq-100 index can be expected to rise to the next resistance level 26250.00 (former top of wave (5) from October).
US100 Bullish Bias! Buy!
Hello,Traders!
US100 is expanding from the demand zone after a clean mitigation and a shift in structure, with liquidity resting above the recent swing highs. Market is poised to draw toward the next premium target as inefficiencies get filled. Time Frame 5H.
Buy!
Comment and subscribe to help us grow!
Check out other forecasts below too!
Disclosure: I am part of Trade Nation's Influencer program and receive a monthly fee for using their TradingView charts in my analysis.

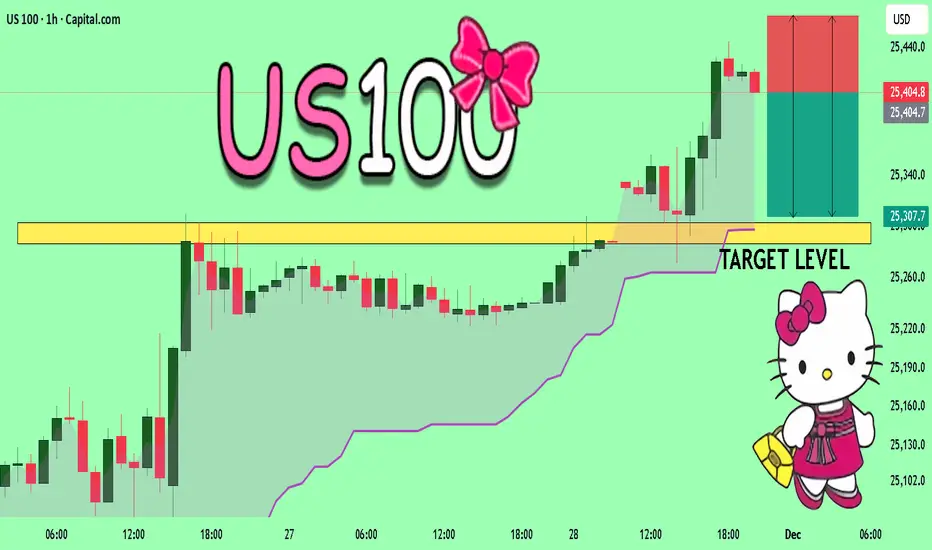
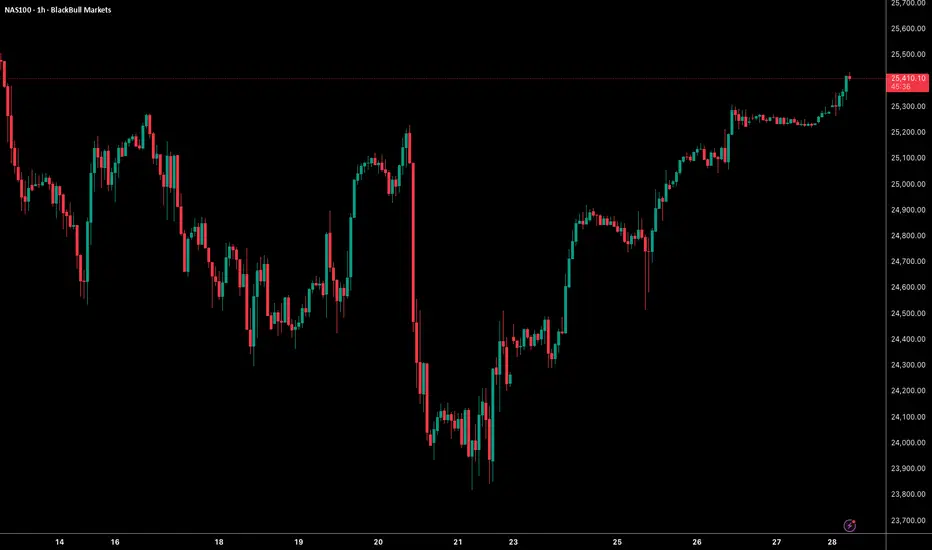
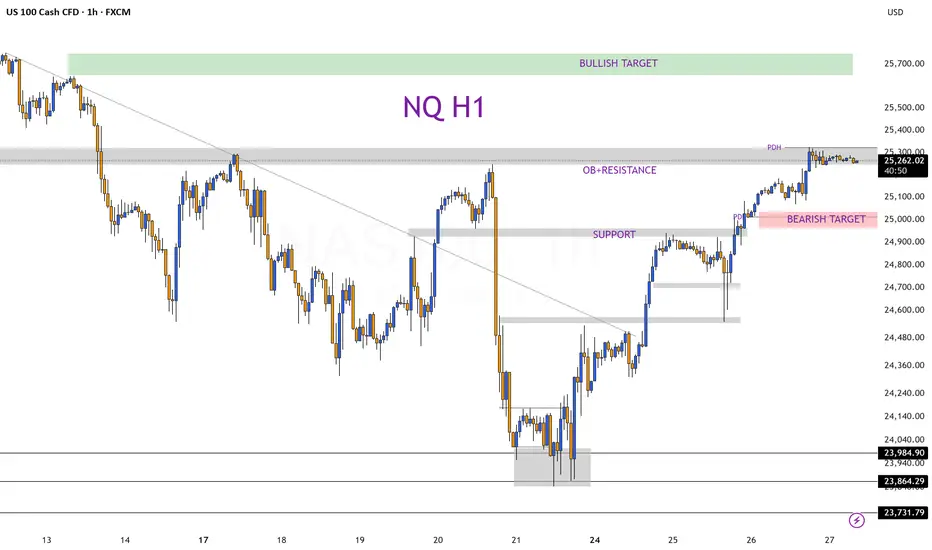
NAS100 – Quick Technical OutlookNAS100 continues its strong rebound after the sharp drop from the 21st. Price has now broken above the 25,350 level, showing sustained bullish momentum with higher highs and higher lows forming throughout the week.
If buyers maintain control, the next resistance sits around 25,500–25,550. A failure to hold above 25,300 could trigger a pullback toward 25,150 before any continuation.
Momentum favors the upside as long as structure remains above the recent breakout zone.
NSDQ100 head into Thanksgiving on a strong noteUS markets head into Thanksgiving on a strong note, with the S&P 500 rising for a fourth straight session (+0.69%) and now sitting just over 1% below its record high. The index has delivered its biggest four-day rally (+4.19%) since the US-China trade truce in May, driven by growing expectations of another Fed rate cut in two weeks and supported by resilient US data.
Trading was disrupted after a technical failure caused a major outage at the Chicago Mercantile Exchange, halting futures and options activity—including Treasuries and S&P 500 futures—and affecting other platforms such as EBS in FX.
Elsewhere, oil is on track for its worst monthly performance since 2023, and equity momentum faded into month-end as markets contended with volatility and concerns around Fed policy and a potential AI-driven bubble.
On the political front, President Trump escalated rhetoric on immigration following the fatal shooting of a National Guard member, proposing drastic restrictions including a pause on admissions from “third world” countries and revoking some naturalized citizenships. He also increased tensions with South Africa, saying he would bar the country from next year’s G20 summit in Miami—a move that breaks established protocol.
With limited news expected on Friday, markets head into the final stretch of November after a turbulent month for global equities.
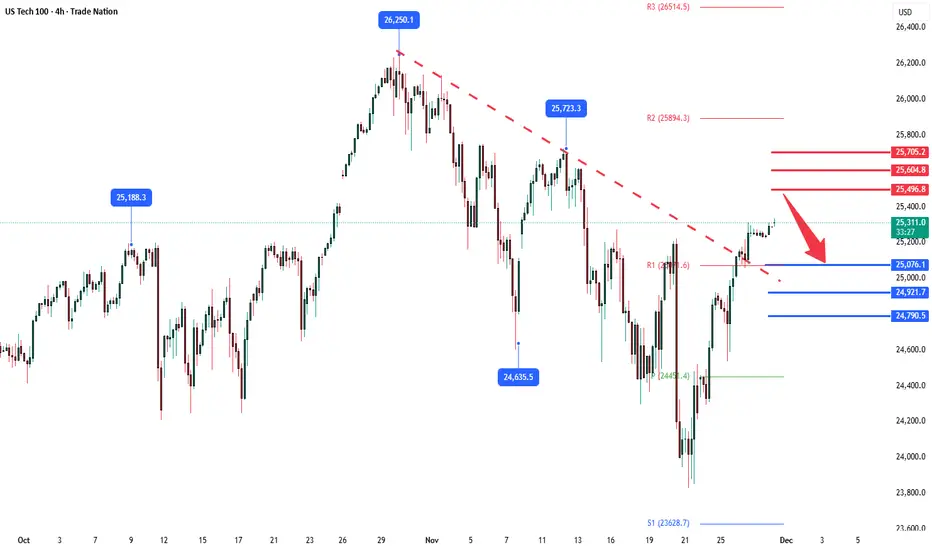
Key Support and Resistance Levels
Resistance Level 1: 25496
Resistance Level 2: 25600
Resistance Level 3: 25700
Support Level 1: 25076
Support Level 2: 25920
Support Level 3: 25790
This communication is for informational purposes only and should not be viewed as any form of recommendation as to a particular course of action or as investment advice. It is not intended as an offer or solicitation for the purchase or sale of any financial instrument or as an official confirmation of any transaction. Opinions, estimates and assumptions expressed herein are made as of the date of this communication and are subject to change without notice. This communication has been prepared based upon information, including market prices, data and other information, believed to be reliable; however, Trade Nation does not warrant its completeness or accuracy. All market prices and market data contained in or attached to this communication are indicative and subject to change without notice.
NAS100 Trade Set Up Nov 28 2025Price remains bullish making HH/HL on the 1h. I will want to see a tap in the 4h gap followed but 1m-5m IFVG/CISD to continue higher BSL

Has the Nasdaq’s Downtrend Ended?Recently, U.S. indices witnessed declines exceeding 5%, driven by reduced expectations of an interest rate cut in the Federal Reserve’s December meeting, the key catalyst influencing market sentiment and the movement of U.S. indices.
However, the Nasdaq rebounded this week, breaking above the 25,221 level and forming a higher high, indicating a shift in trend from bearish to bullish.
The latest gains are supported by renewed expectations of a December rate cut with an 80% probability, in addition to investors buying the dip as part of their long-term investment strategies in the artificial intelligence sector.
On the technical side, if the price pulls back for a correction, it may rebound again from the 24,148 level to target 24,962 as a first medium-term target.
However, a decline below 23,830, along with forming a lower low on the 4-hour timeframe, would invalidate the bullish scenario and signal a return to a downward trend for the Nasdaq.

US100: Bullish Breakout Confirmed, But...US100: Bullish Breakout Confirmed, But a Healthy Pullback Is Needed
I would like to see a correction before buying US100
US100 has recently confirmed a Descending Broadening Wedge breakout, a pattern that typically signals the resumption of a strong bullish trend.
However, we are still in a low-liquidity moment, which often causes unpredictable spikes and pullbacks. For that reason, I prefer to wait for a correction before entering long positions, rather than chasing the price at the current levels.
For traders who believe US100 could continue upward immediately, long-expiration CALL Options may be a safer alternative.
These options help reduce the impact of intraday volatility and erratic movements caused by the thin market conditions.
Key Resistance Levels to Watch
25,715
26,165
27,000
27,500
You may find more details in the chart!
Thank you and Good Luck!
❤️PS: Please support with a like or comment if you find this analysis useful for your trading day❤️

Heading into a 2026 bear market ? Tracking NDX, SPX and NIKKEII just want to track the major indices over the next couple of months. There are some signs that could point to a potential major market top around October 30th 2025.
Looking at big US tech, the development of the stock prices over the last 7 months are what you would usually expect in many years. And the market did that despite all the political uncertainty and chaos caused by Washington street. So fundamentals and news don't matter that much.
I'll stick to simple charts without any fancy indicators.
Here is the first one of NDX (US100). Many traders where quite surprised by the move since last Thursday, myself included. But looking at this chart, it makes a lot of sense. Might get invalidated tomorrow, we will see.

NASDAQ (US Tech 100) Price swept liquidity below a weak low, tapped into demand, and printed a bullish CHoCH, suggesting buyers are stepping in.
🟢 BUY Bias
Price is reacting from a discount zone + demand after a liquidity sweep. As long as we stay above the demand area, bullish targets remain valid.
🎯 Targets
TP1: 25,300
TP2: 25,600
TP3: 25,700+ (Liquidity at Strong High)
🔐 Stop-Loss: below 24,080 (beneath demand & sweep)

Pre market analysis for NAS 27/11/2025No strong set ups showing pre market. Leaning towards a Bullish move. Price comes down after open, tests the previous H4 origin on the topside, deep dives to the Hourly, then bullish move to the H1 polarity above.
Bearish case. Price taps into the hourly break level at the top of the current range before moving down

Nas 100 ready to buy zone Nas 100 ready to buy zone
Entry ( 25240 )
TP 1 ( 25280 )
TP 2 ( 25320 )
SL ( 25220 )

USNAS100: 24760–24880 Range Controlling the MarketUSNAS100 | Technical Overview
U.S. stock index futures slipped slightly on Tuesday, cooling after a strong tech-led rally in the previous session.
Investors remain cautious as they await upcoming economic data and earnings releases that will offer clearer signals on the strength of U.S. consumer spending and overall market resilience.
Technical Outlook
The Nasdaq is currently consolidating between 24760 and 24880, awaiting a decisive breakout.
Bearish Scenario:
A 1H close below 24760 will activate a bearish leg toward 24575, and a break below that level opens the way toward 24365 and potentially 24150.
Bullish Scenario:
A 1H close above 24910 will confirm bullish continuation toward 25210, with further upside potential toward 25420.
Pivot Line: 24760
Support: 24575 · 24365 · 24150
Resistance: 25210 · 25420

Nas Perspective Based on how Nasdaq is playing around withing the 30- and 15-minutes range it gives a strong signal of an upcoming strong expansion. with this idea it is much safer to trade it once it breaks out of the accumulation range. Alot of factors are playing part and will contribute to the expansion of price, expected the beginning of DECEMBER 2025 . Trading wise, I would be marking my ranges off one 15 minute candle or off 5 minutes ranges, mostly targeting Longs.

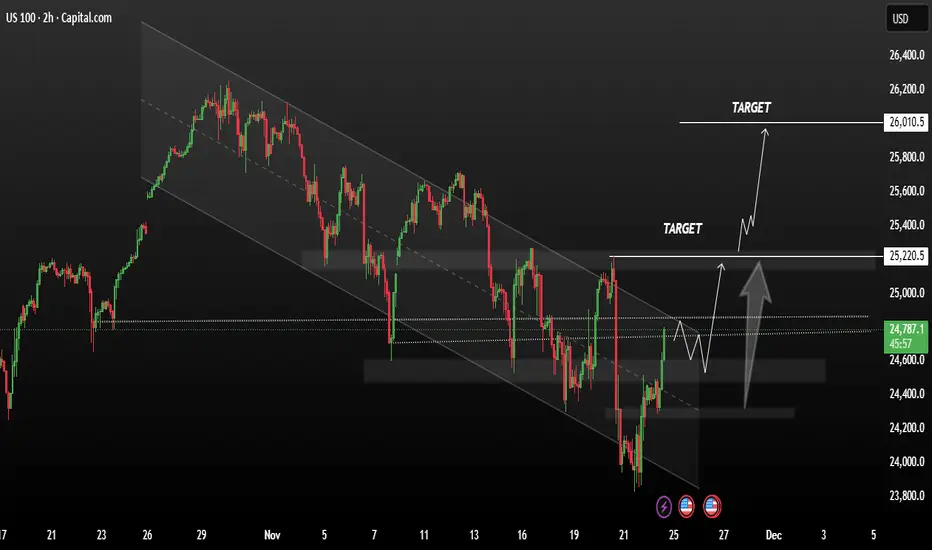
USNAS100 maintains current bullish momentumUSNAS100 moved higher on Monday, driven by gains in mega-cap stocks. Growing expectations of a potential Federal Reserve rate cut in December supported bullish sentiment, while investors monitored fresh economic data for signals on the central bank’s next policy direction.
If the index maintains its current bullish momentum, the market structure suggests a potential continuation to the upside. In the short term, we could see price movement toward the resistance zone between 25,220 and 26,010, where bullish reactions may occur if buyers remain in control.
You may find more details in the chart,
Trade wisely best of Luck Buddies,
Ps; Support with like and comments for better analysis Thanks for Supporting.
Nasdaq Outlook – Accumulation, Early Close & Two Key ScenariosThe Nasdaq is repeating yesterday’s market structure: Asia has accumulated once again, and London is likely to provide the manipulation phase before setting the day’s direction. Today we must also factor in reduced liquidity, as the New York session will close early due to Thanksgiving—this typically increases intraday volatility and can exaggerate moves in either direction.
Technical Setup:
Price is consolidating tightly, showing clear signs of preparation for a breakout. The bullish momentum remains intact as long as the index holds above the 25,000 region, supported by expectations of a potential Fed rate cut in the coming weeks, which continues to fuel risk-on sentiment across equities.
Scenario 1 (Most interesting):
If price breaks the current accumulation to the downside, I will look for long entries in the 25,090–25,020 zone, aiming for a continuation of the bullish rally.
Scenario 2:
If price breaks upward directly from the range, the next bullish target sits around 25,600.
SP:SPX TVC:DXY TVC:VIX CAPITALCOM:US100
NAS100 LONG SETUP These pair previously banged our sl with a temporary breakout of the uptrend channel. Now the price is back on the uptrend, safe entries above 25.217

NAS100 Trade Secured 1500 PipsTrade played out perfectly, trading above PDH, broke structure to the upside, came down to sweep SSL then engulf and CISD on the 5m-15m to target BSL and higher fib levels

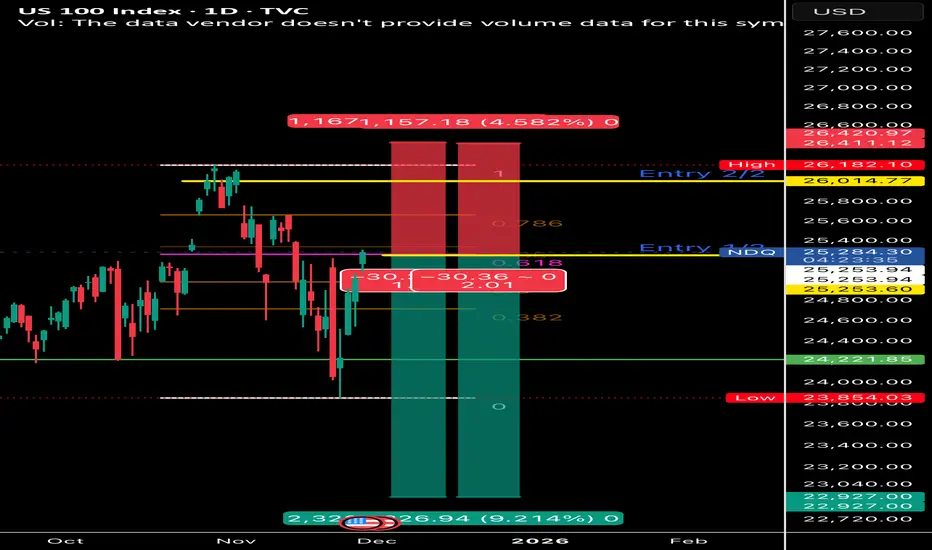
Short **Hedge** Predicting the double top on NDQ.Predicting the double top on NDQ.
I have longed a couple of assets i have been eying for a while during the correction at a good price, so this short is part of a hedging strategy I am taking.
2 entries, first (1/2) at fib 0.618 (reversed) the second (2/2) aiming for a double top.
My thought logic is like that:
If I fail to predict the double top on NDQ than my longs will most likely be much more profitable than my short.