NASDAQ: Bears In Control! Sell it!Welcome back to the Weekly Forex Forecast for the week of Aug 4 - 8th.
In this video, we will analyze the following FX market:
NASDAQ (NQ1!) NAS100
The NAS 100 was weakened by bad job numbers, mixed earnings reports, and tariff wars. In the short term, it is bearish. Sell it down to the Weekly/daily +FVG for high probability buys from those levels.
Buying at current levels is not advised. Wait for a valid market structure shift to the upside before going long.
Enjoy!
May profits be upon you.
Leave any questions or comments in the comment section.
I appreciate any feedback from my viewers!
Like and/or subscribe if you want more accurate analysis.
Thank you so much!
Disclaimer:
I do not provide personal investment advice and I am not a qualified licensed investment advisor.
All information found here, including any ideas, opinions, views, predictions, forecasts, commentaries, suggestions, expressed or implied herein, are for informational, entertainment or educational purposes only and should not be construed as personal investment advice. While the information provided is believed to be accurate, it may include errors or inaccuracies.
I will not and cannot be held liable for any actions you take as a result of anything you read here.
Conduct your own due diligence, or consult a licensed financial advisor or broker before making any and all investment decisions. Any investments, trades, speculations, or decisions made on the basis of any information found on this channel, expressed or implied herein, are committed at your own risk, financial or otherwise.
US100 trade ideas

NASDAQ technical analyse.📉 NAS100 Technical Analysis – Potential Reversal Zone Identified (4H Chart)
Price has seen a strong bearish move, breaking through multiple support levels. Currently, it is approaching a key demand zone between 22,600 – 22,420, which previously acted as strong support in early July.
I'm watching two potential scenarios from this level:
🔹 Scenario A (Blue Path): A bullish reversal from the current zone, targeting the 23,400 area. This would require confirmation with bullish candlestick patterns or momentum divergence.
🔸 Scenario B (Red Path): A deeper dip into the demand zone (towards 22,420), followed by a stronger bounce. This could offer a better risk-to-reward long entry if bullish structure forms.
🔻 Invalid if price closes decisively below 22,400, breaking structure and invalidating the reversal setup.
Let me know your thoughts. Are you going long or still waiting for confirmation?

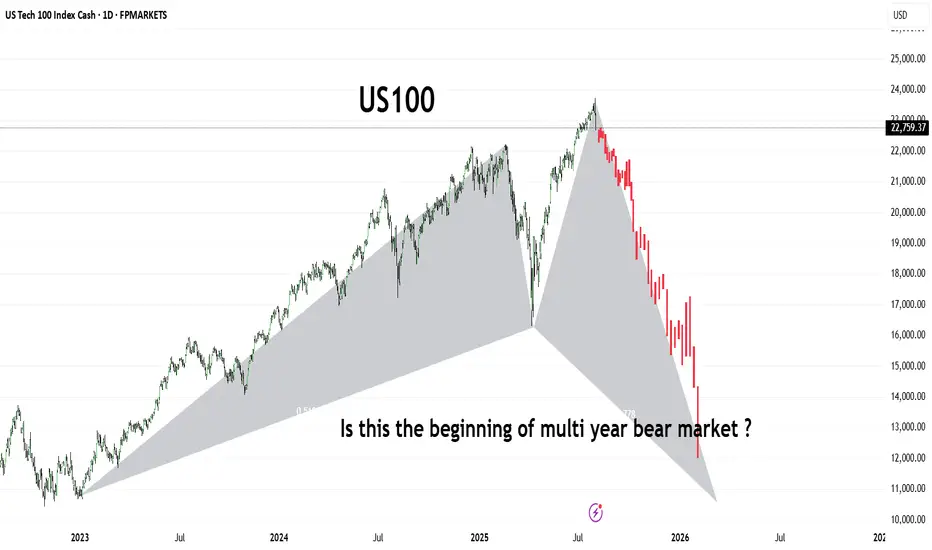
US100The US100 (Nasdaq 100) has shown a dramatic shift in trend, forming what appears to be a large-scale bearish harmonic pattern or potential M-top structure. After reaching its peak in mid-2025, the index has entered a sharp downward trajectory, shedding significant value in a short span.
This chart raises a critical question for long-term investors and traders:
Are we witnessing the early phase of a prolonged bear market that could stretch into 2026 and beyond?
🔻 Key Observations:
Bearish structure developing with aggressive selling pressure.
Potential breakdown from long-term support trendlines.
Momentum suggests institutional risk-off behavior.
Stay alert for macroeconomic cues, interest rate policy, and earnings season signals. A break below 13,000 could confirm a deeper bear cycle
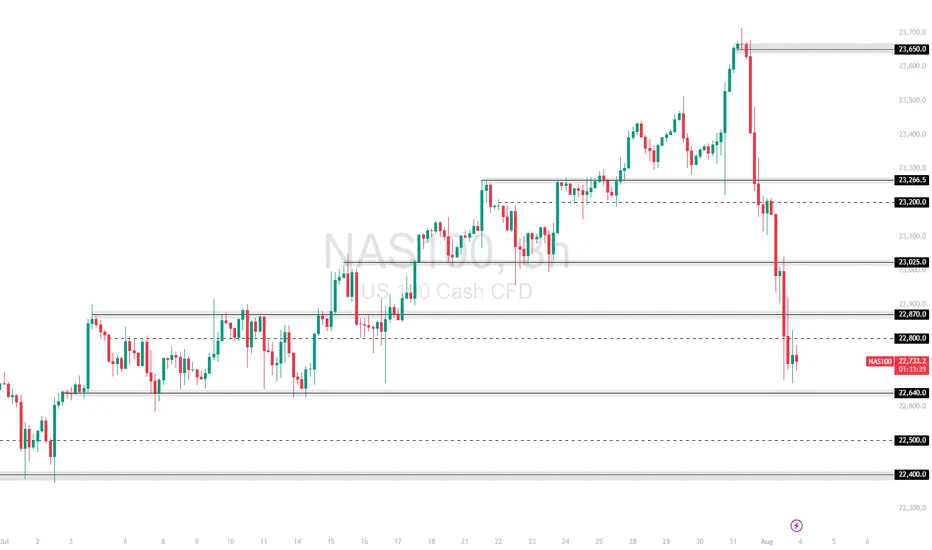
USNAS100 - Tech Weakness & Tariffs Drag NASDAQ LowerTariff Day Pressure Builds as Amazon Miss Weighs on Markets
Markets were hit by a wave of risk-off sentiment on Friday as renewed tariff headlines, weakness in pharma stocks, and a disappointing earnings report from Amazon clouded investor confidence. All this comes just ahead of the U.S. jobs report, which is expected to challenge the market's already diminished expectations for Fed rate cuts.
While macro markets appeared resilient earlier in the week, Wall Street futures and global equities turned cautious as sentiment deteriorated.
NASDAQ – Technical Outlook
The NASDAQ has dropped nearly 850 points from its recent all-time high of 23690, as anticipated in previous updates. The index remains under bearish pressure.
For today, the market is expected to remain sensitive due to recent macro and earnings-driven volatility.
If the price breaks below 22875, the decline is likely to extend toward 22710, with a deeper support zone at 22615.
To shift back to a bullish bias, the index must break and close above 23045 on the 1H chart.
Support Levels: 22875 • 22710 • 22615
Resistance Levels: 23140 • 23240 • 23320
Bias: Bearish while below 23045
Bullish confirmation: 1H close above 23045
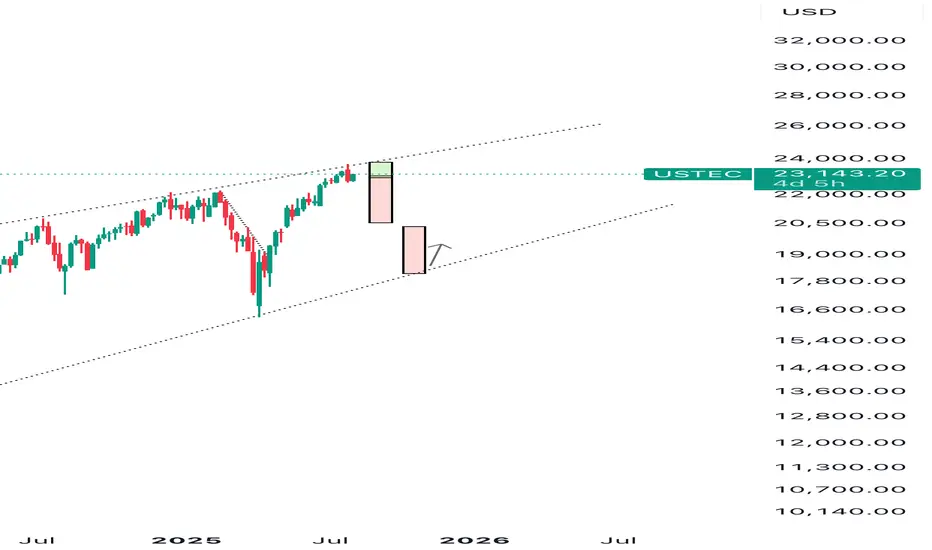
NASDAQ price dropAfter the Nasdaq price reaches around 23642.2, a historic drop will occur and the target is to drop to 16308.
Whatever happens at the highest price, the final destination is towards 16308.
I have identified the price levels in the middle of this expected drop that can cause the price to correct.
IG:NASDAQ

Is the NASDAQ Vault Open for a Full Bullish Heist?🧠 NASDAQ Heist Masterplan: Thieves Eye on 24,500 🎯💰
🚨 Asset: NASDAQ100 / US100 / NDX
📊 Plan: Bullish | 🔁 Layering Strategy
🎯 Target: 24,500
🛑 Stop Loss: 22,600
📍 Entry: Any level – the vault’s wide open!
💼 Thief Trader's NASDAQ High-Stakes Robbery Is LIVE! 🤑📈
Welcome, money bandits & market looters! 💼💰
The time has come to launch a full-scale bullish raid on the NASDAQ fortress. We’re not just taking entries — we’re stacking them like a pro with our layered limit order strategy across swing zones. 🔫📉➡️📈
🔓 Entry:
Pick any price! We break in anytime, anywhere.
🔁 Stack your buy limits on 15m–30m swing lows.
🔔 Set your alerts – don’t let the opportunity slip.
🛑 Stop Loss:
Guard your loot at 22,600.
Risk management is the bulletproof vest in this raid. 🎯
Adjust your SL based on lot size and order volume. 📏🔐
🎯 Profit Target:
Thieves retreat at 24,500.
But hey – smart robbers use trailing SL to squeeze every last drop of gold! 🏆💸
💡 Scalpers & Swingers:
Stick to the long side only.
If your pockets are deep – full-send mode ON.
If not, tag along with swing entries. Patience pays big! 💎⏳
📢 Heads Up, Heist Crew:
News drops = landmines. Step carefully.
🚷 No new entries during major announcements.
🛡️ Use trailing SL to defend your profit bags.
🚨 Daily Reminder:
This market isn’t a playground. It’s a battlefield.
Use COT data, macro reports, sentiment scans, and index-specific triggers to fortify your robbery blueprint. Stay smart, stay updated! 📊🧠
💥 Boost Our Loot Crew 💥
Hit that LIKE ❤️ to support the Thief Army!
Stronger visibility = Bigger Loots = More Victory Runs.
See you at the next robbery – we move in silence, but the market hears us loud! 🐱👤💸🔥🚀

Nasdaq Long 7.17.25At 9 AM, price bounced off of the PD high which signified that price wanted to distribute above the current week high, old day high. I entered at 10 AM off the 9 AM candle. Awesome trade and execution.

NASDAQ Long 7.28.25I saw that price had hit the PD high and took the PD low (sunday) then closed at 9 AM as a bullish hammer. At 10 AM, I entered long at the 9 AM wick equilibrium. The trade hit the 75% BE and Final TP with a 1:1 RR.

NAS100: Bullish Reversal from Key Support ZoneFirstly, our Algo-based indicators are used to create this analysis:
This 1-hour chart for NAS100 highlights a strong bullish reversal from a critical support level, suggesting a potential move back towards recent highs.
Analysis:
Support Bounce: The index experienced a sharp sell-off but found significant buying pressure within a key support zone marked between 22,677 and 22,829. This area, labeled "LSQB" (Liquidity Sweep Order Block) and including the "Daily Open," acted as a strong floor, triggering a V-shaped recovery.
Momentum Shift: The oscillator at the bottom of the chart confirms this shift in momentum. After dipping into the oversold "BUY" zone, the indicator has sharply reversed and is trending upwards with conviction, as indicated by the projected black arrow. This suggests that buyers have taken control in the short term.
Moving Averages: The price has decisively reclaimed the EMA 200 (the main green line), a key indicator often used to gauge the longer-term trend on a given timeframe. Holding above this level is a strong bullish sign.
Price Projection: The drawn black line illustrates the expected price path—a continued rally from the current level back towards the red resistance zone near the recent high of approximately 23,700.
Strategy:
Position: Long (Buy)
Entry: The bounce from the support zone has already been confirmed. Current levels could be seen as an entry, or traders might look for a minor pullback that holds above the EMA 200.
Target: The primary target is the red resistance zone around the 23,700 level.
Conclusion:
With the price reacting strongly to a key liquidity zone and momentum indicators confirming a bullish reversal, the path of least resistance for NAS100 appears to be upwards. The immediate target for this recovery is the recent high near 23,700.
Disclaimer: This analysis is for educational purposes only and should not be considered financial advice. Always conduct your own research and manage risk appropriately.

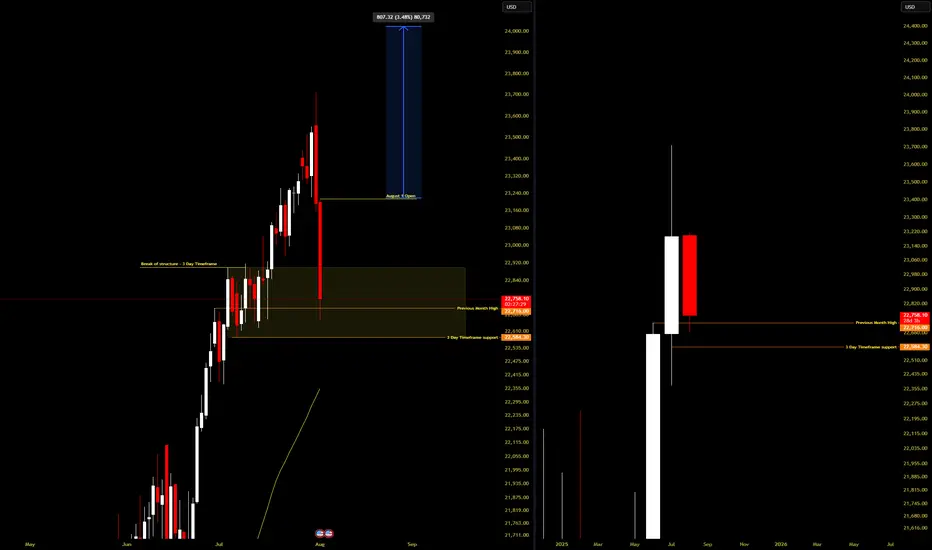
SWING TRADE NASDAQIs this another case of Trump moving the markets so his buddies can get better entries? 👀
Not saying anything... but July candles were way too friendly in that yellow box. Institutions were loading up like it was Black Friday.
I jumped in too—snagged a clean 10RR 😎📈
Now, with seasonality (August 3.5% average past 10 years) + Commitment of traders data backing me up( July COT is heavy longs), I’m risking light for a tiny 27RR setup.
Will it work? No clue.
Will I be dramatic about it? Absolutely. 🎭📉📈
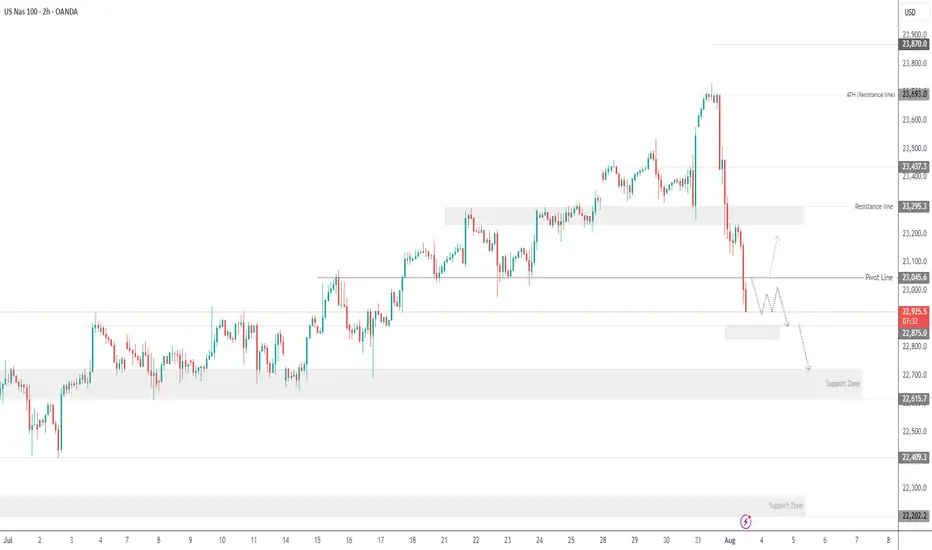
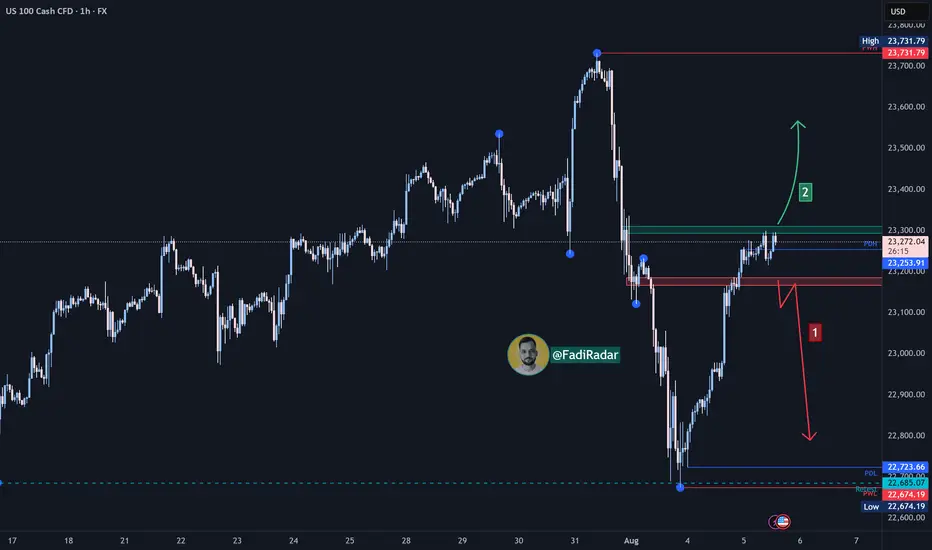
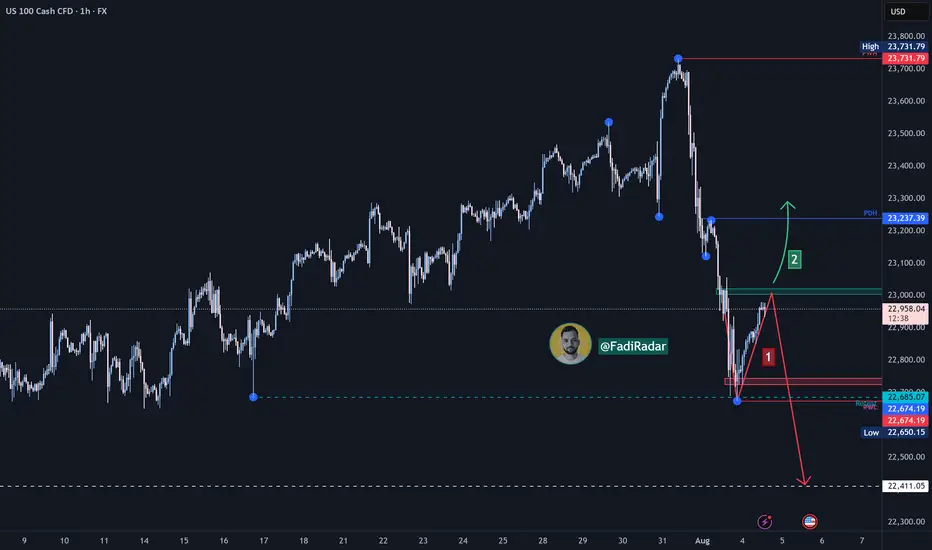
NAS100 Slammed by Fed Data and Trump Trade Remarks Can 22,640 ?The NAS100 plunged after strong US economic data fueled expectations of tighter Fed policy, and Trump's renewed push for aggressive trade deals rattled tech sentiment. After rejecting the 23,665 🔼 resistance, the index dropped sharply through multiple support levels.
Price is now consolidating just above the 22,640 🔽 zone, a key near-term support.
Support: 22,800 🔽, 22,640 🔽, 22,500 🔽
Resistance: 23,025 🔼, 23,277 🔼, 23,332 🔼
Bias:
🔽 Bearish: A breakdown below 22,640 could trigger a move toward 22,500. If that fails, 22,400 becomes the next target.
🔼 Bullish: A reclaim of 23,025 would be the first sign of bullish recovery.
📛 Disclaimer: This is not financial advice. Trade at your own risk.
Nasdaq| Bullish Intent Maintained| Refined OB Reaction In Motion(Refined & Structured):
• Pair: Nasdaq (US100)
• Bias: Bullish / Buy
• 4H Overview: Bullish structure remains intact. Despite the congestion and noise, price maintained its upward trajectory. I refined the drop to mid timeframes for precision and clarity.
• 30M Structure: Refined bullish structure with clear intent. Price has mitigated a clean OB, setting the stage for further continuation.
• Entry Zone: Watching lower timeframes for confirmation to ride the wave higher.
• Targets: 5M to 30M structural highs depending on how price delivers.
• Mindset Note: Noise is just noise until structure filters it out. Precision comes from refining—this setup proves that. Stay focused, stay clean, let intent guide you.
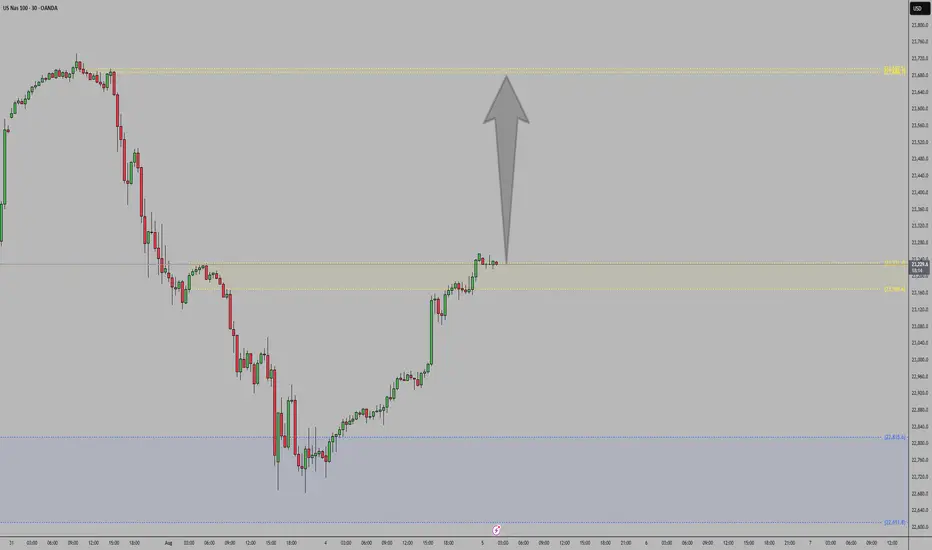
Nasdaq Index (US100 / NASDAQ) Technical Analysis:The Nasdaq Index showed improvement at the market open today and is currently trading near the $23,300 level, with price action building at a key resistance zone.
🔹 Bearish Scenario:
If the price retraces to $23,170 and breaks below it, a move toward $22,970 could follow as the next support target.
🔹 Bullish Scenario:
If the price breaks above $23,300 and holds, bullish momentum could drive the index toward $23,600.
⚠️ Disclaimer:
This analysis is not financial advice. It is recommended to monitor the markets and carefully analyze the data before making any investment decisions.
NASDAQNASDAQ is showing strength as price reacts from a key weekly support zone, aligning with the latest COT report indicating increased institutional long positions. This confluence supports a continued bullish outlook.
US100 makes a slight drop from ATH!Price dropped from the all time high of 23,703 we’re beginning to see a pullback in price. We’d be monitoring a time price will shift from intraday bearish to bullish. This is to help us position ourselves for a buy opportunity.
Nasdaq faces a possible down 5-10/20% downturn.Overconfidence will foreshadow a correction. Risk posed by slowing growth in jobs, trade disputes and high valuations in growth focused companies in the index.
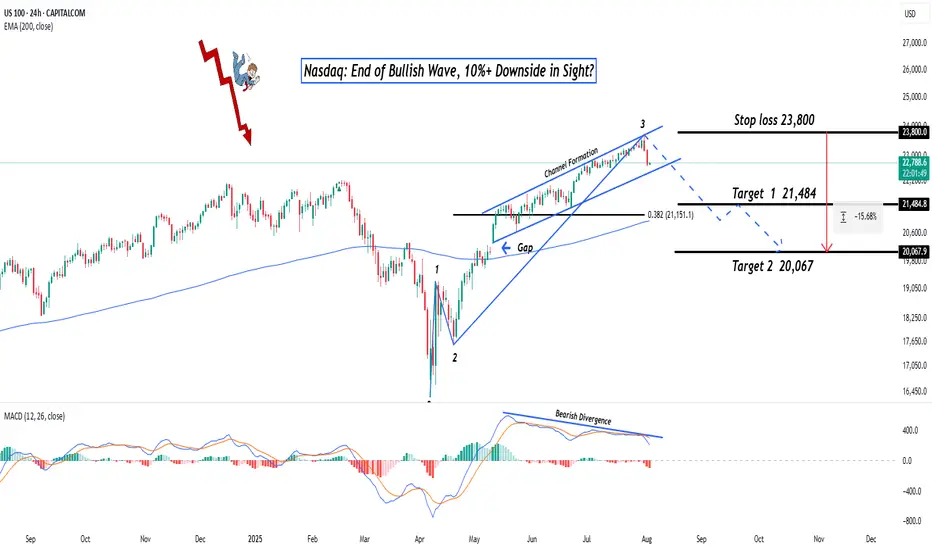
Nasdaq: End of Bullish Wave, 10%+ Downside in Sight?Hey Realistic Traders!
Has CAPITALCOM:US100 (Nasdaq) Finally Peaked? A Reversal Signal Just Flashed. Is This the Turning Point Toward a Deeper Pullback?
Let’s dive into the technicals to see what the chart is really telling us.
Technical Analysis
On the daily chart, the Nasdaq is starting to show signs of weakness. A bearish divergence has formed between the MACD and price movement , which is a classic signal that bullish momentum may be fading. This often indicates the potential for a trend reversal or a deeper correction.
A recent drop, confirmed by a strong bearish full-body candlestick, suggests that selling pressure is increasing. If this continues, we expect a breakdown from the current bullish channel.
In this scenario, the extended Wave 3 may have reached its peak. A correction could follow, with the first target at 21484, which lines up with the 0.382 Fibonacci retracement level. If the decline continues, the next downside target would be around 20067, where a previous gap may be filled.
This bearish outlook remains valid as long as the price stays below 23800 . A move above that level would invalidate the setup and return the outlook to neutral.
Support the channel by engaging with the content, using the rocket button, and sharing your opinions in the comments below.
Disclaimer: "Please note that this analysis is solely for educational purposes and should not be considered a recommendation to take a long or short position on Nasdaq.
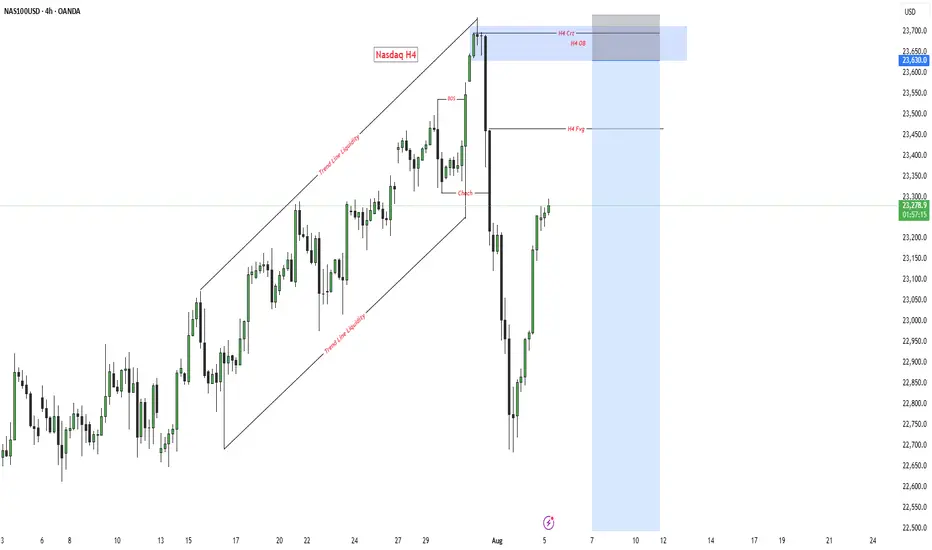
Nasdaq h4✅ NASDAQ H4 – Premium Short Setup
📊 What we are looking at:
✔️ H4 FVG (Fair Value Gap)
✔️ H4 Order Block (OB)
✔️ H4 CRT (Candle Range Theory)
✔️ Trendline Liquidity already taken out
📌 Game Plan:
Price swept trendline liquidity and is now pushing towards H4 FVG.
As soon as it retests the FVG and taps into OB & CRT zone, we’ll look for SELL opportunities from this premium area.
🎯 Target: Next liquidity pool below.
⚠️ Patience = Profit. Wait for confirmation before entry.
🔥 Smart Money never chases – it waits for the market to deliver.
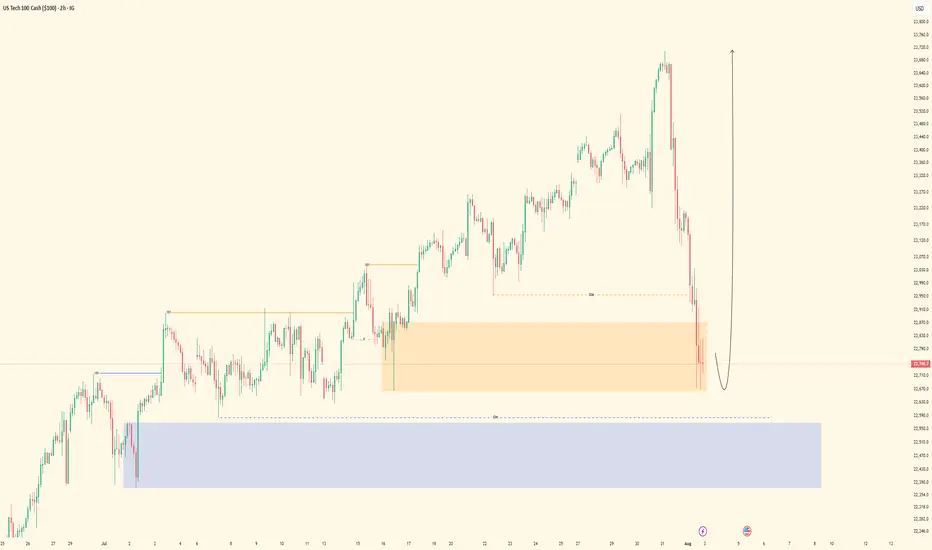
Nasdaq US100 Wave 3 Expansion Toward 31,606 in PlayNasdaq US100 has completed a significant wave cycle with a confirmed wave 1 in the broader Elliott Wave structure. Following this, price underwent a corrective wave 2 that extended from the $22,237 supply zone down to $16,334, marking the conclusion of the previous cycle’s correction. This structure now signals the initiation of a fresh upward impulse, setting the stage for a powerful wave 3 advance.
The emergence of wave 3 will gain full confirmation once price successfully breaks above the external supply zone, reclaiming $22,237. If this breakout occurs with sustained momentum, the wave 3 projection targets an expansion toward $31,606, which aligns with the 161.8% Fibonacci extension from the prior cycle. This forthcoming rally is anticipated to unfold in a five-subwave format, indicative of a high-momentum bullish leg.
As long as price action remains above the key support at $16,334, the bullish cycle remains valid. All eyes should now be on the breakout structure and volume profile around $22,237, as it represents the gateway to a much broader impulsive move.

Short NAS100Elite analysis
Short entered in lower time frames
Executed at market open
Targeting lower liquidity pools

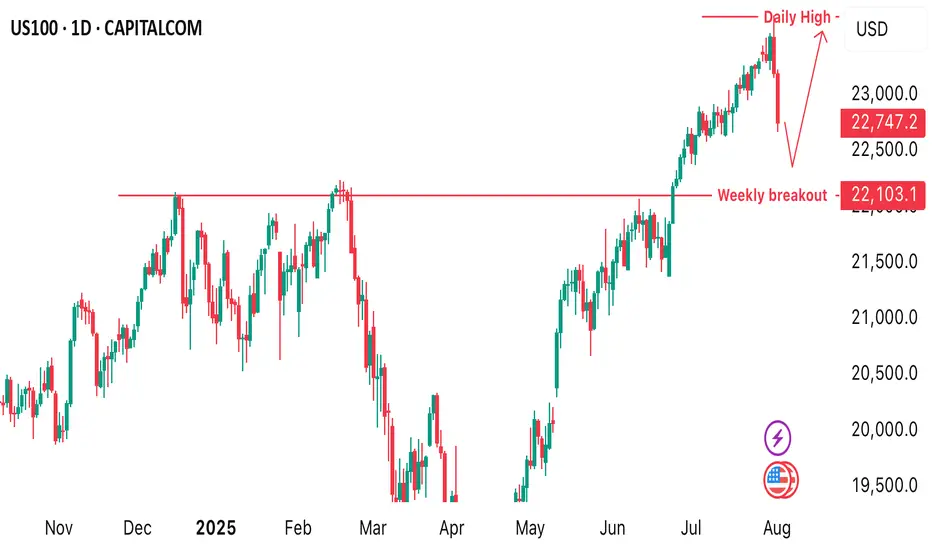
US100The US100, also known as the Nasdaq 100 Index, tracks the performance of the 100 largest non-financial companies listed on the Nasdaq Stock Exchange, primarily in the technology, consumer services, and healthcare sectors. It is a market-capitalization-weighted index and includes major corporations such as Apple, Microsoft, Amazon, NVIDIA, Meta, and Alphabet. As a tech-heavy index, the US100 is highly sensitive to changes in interest rates, innovation cycles, investor sentiment, and macroeconomic indicators, especially those related to inflation, employment, and monetary policy.
Over the past two decades, the Nasdaq 100 has experienced strong long-term growth, driven by the expansion of the digital economy, cloud computing, artificial intelligence, and e-commerce. After a steep correction in 2022 caused by inflation concerns and aggressive rate hikes by the Federal Reserve, the index rebounded in 2023 and 2024, supported by improving macroeconomic conditions, a stabilization in interest rates, and renewed investor confidence in tech and growth stocks. AI-driven investments, semiconductor breakthroughs, and tech-led productivity gains have further fueled its momentum.
As of August 2025, the US100 is trading at 22,747, marking a new historical high. This reflects strong earnings performance from major tech companies, continued innovation in AI and automation, and a more dovish outlook from the Federal Reserve, which has helped reduce pressure on growth equities. Despite its gains, the index remains vulnerable to volatility stemming from inflation surprises, geopolitical risks, and shifts in central bank policy. The Nasdaq 100 continues to be a key benchmark for growth-oriented investors and a barometer for the health of the global tech sector.

Nasdaq Index (US100 / NASDAQ) Technical Analysis:The Nasdaq index experienced a sharp drop last week, as expected, testing the 22,680$ level. Today, it's showing signs of a corrective move, currently trading around 22,950$.
🔹 Bearish Scenario:
If the price drops back to 22,680$ and breaks below it with confirmation, the next support could be 22,400$.
🔹 Bullish Scenario:
If buying momentum pushes the price above 23,000$, and it holds, we may see an extension toward 23,240$ and possibly 23,500$.
⚠️ Disclaimer:
This analysis is not financial advice. It is recommended to monitor the markets and carefully analyze the data before making any investment decisions.
NAS100 - Update Dear Friends in Trading,
How I see it,
I will be waiting for a clear and decisive break below the PIVOT.
Keynote:
I am not trading NASDAQ at all...just monitoring patiently!!
I will keep you in the loop as the stock market progress...
I sincerely hope my point of view offers a valued insight
Thank you for taking the time study my analysis.
