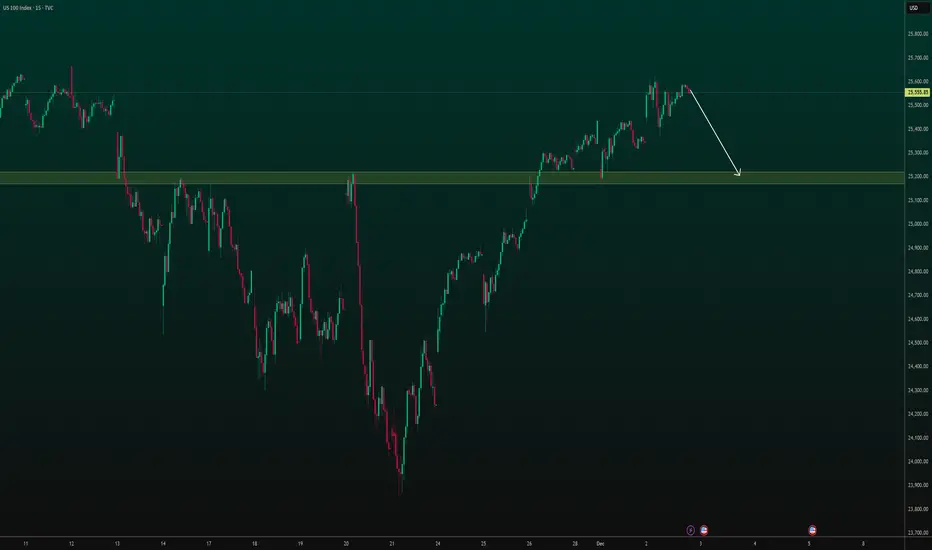
NAS100 Trade Set Up Dec 5 2025Price has shifted to bearish structure and is targeting SSL and PDL but first i will wait for more internal structure on the 15m-5m to continue lower
Market insights

Nasdaq shorts pendingOkay okay 👌🏽
$25k FLAT is what she’s hunting.
In a crucial handle as we speak and I am personally looking for some work into $26,970 early next week before bleeding this thing off into target..
Nothing more to say, keep it simple. Same goes for us30, she’s in the same boat for shorts 🩳 …
Tab up 650-690 and hopefully we can see her make a move upside to set it up?!
If not. Flip the script and play this in reverse.. ⏮️
Profile be up on next week. Watch people….
LFG 👽 🫶🏽

Nq longIf price goes back down, i'll likely take this trade. seems strong volume here, plus Japan likely to buy NQ too in their morning.
if price goes back all the way all time high, cancel this trade.

NAS100 Bullish Setup on 1hrNAS100 Bullish Setup on 1hr
Bullish Setup presented on 1hr
- Bullish divergence
- 1hr FVG created in this crazy sell off
- 1hr unfinished candle at my TP level
Entry: 24160
TP: 25000
SL: 23980
RR: 1:5.71

Nasdaq breakout around the corner?The Nasdaq is pushing higher as weaker US employment data boosts risk sentiment and fuels expectations that the Fed will move ahead with rate cuts. With softer labor figures reducing pressure on monetary policy, investors are rotating back into growth and tech names, supporting the broader index. The year-end rally narrative is strengthening as well, with many market participants positioning early for seasonal upside.
Lower Treasury yields are adding momentum, making equities relatively more attractive and encouraging capital to flow back into high-beta sectors. Corporate earnings remain solid in key industries, which helps stabilise sentiment after recent volatility. On top of that, easing geopolitical tensions and improved liquidity conditions are giving markets another tailwind. Market breadth has been expanding too, indicating that the upside is supported by more than just a handful of mega-caps.
From a technical perspective, the critical level to watch is the 25,700 zone. A clean break above this resistance could trigger further upside and potentially send the index toward its old all-time high. Until that breakout occurs, short-term pullbacks are still possible, but the broader setup continues to point toward a constructive outlook as long as the index holds above key support areas.
NAS100 – Riding the Channel: Will Price Respect the MidlinePrice continues to move cleanly inside the long-term ascending channel, with the midline acting as dynamic support throughout the past week. Each retest of the dashed median line has produced bullish continuation, but momentum is starting to flatten at the upper boundary.
Key Observations:
Price is currently hovering near the upper half of the channel, showing signs of exhaustion.
The dashed median line has been respected repeatedly — a key structure level to watch.
Bullish structure remains intact as long as price stays above the recent internal higher-low zones (highlighted in green).
MACD shows slowing momentum despite higher prices, signalling a possible pullback into channel support before continuation.
Levels to Watch:
Bullish continuation: If price holds above the midline, we could see another leg into the upper boundary of the channel.
Pullback zone: Watch for a corrective move into the lower channel support if buyers fail to sustain momentum.
Invalidation: A clean break below the channel would shift bias to short-term bearish retracement.
This structure is still very clean — waiting for either a respectful retest or a decisive breakout.
📌 Bias
Bullish overall structure, but expecting a short-term pullback before continuation.

NAS100 H4 | Bullish Bounce OffMomentum: Bullish
Price has bounced off the buy entry, which is acting as pullback support, and is currently trading above the Ichimoku cloud.
Buy Entry: 25,185.75
Pullback support
Stop Loss: 24,903.03
Pullback support
38.2% Fibonacci retracement
Take Profit: 25,829.99
Pullback resistance
145% Fibonacci extension
High Risk Investment Warning
Stratos Markets Limited (tradu.com ), Stratos Europe Ltd (tradu.com ):
CFDs are complex instruments and come with a high risk of losing money rapidly due to leverage. 70% of retail investor accounts lose money when trading CFDs with this provider. You should consider whether you understand how CFDs work and whether you can afford to take the high risk of losing your money.
Stratos Global LLC (tradu.com ): Losses can exceed deposits.
Please be advised that the information presented on TradingView is provided to Tradu (‘Company’, ‘we’) by a third-party provider (‘TFA Global Pte Ltd’). Please be reminded that you are solely responsible for the trading decisions on your account. Any information and/or content is intended entirely for research, educational and informational purposes only and does not constitute investment or consultation advice or investment strategy. The information is not tailored to the investment needs of any specific person and therefore does not involve a consideration of any of the investment objectives, financial situation or needs of any viewer that may receive it. Past performance is not a reliable indicator of future results. Actual results may differ materially from those anticipated in forward-looking or past performance statements. We assume no liability as to the accuracy or completeness of any of the information and/or content provided herein and the Company cannot be held responsible for any omission, mistake nor for any loss or damage including without limitation to any loss of profit which may arise from reliance on any information supplied by TFA Global Pte Ltd.

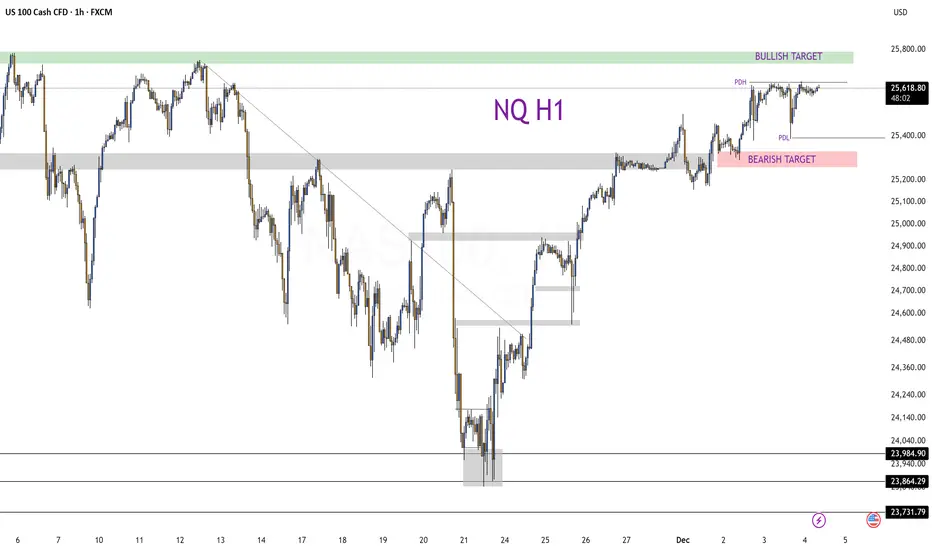
Nasdaq — Current Setup & What Could Happen Next📈 Nasdaq — Current Setup & What Could Happen Next
🔹 Technical Setup
Nasdaq has been accumulating between 25,600–25,650 since Tuesday, marking a clear base where buyers stepped in.
I’m watching for a break to the upside with pullback entries, aiming to complete the fractal toward 25,770, a level with previous supply/resistance.
Yesterday’s -1% drop after negative news from Microsoft was gradually erased by steady buying — a sign that underlying demand remains resilient.
The accumulation and rebound off that base may signal a renewed bullish leg, provided we see clean technical confirmation.
🌎 Fundamental & Market Context
Rate-cut hopes are returning: Traders are increasingly betting on a potential cut by the Federal Reserve next month, which tends to support growth and tech sectors.
That expectation has helped lift sentiment across U.S. equities, including the Nasdaq.
On the flip side, rising Treasury yields and macroeconomic uncertainty remain a risk; any hawkish Fed hints or weak corporate earnings could challenge the bullish view.
🎯 Trading Scenarios
➡️ Bullish:
Break of accumulation zone → long entries on pullback → target 25,770.
⚠️ Bearish / Cautious:
Failure to break up, or a sharp reversal → fallback toward lower liquidity zones/Potential PDL.
TVC:DXY SP:SPX CAPITALCOM:US100
NAS100 - Buy SetupTimeframes Used: Monthly → Weekly → Daily → 4H
Current Market Condition:
XAUUSD is a valid trade according to my system rules:
Monthly: Price is above the Cloud → Bullish
Weekly: Price is above the Cloud → Bullish
Daily: Price is above the Cloud → Bullish
----------------------------------------------------------------------------------------------------------------
Currently in trade on 4hr timeframe:
Entry: 25,072.29
Stoploss: 24,736.54

US100 - Facing Resistance, Potential Pullback to SupportUS100 has hit a strong resistance level and is now showing signs of a potential pullback. The white arrow indicates a possible retracement towards the highlighted support zone, which was previously a resistance.
NAS100 4h SELLchart presents a medium-term bearish outlook, followed by a long-term bullish reversal. combining Fibonacci retracements, cycle timing (bars/days), moving averages, and wave projections to create a full market roadmap.
Below is a structured analysis:
1️⃣ Current Market Structure
NAS100 reached a major top near 26,000 before reversing.
Price broke below the short-term trendline and is dropping toward deeper support.
The red zig-zag pattern reflects your expectation of continued selling pressure.
This suggests the index is entering a medium-term correction.

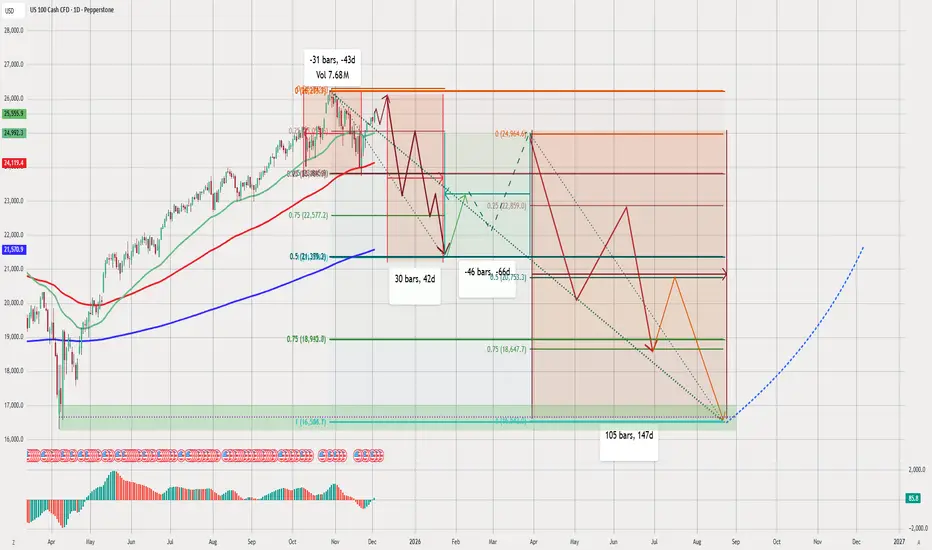
NAS100 DAILYNAS100 Technical Analysis (Daily Chart)
chart presents a medium-term bearish outlook, followed by a long-term bullish reversal. combining Fibonacci retracements, cycle timing (bars/days), moving averages, and wave projections to create a full market roadmap.
Below is a structured analysis:
1️⃣ Current Market Structure
NAS100 reached a major top near 26,000 before reversing.
Price broke below the short-term trendline and is dropping toward deeper support.
The red zig-zag pattern reflects expectation of continued selling pressure.
This suggests the index is entering a medium-term correction.
2️⃣ Fibonacci Levels (Key Zones Identified)
chart uses multiple retracements:
Current swing retracement levels
0.25 – 23,869
0.5 – 21,383
0.75 – 18,993
These levels match the projected downward path.
Major support zone
Large green rectangular zone near 16,300 – 17,000
This is aligned with:
Long-term Fibonacci support
Previous accumulation zone
Blue dotted long-term rising trendline
This zone is likely the macro bottom of the cycle.
3️⃣ Moving Averages (Trend Signals)
using:
Green MA (short-term)
Red MA (medium-term)
Blue MA (200-day long-term)
Current price is:
Breaking below the green and red MAs
Approaching the 200-day MA around 21,000
A break under the 200-day MA confirms a total trend shift to bearish.
4️⃣ Cycle Timing (Bars/Days)
chart marks three key cycles:
🔹 From the top to first support:
31 bars, 43 days
🔹 Next consolidation period:
30 bars, 42 days
🔹 Full correction phase to the bottom:
105 bars, 147 days
This indicates a highly structured time cycle, showing the correction may last until August–September 2026.
5️⃣ Expected Bearish Phase (Primary Scenario)
red path suggests:
Continued decline from current levels
Multiple lower highs and lower lows
A temporary bounce around 21,800
Then deeper drops toward 18,600 – 19,000
Extended capitulation down to the 16,300 zone (major support)
This zone is highlighted heavily, suggesting it is final bearish target.
6️⃣ Recovery Phase (Bullish Scenario)
After the bottom:
🟦 Bullish reversal zone: 16,300
The blue dotted line indicates:
A multi-month recovery
Strong upside momentum
Reestablishment of a long-term bullish trend
Possible return to previous highs later
This forms a textbook "macro correction → macro rally" cycle.
7️⃣ Summary of Your Market View
📉 Short-Term Bias: Strongly Bearish
Market breaking structure
Cycle timing supports continued decline
Price heading for deeper Fibonacci levels
📉 Medium-Term Bias: Bearish
Expecting multiple waves of selling
Target zone: 18,600 then 16,300
📈 Long-Term Bias: Bullish
After the cycle completes, NAS100 should resume its uptrend
Blue dotted projection shows a long rally into late 2026 and 2027
✔️ Final Outlook
chart shows a well-planned, detailed scenario:
A multi-leg correction
Followed by a strong, long-term bullish cycle
The 16,300 zone is the “macro bottom”
Timing suggests bottoming around August–September 2026
analysis is consistent, logical, and follows smart technical principles.
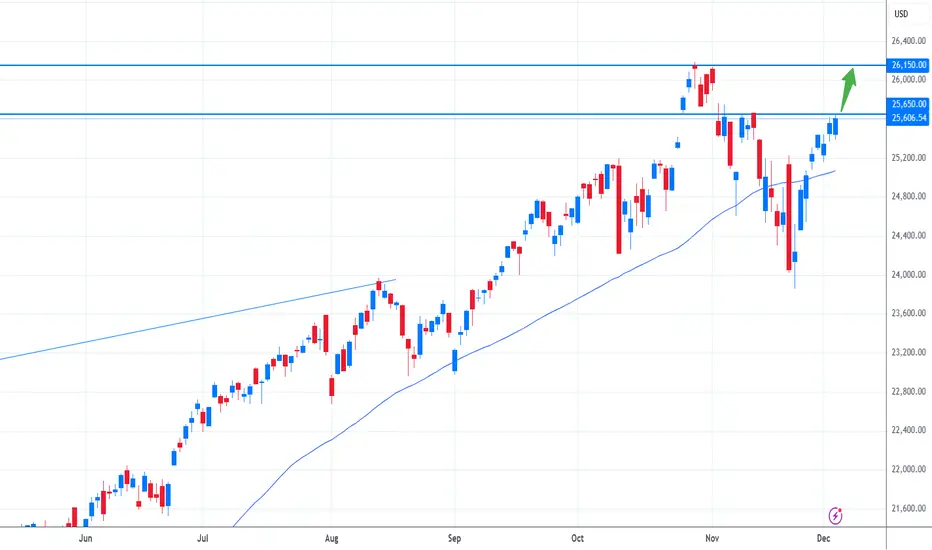
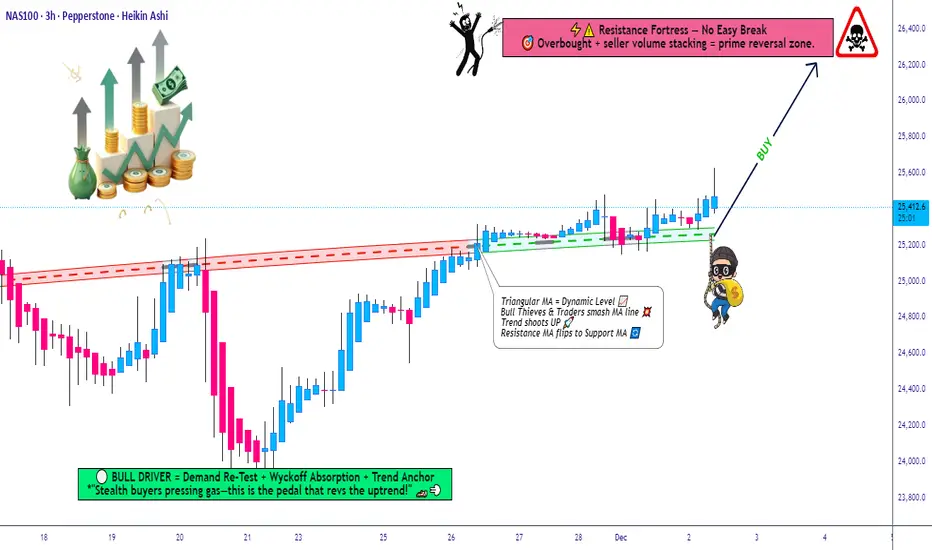
NASDAQ100 Breakout Watch — Is a New Upside Leg Starting Now?📈 NASDAQ100 Swing Trade Opportunity — Bullish Breakout Play
🟩 Asset: NASDAQ100 (Index CFD)
⚡ Trade Type: Swing Trade — Bullish Plan Confirmed
🧭 Trade Thesis
The index has confirmed a bullish setup following a Triangle + Moving Average breakout, strengthening upward momentum and favoring dip-buying behavior.
To reflect the Thief layering method, this plan uses multiple staggered limit orders to accumulate positions efficiently across volatility pockets.
📌 Entry Plan (Thief Layering Method)
💰 Entry Style: “Any price level allowed — Thief uses layers”
Buy Limit Layers:
24,900
25,000
25,100
25,200
(Feel free to increase or customize layers to fit your personal risk and liquidity preference.)
🛑 Stop-Loss (SL)
🔻 Thief SL: 24,500
Dear Ladies & Gentlemen (Thief OG’s), adjust SL based on your personal risk and strategy.
This is not a fixed recommendation, only a reference zone.
🎯 Target (TP)
⚡ The High-Voltage Electric Gate Zone around 26,200 acts as major resistance because of:
Overbought readings
High-liquidity trap behavior
Historical reversal probability
Exit with profits before heavy sellers activate.
Again — you decide your own TP based on your risk tolerance, not mine.
📊 Market Logic Behind the Move
Breakout structure confirmed
Trend continuation supported by triangle compression
Index ETF flows show short-covering + rotation back into tech
Momentum accelerates above 25,200 zones
Cleaner upside path until liquidity wall at 26,200
🔎 Related Pairs to Watch (Correlation Insight)
1️⃣ NASDAQ:NDX / NASDAQ:QQQ
Direct ETF mirror of NASDAQ100
Useful for checking volume, market depth, and real-time breakout confirmation
2️⃣ SP:SPX / NYSE:ES (S&P 500)
High correlation (approx. 0.85+)
A strong SPX supports tech continuation; weakness warns of index-wide pullback
3️⃣ TVC:VIX (Volatility Index)
Inverse correlation
If VIX stays below key volatility thresholds, bullish NASDAQ continuation is more reliable
4️⃣ FX:USDOLLAR / DXY
Tech usually performs better when the Dollar weakens
A rising Dollar can slow or cap NASDAQ bullish momentum
5️⃣ TVC:US10Y / Yields
NASDAQ moves inversely with yields
If yields drop, NASDAQ accelerates
If yields spike, prepare for turbulence or failed breakouts
📘 Summary
Bullish plan confirmed via Triangle + MA Breakout
Thief layering entries positioned smartly into volatility
SL/TP guidance flexible for trader customization
Strong correlation checks available across SP:SPX , TVC:VIX , TVC:DXY & yields
US NAS 100DO YOU KNOW WHATS BEHIND THIS OR OTHER IDEAS?? in bio..
Preferably suitable for scalping and accurate as long as you watch carefully the price action with the drawn areas.
With your likes and comments, you give me enough energy to provide the best analysis on an ongoing basis.
And if you needed any analysis that was not on the page, you can ask me with a comment or a personal message.
Enjoy Trading ;)

NAS100 Trade Set Up Dec 2 2025Price has swept PDH so i will wait for internal 5m-15m structure to see if price can push higher to 4h supply or close under PDH to make internal bearish structure to target SSL/PDL

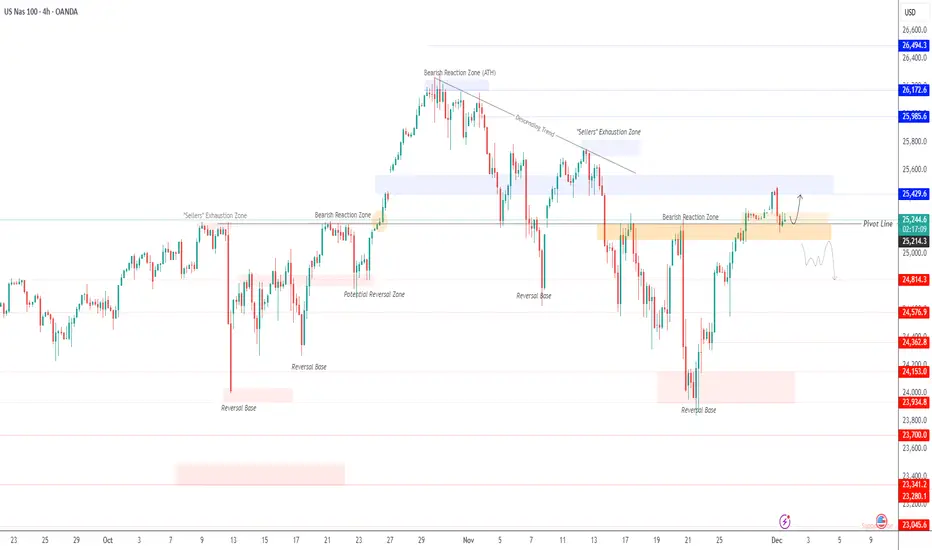
USNAS100 | Breakout Setup Ahead of PowellOANDA:NAS100USD – Outlook
Wall Street futures slipped on Monday as investors turned cautious ahead of key U.S. economic data and remarks from Federal Reserve Chair Jerome Powell later in the day.
Market participants will closely analyze Powell’s comments for any hints regarding the Fed’s stance on potential rate cuts at this month’s policy meeting.
Technical Analysis
NASDAQ is trading inside a consolidation range between 25200 and 25290, showing a slightly bullish bias while holding above 25200.
A 1H close above 25290 will confirm bullish continuation toward 25430, and a breakout above 25560 opens the path for an extended rally toward 25980.
On the downside, a 1H close below 25200 will expose 25100, and a break below this level will trigger stronger bearish momentum toward 24810 → 24570.
Pivot Line: 25200
Support: 25100 · 24820 · 24570
Resistance: 25300 · 25420 · 25560
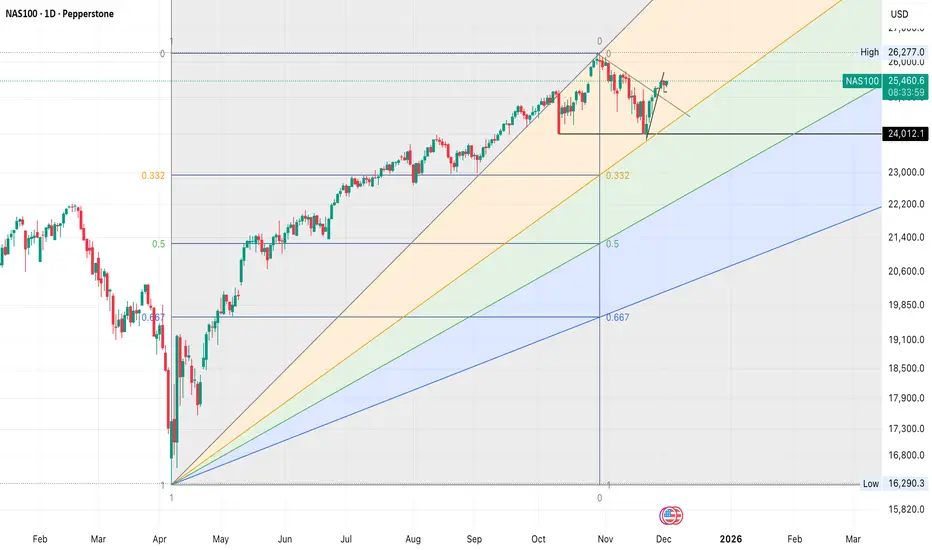
Speed resistance line is in effective0.332 speed resistance line shows effectiveness in NAS100 drawdown.
USNAS100 consolidating within a bearish trendThe USNAS100 is currently consolidating within a bearish trend. Wall Street’s main indexes are expected to open lower on Monday as investors move to the sidelines ahead of key economic data and a closely watched speech from Federal Reserve Chair Jerome Powell. Markets are looking for clues regarding the Fed’s policy direction later this month.
From a technical perspective, US100 remains vulnerable to further downside If price closes below 24,990 and holds beneath this level, bearish momentum is likely to continue. In that scenario, the next support zones lie at: 24,800 TO 24,200
You may find more details in the chart.
Trade wisely best of luck buddies.
Ps; Support with like and comments for better analysis Thanks for supporting.


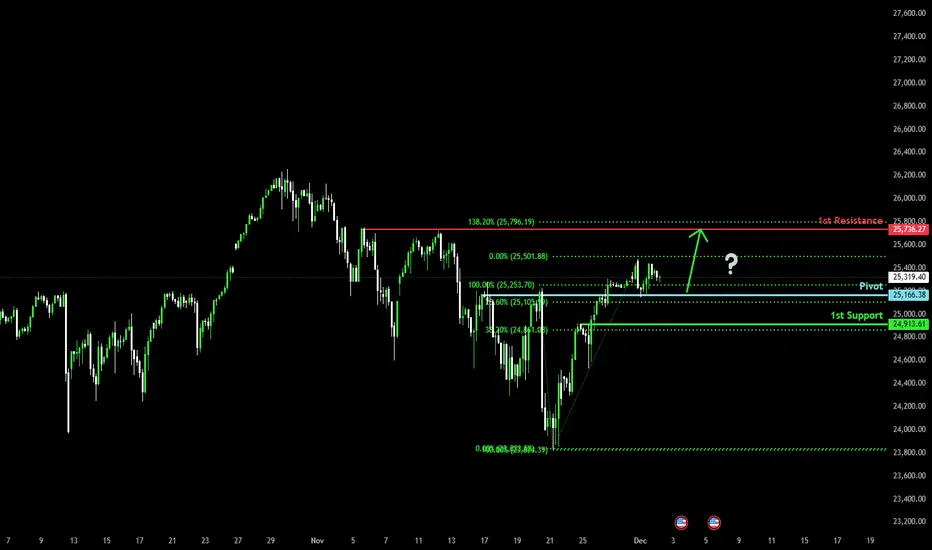
Bullish continuation setup?USTEC has bounced off the pivot and could potentially rise to the 1st resistance.
Pivot: 25,166.38
1st Support: 24,913.61
1st Resistance: 25,736.27
Disclaimer:
The opinions given above constitute general market commentary and do not constitute the opinion or advice of IC Markets or any form of personal or investment advice.
Any opinions, news, research, analyses, prices, other information, or links to third-party sites contained on this website are provided on an "as-is" basis, are intended to be informative only, and are not advice, a recommendation, research, a record of our trading prices, an offer of, or solicitation for, a transaction in any financial instrument and thus should not be treated as such. The information provided does not involve any specific investment objectives, financial situation, or needs of any specific person who may receive it. Please be aware that past performance is not a reliable indicator of future performance and/or results. Past performance or forward-looking scenarios based upon the reasonable beliefs of the third-party provider are not a guarantee of future performance. Actual results may differ materially from those anticipated in forward-looking or past performance statements. IC Markets makes no representation or warranty and assumes no liability as to the accuracy or completeness of the information provided, nor any loss arising from any investment based on a recommendation, forecast, or any information supplied by any third party.
Going long (buy) .,Nas100 broke out of the trend line…and retesting the demand zone for a conformation to go long.

Nasdaq 100 – Technical & Fundamental OutlookTechnical:
Nasdaq is holding a recovery structure after bouncing strongly from 24,300. Price is stabilizing above 25,200, but the index still struggles to break above 25,400–25,500, a key short-term supply zone.
Fundamental:
Tech sentiment improves with expectations of rate cuts and solid earnings outlook, but macro uncertainty keeps volatility high, especially around U.S. labor and inflation data.
Key:
Holding above 25,200 keeps bullish momentum alive.
Rejection at 25,500 could trigger a pullback.

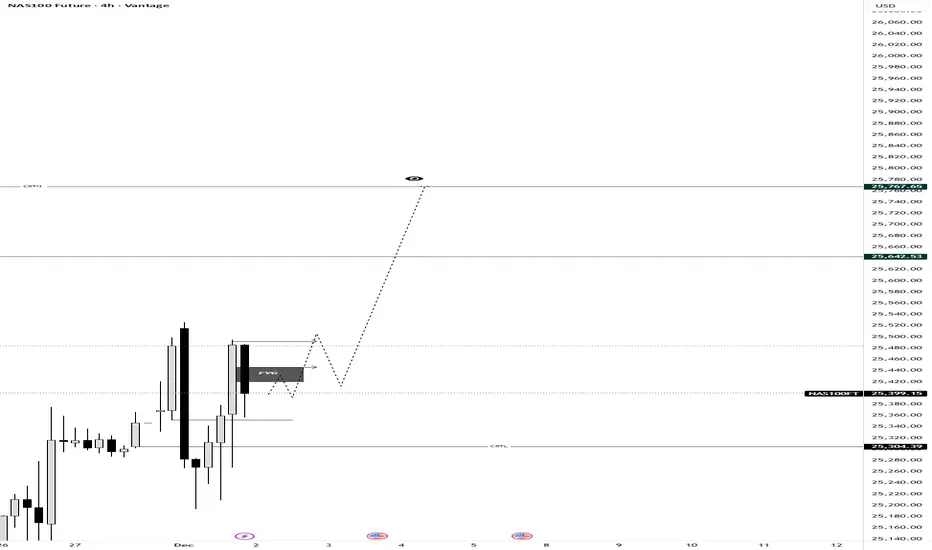
NAS100 Decoded: The Anatomy of a CRT SetupMost traders see random candles; we see a structured story. On this 4H NAS100 chart, we are witnessing a textbook example of Candle Range Theory (CRT) in motion.
If you understand the "Three-Phase Engine" inside every candle, the next move becomes clear.
The 3-Step Logic Behind This Setup:
The Purge (Accumulation): Notice how price dipped to sweep the CRTL (Candle Range Theory Low). This wasn't a random breakdown; it was a Purge Phase designed to grab liquidity and trap retail shorts. By sweeping the low (PL), the market collects the necessary fuel for the reversal.
The Mitigation (The Current Trap): Price has reclaimed the range and is currently mitigating within the FVG (Fair Value Gap). In CRT, this is the Mitigation Phase, where price returns to balance or "Equilibrium" (EQ) to fill imbalances before the real move begins. This phase often confuses traders, but it is simply smart money rebalancing positions.
The Expansion (The Delivery): With the internal liquidity harvested and the imbalance filled, the logic dictates a move toward the CRTH (Candle Range Theory High). This is our Expansion Phase, targeting the "Expansion Level" (EL). The "eye" icon on the chart represents the Draw on Liquidity (DOL)—the magnetic attraction pulling price toward the liquidity pools resting above the highs.
💡 The Lesson: Don't chase the red candles during the purge. Wait for the mitigation. As the theory states:
"The Purge phase creates the opportunity, the Mitigation phase provides the entry, and the Expansion phase delivers the profit".
Are you watching this FVG hold, or are you waiting for a break of structure confirmation? Let me know in the comments! 👇
Greetings,
MrYounity