High risk high reward set-up1. Current Market Structure
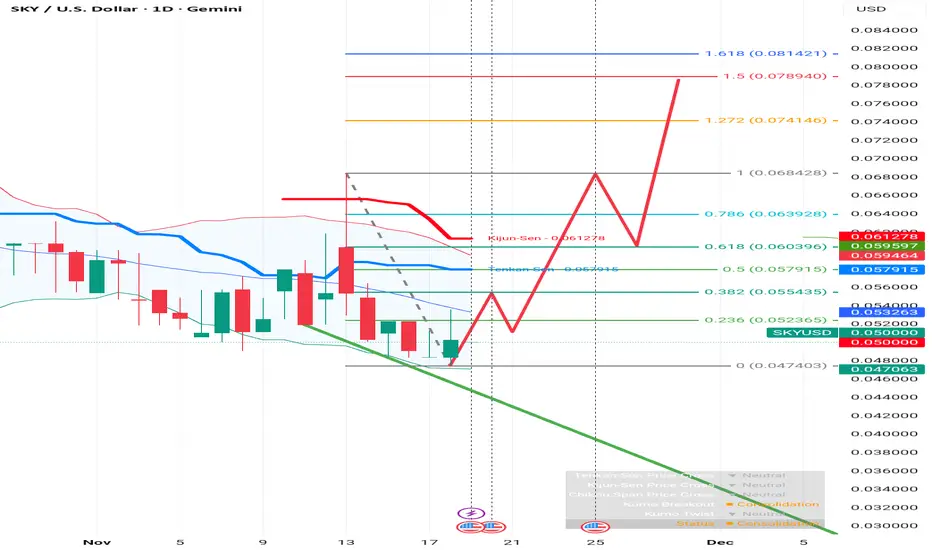
Trend: The asset has been in a downtrend, evidenced by the lower highs and lower lows over the past few weeks. The price is currently trading around $0.0500.
Support Zone: The price recently found a floor at the 0.0474 level (marked as the 0 Fibonacci level). The current price action suggests a period of consolidation or a potential bottoming formation.
Indicators:
Ichimoku Elements: The price is currently below the Tenkan-Sen ($0.0579) and Kijun-Sen ($0.0612) lines. In Ichimoku theory, price below these lines typically indicates bearish momentum, meaning the price needs to cross above them to confirm a reversal.
Bollinger Bands: The bands appear to be narrowing slightly, which often precedes a period of high volatility (a breakout or breakdown).
2. The "Red Line" Projection
The red hand-drawn line on your chart represents a classic Reversal Scenario, specifically resembling a Double Bottom or a complex Inverse Head and Shoulders pattern. Here is the breakdown of that prediction:
Phase 1: The Retest (Current to Short Term) The projection anticipates the price might dip slightly one more time to retest the recent low near $0.0474. This would create the second "leg" of a "W" pattern (Double Bottom), confirming strong support at that level.
Phase 2: The Breakout After the retest, the projection predicts a sharp rally upward, breaking past the initial resistance at the 0.236 Fib ($0.0523) and the 0.382 Fib ($0.0554).
Phase 3: The Golden Ratio Challenge The rally is expected to pause or face resistance at the 0.618 Fib level ($0.0603). In technical analysis, this is often called the "Golden Pocket." A rejection here is common, hence the small dip drawn in the red line before the continuation.
Phase 4: The Extension (Target) The final leg of the drawing predicts a massive breakout to the 1.618 Fibonacci Extension at $0.0814.
3. Key Technical Levels to Watch
Critical Support 0.0474 The recent low. If the price breaks below this, the bullish projection is invalidated, and the price could seek lower lows.
Resistance 1 0.0579 Tenkan-Sen / 0.5 Fib. A crucial mid-point resistance.
Resistance 2 0.0612 Kijun-Sen / 0.618 Fib. This is the "trend flipper." Breaking this confirms a bullish trend reversal.
Target 0.0814 1.618 Extension. The ultimate profit target based on this specific Fib setup.
4. Summary
The market is currently bearish, but the drawing is betting on a bottom formation.
Bullish Signal: Watch for a daily candle close above $0.053 (the blue Moving Average line). This would start to validate the upward move. Bearish Signal: A daily close below $0.0470 would invalidate the support and likely lead to a further drop.
Market insights
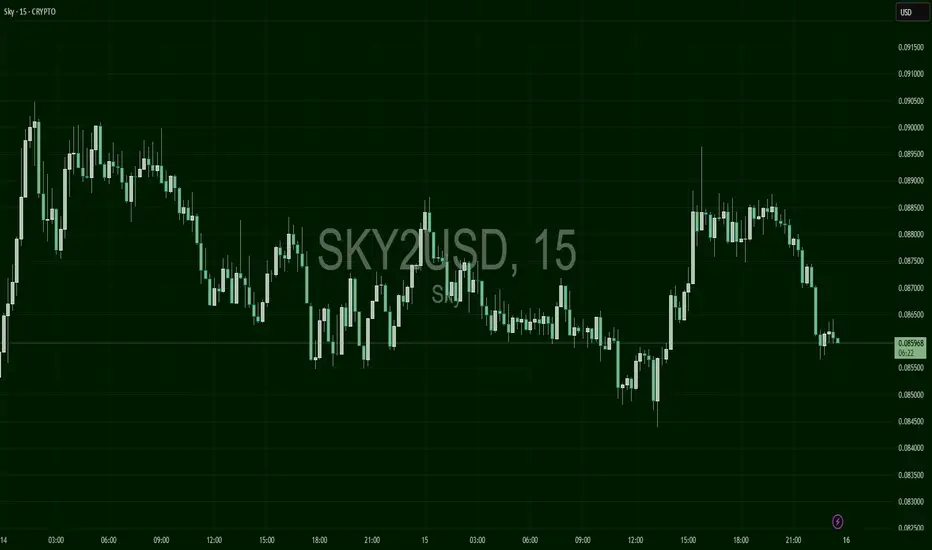
SKY2USD – Flatline BounceSKY2 maintained a tight range across most of the chart, but it spiked upward late in the session before falling back. Current bias remains directionless.
SKY - we are approaching a big breakout !Price is inside a bullish ascending wedge.
Volume is rising.
Historic volatility funnel is telling that liquidity is coming back big time.
In my view we are approaching a big break out !!

SkyCoin - a top performer !!Since my last post where I gave an "immaculate entry point" at 76 cents, SkyCoin has been one of my top performers:
SKY is up 103 % in 18 trading days !!
After a false breakdown from the bullish wedge it has hit support and made a powerful "around-the-apex" move !!
Right now it is battling with some resistance at 1.52 - 1.54....
But it could very well break through that directly !!
This coin is SEVERELY undervalued, GROSSLY underrated and ASTONISHINGLY unknown in the digital asset space !!
It could go SKY high !

Why I bought more SKYCOIN tonight !!SkyCoin is an extremely underrated project !! Actually rank 729 on CoinMarketCap and 17 Million MC.
It has several working products and their team has never stopped working during the entire bear market from 2018 until 2021 !!
Go have a look at their website: SkyCoin platform, SkyWire decentralized internet, Obelisk new consensus algorithm, Fiber peer-chain architecture, CX a custom-built programming language, CXO peer-to-peer cloud storage service, SkyMinter hardware, SkyMessenger encrypted messaging service, ....
Their work has been impressive until now !!
They believe in what they do and do not spend precious resources in marketing efforts.
Time will come when they will come out of the woods and promote their products when mass adoption comes.
The Legend John McAfee had a SKYCOIN tattoo painted on his back !! He must at some time had a very strong feeling on this project !
Technically SKY is bouncing on a very important support at the 0.764 level (green dashed line).
On the beginning of February price jumped quickly from 0.5 USD to over 18 USD in a matter of 5 days !!! ATH was around 50 USD; so the upside potential is important.
Price has since then come back to test the breakout point between 0.76 and 0.91 USD and will likely bounce on the apex of the yellow ascending triangle before taking off again.
I seized the opportunity to load on SkyCoin tokens and more than doubled my long term position !
Time will tell if and when price catches up with SkyCoins outstanding fundamentals ....


skycoin zoneslove seeming them drag a coin price action down
opportunity always in your face
r/r 7
enjoy
Stake, yield skycoin for skycoinhours on skycoin wallet


SKYthe movements of SKY seem to me to be delimited by the boundaries of a triangle where the level in area 2 usdt is functioning as a support, for now I would be waiting for an approach to the support or resistance lines or a I would wait a possible brekkout


BuyD1 candle if close bullish above 4.15 will confirm support and good to buy , 1st target next 7.6-8
===Technical analysis not considering any fundamental ===
===Not a financial advice Don’t follow blindly ===

SKYUSD PUMP COMINGSKY is one of the coins we have recently added to our investment portfolio, we are currently up about 40% and has broke above daily resistance and we are now retesting it as support... price should reject here and see a nice continuation to the upside.

SKY should start flyingSKY correction looks over. Broken above one trendline, almost the other. The buyers are starting to come back and this could mean a crazy breakout.


SKYUSDReffer to my last chart!
Beautiful cup and handle setup
if your in crypto and your not buying this, what are you even doing here!!
im not one to care so much about skycoin as a project, it looks decent, not very good marketing but surley throw something at this!
stop relying on those stupid pump signals who charge you to be in a group
recognize patterns and market direction, be patient and only trade on nice setups and you will never fail.


SKYUSD Recent Price ActionThis is just a simple support resistance style chart with Skycoin price action from the last month. The lines are drawn from my script but I added one more at 5 which relates to a fibonacci level created from a spike just a short time before the time this chart shows. This is simply just a level I am watching that relates to a retracement from a previous spike in price.

Skycoin - you ready?While bitcoin is painting inverse head and shoulders, skycoin could be finally ready.

SKYUSDOne of the best looking crypto charts right now to enter,
This coin does not need much to moon as the volume per 24h is very low,
been on a downtrend with nice shape heading into a short squeeze, expecting to breakout in 2-3 days if btc behaves

Skycoin is ready for sky or moonUnwyred Internet service is launching in Australia, based on Skycoin technology.
VPN is about to be released.
More exciting stuff coming!

SKYCOIN/USD LONG Hold - SetupSKYCOIN/USD Crypto Setup LONG BUY.
🔮 Daily and 4 Hour BULLISH Gartley.
🔮 Pattern (corrective) occurring after a bullish run up (impulsive) which broke above CRTICIAL SUPPORT/RESISTANCE.
🔮 Broken above Resistance and now testing it as Support to confirm uptrend.
🔮 Bullish Gartley Pattern Completion occurring at the CRITICAL SUPPORT which once broke as resistance.
🔮 Daily Hidden Divergence forming along with further confluence on the 4hour with potential Hidden and classic divergence.
🔮 4 hour & 1 hour forming potential double bottom at reversal zone. The alternate to the double bottom here is that it’s turning into a 5 wave wedge, very slightly lower than the double bottom position, yet exactly at our final destination, being the D point of our Bullish Gartley. 3 touches on the falling wedge, high probability of a bullish breakout of the wedge imminent.
🔮 Looking for bullish movement and breaks of bearish structure to confirm bullish momentum and bullish trend resumption. Want bullish movement with a break of the previous lower high on the 4 hour for added confirmation along with a break above the blue downward sloping supply line for even further confirmation.
These bullish movements will turn the oscillators positive as bullish momentum kicks in and takes this market higher.
🔮 Harmonic Pattern Completion - Price now bouncing up with bullish price action. Price has broken back ABOVE the CRITICAL SUPPORT/RESISTANCE.
Entry: At Market (non-leveraged) currently $1.9840
Take profit 1: $18
Take Profit 2: $44
Longer term holds in confluence with the MACRO bullish market of the Crypto Currency boom. Macro Analysis may come in the future when i get more time.
Please like, follow and share if you like enjoyed this analysis :) thanks!

# Sky/USDHi everyone...
SKY, H1
As you can see, the price of the SKY had increased dramatically after breaking the consolidation zone. Then, it decreased to the 50% of the Fibo level. Now, by breaking out the downtrend line, I guess it can reach to the marked zone in the chart.
Please send me your ideas about this coin.

Skycoin should get a bounce here, target 1 and 1.6 fib extensionWith VPN coming, and CX 1.0 coding language about to release, Skycoin will become the platform on which decentralized social media and internet 3.0 will be built.
