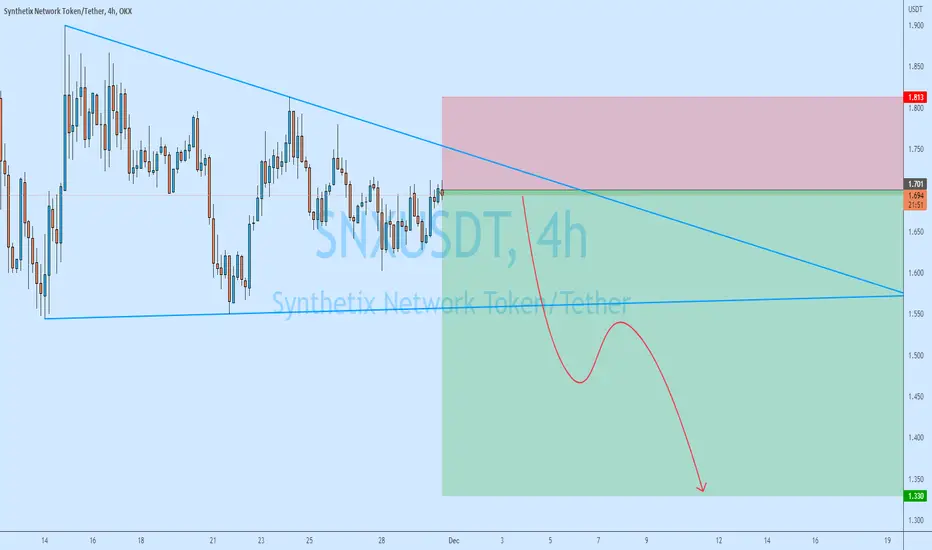
SNXUSDT | SETUPSNX has been trading in a bearish trend .
The price has now broken above the falling resistance.
The price is now approaching to the horizontal resistance.
The bulls need to break above the resistance
Manage your trades accordingly.
Market insights

SNXUSDTRisk warning, disclaimer: the above is a personal market judgment based on published information and historical chart data on Tradingview, all analysis is only subjective. Hope investors consider, that I am not responsible for your investment decision.
Thank you.
Good luck

$SNX #SNX | LTF LONGIn case of a retest (preferably $1.61) on the lower support, bullish evidence can be chased in 1H.

SNX USDT 15 mins ICT Concept In 15 mins TF Market grab the liquidity and created choch and created a OB where market might fall after grabbing all the orders left.

SNX Short Chance for another Leg Down!!Here is another SNX/USDT Chance for Short Position, In the continuation of the sales transactions we had, a middle correction towards the Fibonacci specified in the image is possible, and by completing this correction, we can re-enter the selling position from the specified ranges towards the lower targets.
Pay attention that this movement can take a day or two, but the Fibonacci range is important for entry!! Friends who own the currency can accompany it in advance because there is a possibility that Fibo will not be seen and return from the current limits, but these ranges are for opening. Making a new position does not give us good risk and reward, so friends who are looking for a new position should wait until we enter the position at least in the 38% Fibonacci range 📊

#Synthetix is down 60% from H2 Highs, SNX Support at $1.76Past Performance of Synthetix
Synthetix remains under significant selling pressure. As an illustration, the token is down roughly 60 percent from H2 2022 peaks. Overall, SNX bulls have been struggling to add to their longs following the break above the bear flag in late November. Presently, clear support levels lie at $1.56 and $1.76, respectively.
#Synthetix Technical Analysis
SNX bears are in command from a top-down preview. In the short term, however, bulls appear to be in control inside a bull flag shaped by the November 30 bar. Though prices broke higher in a bullish continuation formation, there was no follow-through as SNX remains in range. The immediate resistance is at $2.05, marking November highs. Ideally, traders can buy the dip at spot rates if prices are above $1.76. Alternatively, conservative traders can buy once there is a breakout above $2.05 with equal trading volumes as those of November 30. In that case, SNX may float to $2.16 on November 9 and even $2.80 marking November highs.
What to Expect from #SNX?
SNX remains under pressure and in consolidation. Though the broader crypto market is bottoming up, there must be assurance in the SNX price action before traders commit. For now, prices are inside a bull flag set in motion by November 30 bullish engulfing bar, placing buyers in control in the short term.
Resistance level to watch out for: $2.05
Support level to watch out for: $1.76
Disclaimer: Opinions expressed are not investment advice. Do your research.

SNX continuation of growthHi everyone,
I will appreciate for ur activity. Thank you!
We are still in the ascending channel, I think that the growth will continue.
Targets: 2.05 and 2.15
Stop: 1.75
RR: 1 to 2
I hope my work suits you and you are satisfied.
DYOR!

SNX flying highYou know, SNX is currently oscillating in the value zone, There are a lot of support and resistance lines here. I analyzed SNX before and we are profitable now. This analysis only reinforces the previous analysis and can give you a new entry point.

short SNX$SNX broke through the bullish trendline and the support level. Decline to support level at $1.7 is likely to happen.

SNXIdea: The price forms a “cup and handle” pattern. The price failed to break the daily 50 MAs on the first attempt and started a correction that could form a pattern handle, then the uptrend will continue

Synthetix Network Token | Easy 111%+ PotentialHere is a pair before the bullish breakout... Synthetix Network Token (SNXUSDT).
For this pair, we have a higher low compared to June but still trading below EMA50.
Since we've seen how the other altcoins are moving, we know that SNXUSDT will follow, or at least we can make this inferrence from the chart signals.
Or we can say this is a setup with low risk (tight stop-loss) and a high potential for reward.
Synthetix Network Token can easily grow over 100% on its next bullish wave.
There can always be more of course, I am being conservative.
Thank you for reading.
Namaste.


#Synthetix Buyers Upbeat but SNX Inside a Bear FlagPast Performance of Synthetix
Synthetix is inches away from November and 2022 lows. SNX remains under pressure, looking at the performance in the daily chart. Presently, the token is trending inside a bear flag and within the November 8 and 9 bear candlestick. For the uptrend to take shape and SNX bulls to be relieved there must be a close above $1.85 and the flag with decent trading volumes.
#Synthetix Technical Analysis
SNX prices have support at $1.57, the base of the current bear flag, flashing with November 2022 lows. Unless there is a decisive follow-through, sellers have the upper hand, pushing SNX prices above $1.82 towards November 9 highs at $2.15, the immediate resistance level. A skeptical formation is the absence of participation, thrusting prices to spot rates with higher highs relative to the lower BB. Accordingly, aggressive traders can look to short and swing. Meanwhile, conservative, risk-on traders can wait for clear breakouts before riding the emerging trend. Losses below $1.57 may see SNX dump to $1.42.
What to Expect from #SNX?
Bulls are buoyant, but SNX remains within a bear formation. The short-term trajectory depends on whether bears will flow back, forcing the token below the triangle; or bulls flowing back, thrusting SNX above the bear flag back to November 9 highs.
Resistance level to watch out for: $1.82
Support level to watch out for: $1.57
Disclaimer: Opinions expressed are not investment advice. Do your research.

SNXUSDT selling todaySNX can drop anywhere from 20 to 50% starting tomorrow. The crypto winter is getting much colder.
SNXUSDT | WATCHOUT LEVELSNXUSDT has been trading with in a symmetrical triangle.
The price has been converged.
Now it is trading near higher side of triangle.
The bulls need to break above the triangle for further upside trend.
Manage your trades accordingly.


SNXUSDTdecent r/r here also if this thing turns into a triple bottom ihs
would take an upwards impuls from btc spx prolly
just a clean cfork


SNX LONGBought for 7% of snx deposit
Fundamental:
A few reasons
1) returned to the zone of interest
2) launch kwenta (exchange) on snx
3) the main thing is that snx restarted atomic swaps integrated into crv, 1inch in the summer it gave an additional commission to stakers and x3 in the price in the summer (for a couple of days)
On the technical side, we have a channel with a double bottom.
I also marked you on the chart areas of support and resistance.
Cancellation of the scenario will fix below $1.42
I expect a trip to the $ 2.72 zone, after which I will update the idea.
I'm waiting for your comments on my idea, I'm very interested in your opinion.

SNXUSDT (4H) - Bearish wave LTFHi Traders
SNXUSDT (4H Timeframe)
A High probability, entry signal to go SHORT will be given with the downward break of 1.73 after the market found resistance at 1.97. Only the upward break of 1.97 would cancel the bearish scenario.
Trade details
Entry: 1.73
Stop loss: 1.97
Take profit 1: 1.29
Take profit 2: 1.01
Score: 7
Strategy: Bearish wave LTF

SNXUSDT | BUYERS ZONESNXUSDT has been trading in a bearish trend . The price has been making lower lows and lower highs.
Now after breaking some major support, price has approached to strong horizontal support zone .
The price has printed bullish divergence on RSI too.
. The bulls can take control from here.
Manage your levels accordingly.

rr:2.16 buye ideabullish shark harmonic pattern
falling parallel channel
rsi divergence
tp strong resistance
