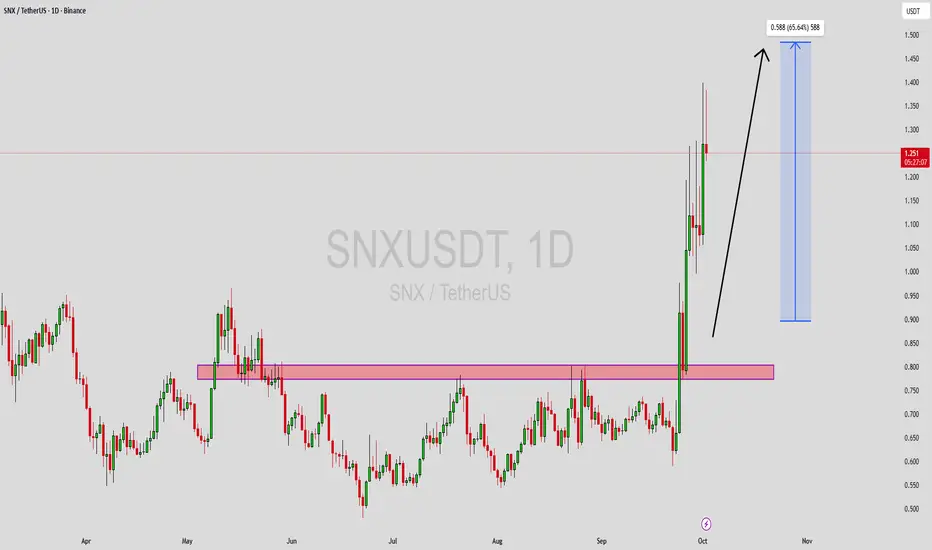
SNXUSDT Forming Bullish MomentumSNXUSDT has recently shown a strong bullish breakout, pushing above its key resistance zone with solid momentum and good trading volume. This breakout suggests that the pair could continue its upward trajectory, with expectations pointing towards a potential 40% to 50% gain in the coming sessions. The market structure is favoring the bulls, and the consistent buyer interest indicates growing confidence in this project.
The chart highlights how SNX has reclaimed a critical price level that had previously acted as resistance. Holding above this zone strengthens the bullish outlook, as it confirms that investors are actively accumulating positions. With healthy liquidity and rising participation, this setup aligns well with the technical breakout structure.
Investor sentiment is also improving, and the potential upside remains strong if volume continues to support the current rally. As long as the price sustains above support levels, SNXUSDT could become one of the more attractive plays in the current crypto market environment.
✅ Show your support by hitting the like button and
✅ Leaving a comment below! (What is You opinion about this Coin)
Your feedback and engagement keep me inspired to share more insightful market analysis with you!
Market insights
SNS UpdateJournal Entry #9.1
It is a waiting game indeed. following with a decent stoploss.
The chart shows a breakdown with indicators moving down.

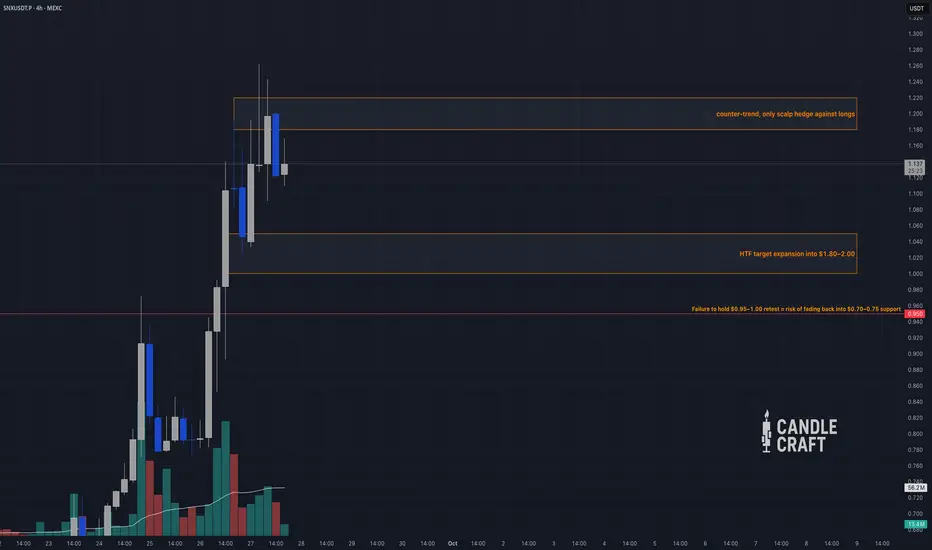
SNX Market Report — Expansion or Exhaustion?After months of compression, Synthetix (SNX) just delivered a breakout candle of unusual size. Price ripped from $0.60 lows to a $1.15 tag in a matter of sessions, shifting sentiment from dormancy to acceleration.
The backdrop:
• HTF resistance sits overhead at $1.20–1.35 — the last breakdown area.
• A reclaim here on volume projects $1.80–2.00 as the expansion target.
• Failure to sustain $0.95–1.00 retests risks dragging price back into $0.70–0.75.
Momentum reads:
• Open interest ballooned +30% in two days, but funding remains neutral. This isn’t yet the frothy late-stage push.
• Spot CVD prints positive — confirming that the bid isn’t just leveraged fuel, but real inflow.
• Short liquidations have been cleared into $1.15; fresh long liquidity now builds below $0.95.
Market path:
• Bullish: Pullback into $1.00–1.05 POC cluster holds → $1.20–1.35 retest, with room toward $1.80.
• Bearish: Rejection at $1.20–1.22 sends price back to $1.05 or even the inefficiency gap at $0.90.
Scalp Playbook:
🟢 Long setup: $1.00–1.05 entry, stop $0.88, targets $1.20 → $1.35 → $1.80. (~3.5:1 RR)
🔴 Short hedge: $1.18–1.22 entry, stop $1.30, targets $1.05 → $0.90. (~2.5:1 RR)
Bottom line:
SNX is no longer dormant — the expansion is real. Whether it becomes a sustainable cycle or burns out at $1.20 will depend on how the next retest resolves.
⚔️ Candle Craft | Signal. Structure. Execution.
SNX is cooling down?? What!Journal Entry #9
After a strong pump, SNX is cooling down.
It has shown a bearish divergence
Waiting for it to show further signs of weakness
it still a waiting game. Posting it since its on my Watchlist.

SNXUSDT 1D#SNX is moving inside a symmetrical triangle on the daily chart. It has broken above the daily SMA50, and volume has increased recently, which is great. A breakout above the triangle resistance is approaching. If that happens, the potential targets are:
🎯 $0.849
🎯 $0.963
🎯 $1.076
🎯 $1.238
🎯 $1.445
⚠️ Always remember to use a tight stop-loss and follow proper risk management.

SNXUSDT — Pinned at the 0.66 FulcrumSNX price keeps orbiting 0.66 — rallies fade near 0.70, dips hold 0.64. Let’s break down the levels before a real move shows up.
High Timeframes (Weekly → 2D → 12H)
– Weekly: Basing 0.58–0.75 after Q4’24 downtrend. Supply 0.72–0.78; demand 0.58–0.62.
– 2D: Lower-highs since Aug, compressing under 0.70. Resistance 0.70–0.72, support 0.64–0.66 → 0.62–0.63.
– 12H: Range 0.64–0.70. Close >0.70 → upside 0.72–0.75. Close <0.64 → 0.62–0.63, extension 0.60.
Orderflow / Profile
– POC ~0.660.
– VAL 0.652–0.654, VAH 0.676–0.678.
– Sellers leaning at VAH, buyers defend 0.64–0.65 → price stuck around POC.
Derivatives
– OI soft, funding ~0, CVD down.
– Light liquidations.
Inter-Market
– BTC mid-range, DeFi mixed. SNX remains heavy until reclaim ≥0.70.
Conclusion
SNX price is stuck at 0.66. Above 0.70 = 0.72–0.75. Below 0.64 = slide to 0.62–0.63, bigger shelf at 0.58–0.62.
💡 Pro Tip: In tight ranges like this, grid bots turn chop into profits by automating buy-low/sell-high rotations until breakout.
Candle Craft | Signal. Structure. Execution.

SNX ; BEARISH!!!Hello friends
Given the growth we had, you can now see that the price ended the trend at the ceiling of a large candle and the sellers covered it with another large candle.
Now we have a resistance area in the middle of this candle from which the price is expected to correct and move to the specified targets.
*Trade safely with us*

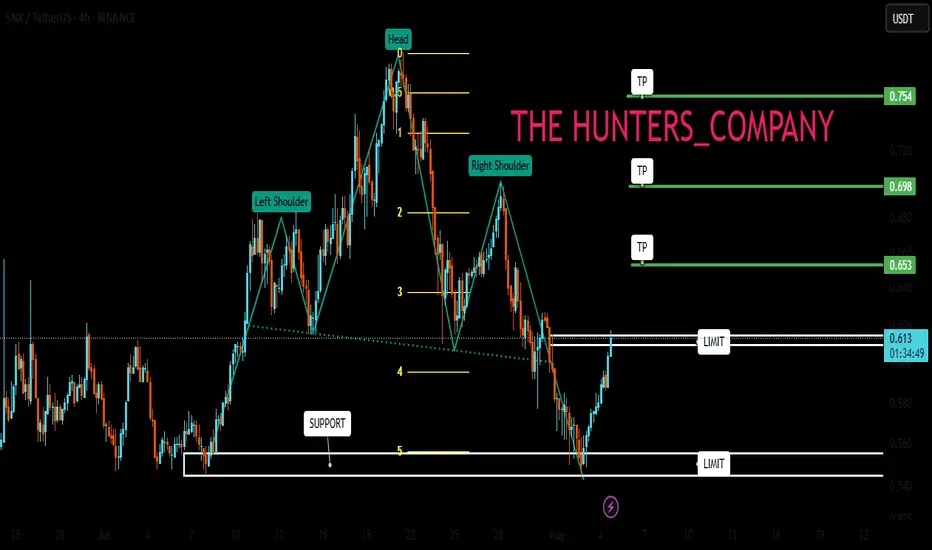
SNX : Has the climb started?Hello friends🙌
👀According to the shoulder and shoulder pattern that was formed and then the price fell in the support area that we identified for you with Fibonacci, buyers entered and provided good support for the price, which also broke our resistance, which creates a good opportunity to buy, of course with risk and capital management.
🔥Follow us for more signals🔥
*Trade safely with us*
SNXUSDT 1D#SNX had a strong bullish rally after breaking out of the falling wedge. It is now in a corrective phase, and the support zone at $0.712–$0.661 is a good area to consider buying — especially since the daily SMA100 is within this zone.
In case of a deeper dip, we’ll look to buy around $0.594.
If a successful bounce occurs, the targets are:
🎯 $0.910
🎯 $1.043
🎯 $1.176
🎯 $1.365
🎯 $1.606
⚠️ Always use a tight stop-loss and practice proper risk management.

SNXUSDT Breakout Alert! Are We Witnessing the Early Stages?📌 🔍 Overview:
After months of relentless downward pressure, SNX has finally shown a strong technical breakout. The price has decisively broken above the long-term descending trendline, signaling a potential shift in structure from bearish to bullish. This could mark the beginning of a significant impulse wave to the upside.
📐 📊 Technical Structure & Key Pattern Breakdown:
🔻 Broken Downtrend Line: Price action has successfully broken above a descending trendline that has been in place since December 2024, effectively ending the bearish dominance.
🔺 Falling Wedge Pattern: A classic falling wedge has formed and recently completed with a confirmed breakout — a bullish reversal pattern that often precedes strong upside momentum.
🟨 Accumulation Zone (Base Support): The yellow box between $0.60 – $0.72 acted as a major accumulation zone and now flips into a strong demand/support area.
📈 Higher Lows Structure: The recent structure of higher lows signals a shift in market sentiment, showing early signs of accumulation and bullish interest.
✅ Bullish Scenario (Upside Continuation):
If price holds above the breakout zone and confirms strength:
🎯 Target 1: $0.938 (key horizontal resistance)
🎯 Target 2: $1.042 – $1.100 (historical resistance zone)
🎯 Target 3: $1.248 – $1.625
🎯 Target 4 (Mid-term rally): $1.966 – $2.197
🏁 Final Bullish Target (Longer term): $3.372 – $3.686
A strong continuation would require confirmation via increased trading volume and bullish momentum from the broader crypto market.
❌ Bearish Scenario (Failed Retest or Rejection):
However, if the price fails to sustain above the breakout level:
🚨 Risk of a false breakout emerges if price falls back below $0.724
🔻 Breakdown of the yellow support box could trigger a deeper correction toward:
Support 1: $0.60
Support 2 (Major Low): $0.480
This would form a classic bull trap and extend the consolidation phase.
⚠️ Validation & Risk Considerations:
Volume confirmation is key. A breakout without rising volume may lack follow-through.
Watch closely for price action in the coming days — will it hold above the breakout zone or fall back?
Strategy: Look for retest entries or enter with partial exposure, using tight risk management.
🧠 Conclusion:
SNXUSDT is at a pivotal turning point. The breakout from a falling wedge pattern combined with higher low formations is a textbook bullish reversal setup. If price holds and buyers step in, we may be witnessing the early stages of a major bull run for SNX.
#SNXUSDT #SNXBreakout #AltcoinSetup #BullishReversal #FallingWedge #CryptoSignals #CryptoTrading #ChartAnalysis #PriceAction

SNX/USDT | Long | Synthetic Derivatives| (July 2025)SNX/USDT | Long | Synthetic Derivatives Rebound with DAO-Driven Growth | (July 2025)
1️⃣ Short Insight Summary
SNX is showing signs of strength again with Perps V2 expanding and DAO governance maturing. With inflation removed and rewards now tied to protocol fees, real usage is starting to reflect in price. Recent gains and strong structure suggest a possible continuation.
2️⃣ Trade Parameters
Bias: Long
Entry: Current zone around $0.75–$0.77
Stop Loss: $0.43 (structural invalidation, below consolidation)
TP1: $0.91
TP2: $1.15–$1.18
TP3: $1.35
TP Final: $2.00+ (longer-term if synthetic derivatives adoption continues)
Partial Exits: At each level to reduce risk and lock in profits
3️⃣ Key Notes
✅ SNX recently gained ~17% in a week on growing DeFi activity and interest in leveraged synthetics
✅ No more inflation — staking rewards now come from real usage, making SNX more sustainable
✅ DAO governance has matured with Spartan Council and Perps V2 rollout, making the project more nimble
❌ Synthetic derivatives are complex—new users may struggle with onboarding
❌ Regulatory risk remains around derivative products and stable synthetic assets
❌ Reliance on oracle performance means smart-contract integrity is critical
4️⃣ Optional Follow-up Note
Watching for a clean breakout above $0.91. If volume confirms, I’ll consider adjusting targets upward and reviewing the setup again.
Please LIKE 👍, FOLLOW ✅, SHARE 🙌 and COMMENT ✍ if you enjoy this idea! Also share your ideas and charts in the comments section below! This is best way to keep it relevant, support us, keep the content here free and allow the idea to reach as many people as possible.
Disclaimer: This is not a financial advise. Always conduct your own research. This content may include enhancements made using AI.

SNXUSDT UPDATE
Pattern: Falling Wedge Breakout
Current Price: \$0.605
Target Price: \$0.95
Target % Gain: 60.31%
Technical Analysis: SNX has broken out of a falling wedge on the 12H chart, signaling a bullish reversal. The breakout is confirmed with strong green candles, indicating momentum buildup and a potential rally toward the target.
Time Frame: 12H
Risk Management Tip: Always use proper risk management.

SNX/USDT Short-Term Trade | Entry at 0.627 with Clear TargetsMidterm/Intra-day Setup
This is an intra-day (midterm) trading setup.
Entry Price: 0.627
Take Profits (TPs): Refer to the marked levels on the screen for target points.
Stay disciplined and manage your risk accordingly.

SNXUSDT Tracking Final Leg of Downtrend or Reversal SetupSNXUSDT remains in a downtrend despite breaking its trendline, with price action still dipping. The current focus is on the potential completion of Wave 5, targeting the projected re-accumulation zone but this setup only activates if $0.548 support breaks.
If this level holds, a rebound could drive price toward the upside targets already outlined. On the flip side, a sudden breakout above $0.96 would invalidate the drop scenario entirely.
What’s your take on this structure? Drop your thoughts below

SNX About to Explode or Collapse?Yello Paradisers, are you watching SNXUSDT closely? Because if not, you might be missing one of the cleanest opportunities for bulls in this current market cycle. The setup is forming right at a critical decision point — and how price reacts here could define the next major move.
💎SNXUSDT is currently showing a bullish internal CHoCH (Change of Character) while trading directly inside a strong support zone. This zone isn’t just standing alone — it’s backed by the powerful 200 EMA and a well-respected support trendline. This confluence of support significantly increases the probability of a bullish bounce from this level, making it a high-reward setup for those paying attention.
💎Zooming out to the higher timeframe, the structure becomes even more interesting. SNXUSDT appears to be forming a bull flag pattern — a bullish continuation signal that often precedes explosive upside moves. When such a formation aligns with key support zones, it suggests that the market is simply consolidating before the next leg up.
💎However, traders must proceed with caution. If price breaks down and closes below the current support zone, this would invalidate the entire bullish scenario. In such a case, it’s best to step aside and wait for better confirmation rather than rushing into a compromised setup. Emotional decisions are the fastest way to ruin sound trading strategies.
🎖Strive for consistency, not quick profits. Treat the market as a businessman, not as a gambler. Discipline, patience, and strategic entries will always outperform emotional trades. Stay focused, Paradisers — the opportunity will always favor those who are prepared.
MyCryptoParadise
iFeel the success🌴

SNXUSDT 1D Analysis SNX ~ 1D Analysis
#SNX Buy after successfully breaking this resistance line with a short term target of at least 15%+ from here.

#SNX/USDT#SNX
The price is moving within a descending channel on the 1-hour frame, adhering well to it, and is heading for a strong breakout and retest.
We are seeing a bounce from the lower boundary of the descending channel, which is support at 0.827.
We have a downtrend on the RSI indicator that is about to break and retest, supporting the upward trend.
We are looking for stability above the 100 moving average.
Entry price: 0.880
First target: 0.900
Second target: 0.943
Third target: 0.977

SNX LONGgood fundamentals, broke higher timeframe counter trend line, activated a inverted H&S, created a valid HL testing the Counter Trendline, and showed bullish divergence in H1 Tf.

#SNX/USDT#SNX
The price is moving within a descending channel on the 1-hour frame, adhering well to it, and is heading for a strong breakout and retest.
We are seeing a bounce from the lower boundary of the descending channel, which is support at 0.711.
We are seeing a downtrend on the RSI indicator that is about to break and retest, supporting the upward trend.
We are looking for stability above the 100 Moving Average.
Entry price: 0.744
First target: 0.765
Second target: 0.785
Third target: 0.811

SNXUSDT Bouncing from Channel SupportSNXUSDT Technical analysis update
SNXUSDT has been trading inside a clear descending channel for the last 1700 days. Recently, the price touched the lower support of the channel and is now showing signs of a bounce.
If the current momentum continues, SNX could move upward toward the upper resistance of the channel. A breakout above the upper trendline would be a strong bullish signal. Until then, the price may stay within the channel.
Price could move 100%-250% in a few months.

SNX Analysis (1D)SNX has broken an old trigger line and is also forming a CP within a channel.
We are looking for buy/long positions in the Demand zone.
Targets are marked on the chart.
A daily candle closing below the invalidation level will invalidate this analysis.
Do not enter the position without capital management and stop setting
Comment if you have any questions
thank you

Is SNXUSDT About to Make a Big Move? Yello, Paradisers! SNXUSDT has shown an ideal retracement, setting up a high probability for a bullish bounce from the current support zone.
💎There’s potential for a W-pattern formation here. If the price successfully breaks out and closes candle above the resistance level, this would significantly increase the likelihood of a bullish continuation.
💎However, while a bullish move is possible, the probability at this stage is relatively low, making it a scenario worth watching but not acting on just yet.
💎If panic selling or a deeper retracement occurs, the strong support zone below may offer a favorable bounce. To increase confidence in this setup, we need to see a bullish I-CHoCH (internal change of character) on lower timeframes.
💎On the flip side, if SNXUSDT breaks down and closes candle below the strong support zone, the bullish thesis will be invalidated. In that case, it’s best to remain patient and wait for more favorable price action to develop.
🎖Always remember, Paradisers, discipline and patience are the keys to consistent profitability. Avoid making emotional decisions and stick to your strategy. The market rewards the patient!
MyCryptoParadise
iFeel the success🌴

SNX Finding SupportKey to watch for SNX is around 1.1
when in this range is good to buy because this is area of last support
maybe if we do more wide range is around 0.9-1.1
