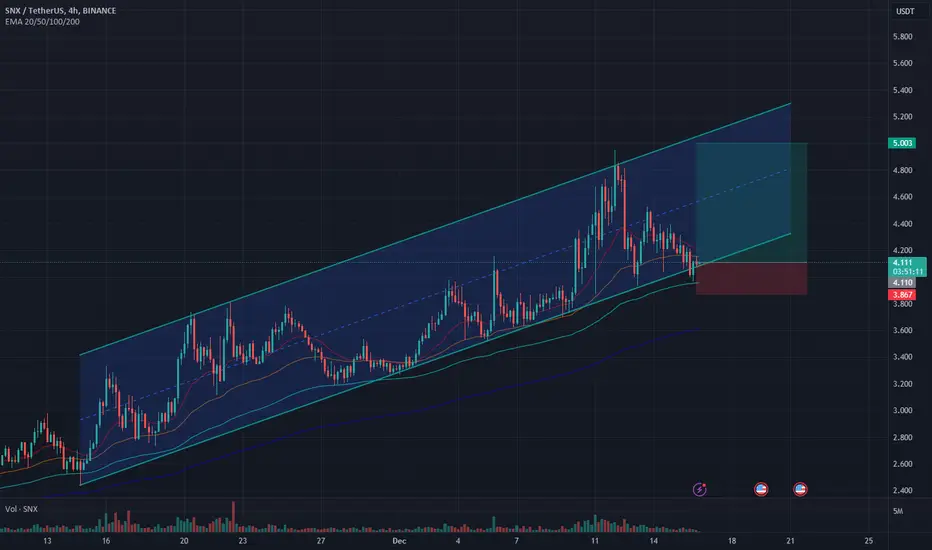
SNX ANALYSIS (4H)On the chart, from where we entered "START", we seem to see a correction.
This correction seems to be a diametric.
There was a suitable place for the termination of the F wave on the chart, which we marked with red color.
If the price reaches this range, you can enter a sell/short position.
For risk management, please don't forget stop loss and capital management
When we reach the first target, save some profit and then change the stop to entry
Comment if you have any questions
Thank You
Market insights

SNXUSDT 6HFalling wedge breakout has already done on 6H chart, but it is facing with EMA200 and horizontal resistance at $3.423 now. In case of breakout the EMA200 it can reach to $3.783 and $4.23
Final target is $4.951 on this setup

Potential projects:Our next guest is SNXBINANCE:SNXUSDT BINANCE:SNXBTC
Technical: Patterns on the chart.Yeah the project has potential and good to invest as well.✅
Fundamental: Synthetix weekly trading volumes surpassed $1 billion, overtaking decentralized derivatives exchange GMX to become the second-most active platform.✅
Sentiment:Popular coin on social media(x,YouTube,etc..)✅

snx looking strong Trend Is Already Up And Correcting After Solid Gains Now Seems Like Preparing To Continue Its Uptrend Expecting Solid Recovery In Coming Days
Consolidating In Falling Wedge In 8h Timeframe & Approaching Towards Descending Trend line Incase Of Breakout Expecting Massive Bullish Rally Towards 5$ In Coming Days

Snx bull flag + bat patternAs u can see snx formed bull flag plus bat pattern takin a sniper entry at thr zone u see in the chart

SNXUSDT - BULLISH OUTLOOKSNXUSDT is exhibiting a bullish divergence on the 1-hour (1H) time frame, signaling a potential bullish reversal. This divergence suggests a weakening of the prevailing downtrend and hints at a possible shift towards an upward trajectory.
For traders contemplating a position, the following trading strategy is suggested:
Entry: Consider initiating a long position using a Buy Stop order at the price level of 3.42.
Stop Loss (SL): Implement a risk management Stop Loss order at 3.08.
Take Profit (TP): Set take-profit levels to achieve a 1:1 and 1:2 risk-reward ratio:
TP1 = 3.76
TP2 = 4.10
This trading strategy aims to capitalize on the anticipated bullish reversal. However, it is crucial to closely monitor the market for any changes in price action and be prepared to adjust the strategy accordingly.


SNXUSDT Elliott Waves AnalysisHello friends.
Please support my work by clicking the LIKE button👍(If you liked). Also i will appreciate for ur activity. Thank you!
Everything on the chart.
Entry: Market and lower
Target: 5.5 - 7 - 8.2
after first target reached move ur stop to breakeven
Stop: (depending of ur risk). ALWAYS follow ur RM .
risk is justified
Good luck everyone!
Follow me on TRADINGView, if you don't want to miss my next analysis or signals.
It's not financial advice.
Dont Forget, always make your own research before to trade my ideas!
Open to any questions and suggestions

SNXUSDT_N9SNXUSDT
En: 3.797 (Ignore 3.687)
Sl: 4.062
Tp1: 3.080
Cancel if crossed without opening: 3.400
#45Min_trade
#N9

SNXUSDTThe price has descended beneath the Kumo Cloud, subsequently breaking and retesting Span B, a notable resistance level. The Kumo Cloud exhibits a bearish trend, complemented by a unanimous alignment of moving averages confirming the shift in market direction.


$SNX - whats nextSignificant moves by BINANCE:SNXUSDT driven by protocol decision to end token inflation - However after passing through heavy long term resistance band (Blue box) failed to take next resistance level...
Since then has been in a conjoining wedge - as fails to make headway in either direction -
How I'm trading this:
1) Watch to see declining volumes on a flattening baseline -> then either play the breakout (medium risk - higher possible returns) - or assume a retest of trend and buy a few pips north of it....

SNXUSDT Analysis: Upward Momentum Imminent!With SNXUSDT currently at $3.805, positive indicators suggest a potential upward surge. Key trends in moving averages and RSI point to favorable conditions, hinting at an upcoming bullish movement. 📈 #SNXUSDT #UpwardTrend

SNX/USDT bullish horizons from Demand Zone? 👀🚀 SNX Analysis💎 Paradisers, let’s zoom in on #SNXUSDT as it’s exhibiting a pivotal market behavior. SNX is currently nestled in a demand zone, poised for another assault on a key resistance area.
💎 #SNX recently faced a setback at the resistance level of $4.964. Presently, it's regaining strength in the demand zone. If it can maintain this upward momentum, we could see an ambitious push towards the significant resistance level at $6.006.
💎 Nonetheless, navigating the unpredictable crypto market demands flexibility in strategy. If #SNX struggles to keep above the $3.806 demand level, a strategic rethink may be required.
💎This scenario might see us anticipating a bullish recovery from a lower support at $3.227. Importantly, if NYSE:SNX slips below this crucial support, it could be a harbinger of a bearish trend.

Pullback for Short PositionOn 4h TF
I see a pullback with low volume reaching up to range 4.1 - 4.3
I think this range is potential short zone
So wait for reject at this range
Time will tell

SNX LongKeep your trading simple 🚀🚀🚀
Long SNX 30Min trend continuation trade.
First target: 1:1
Exit: Trend reversal/stop
Not a financial advice just my tradingview - trade smart trade safe.
Follow me to support my work, Thanks!

🔥SNX Trying to Break 1-year Channel: What Are The Targets❓🔥SNX is the top gainer and grow for 2 months straight. Now the chart shows that SNX doesn't have enough power for the futher growth. Only the breakout of the channel and test it as the support will confirms the bull power.
Possible that price can fall to the middle of the channel. I think that it will be a good entry point in long. You need to pay attention on Bitcoin of course to make the right decision.
💥The 2 targets are on chart. Enjoy it!
like❤️ and follow

SNX testing the channel bottomIf it can get support from here, we can see a nice rise. It can be tried with a tight stop-loss. If it rises, I plan to sell half of the position at mid-channel resistance and the rest at 5. DYOR
#SNXIn the 1-hour and 4-hour timeframes, there is a concentration in a corner, which can return to the specified supply area if the dynamic trigger line is broken. If the range of the blue line is broken, you can continue the correction up to the specified area, which can correct 100% of the previous wave.

USDT/SNX BYBIT LONG 2H usdt/snx bybit long.
This is a short term trade.
When taking profit, put stop-loss up to gain even if it were to fall down.
5x-10x leverage

SNX LONG usdt/snx bybit long.
This is a short term trade.
When taking profit, put stop-loss up to gain even if it were to fall down.
5x-10x leverage

SNX longSNX bounced off the ascending trendline and bounced off the support level. Bullish movement to resistance level at 4.95 is expected to happen.
