SOL/USD Forecast:Range Breakdown Risk as Bears Target 100 and 75SOL/USD remains inside a medium-term descending channel, while price action since mid-last month has compressed into a sideways range between 125.00 and 150.00 (Murray – ).
Price is currently pressing below the lower boundary of the range, increasing the probability of a downside continuation.
Fai
Key data points
Previous close
—
Open
—
Day's range
—
About Market Cap SOL, $
Coin
Solana is a protocol praised a lot for its performance and speed — all for the sake of facilitating decentralized apps. The protocol is even doted on for its Proof-of-history consensus that improves scalability and, consequently, usability. Some bold fans even say Solana is a future rival of Ethereum. How true this is, we can't know, but we can try to evaluate how well the network is doing at the moment by watching market cap of its native token, SOL — we've calculated it and displayed on the chart so that you can stay informed and prepared in any market scenario.

SOL/USD Forecast: Range Breakdown Risk as Bears Target 100 Instrument: SOL/USD
Trend: Medium-term bearish
Timeframe: Weekly / Daily
Market phase: Range → potential continuation
⸻
Market Structure
SOL/USD remains inside a medium-term descending channel, while price action since mid-last month has compressed into a sideways range between 125.00 and 150.00

Solana Forecast: New SOL Rally Fueled by Fresh TradFi Millions?Solana (SOL) is back in focus as spot Solana ETFs recorded a full week of consistent net inflows, highlighting renewed institutional demand. Launched only at the end of November, Solana spot ETFs have already attracted nearly $700 million in net inflows.
The main driver remains the Bitwise Solana E

Solana (SOL) Struggles at $125 as Downtrend PersistsSOL/USD continues to trade inside a medium-term descending channel, with the price repeatedly failing to break above 125.00 (Murray ). The pair has now shifted into a sideways consolidation between 143.00 and 125.00 (23.6% Fibonacci), and today SOL is again testing the lower boundary of this range

SOL/USD — Bearish Channel Intact, Double-Top Risk StrengthensThe SOL/USD pair continues to trade inside a medium-term descending channel, confirming a sustained bearish structure.
A strong resistance zone has formed at 125.00 (Murray ), where price has stalled for several weeks. As long as SOL remains capped below this level, the downtrend is expected to ext

Price Stabilizes at 142.96 as Fed ExpectationsThis week, SOL/USD is correcting within a medium-term downtrend, trading near 142.96 (middle Bollinger Band, 23.6% Fibonacci retracement).
Shifts in U.S. monetary policy expectations continue to drive volatility.
Federal Reserve officials — including Christopher Waller and Mary Daly — signaled conc

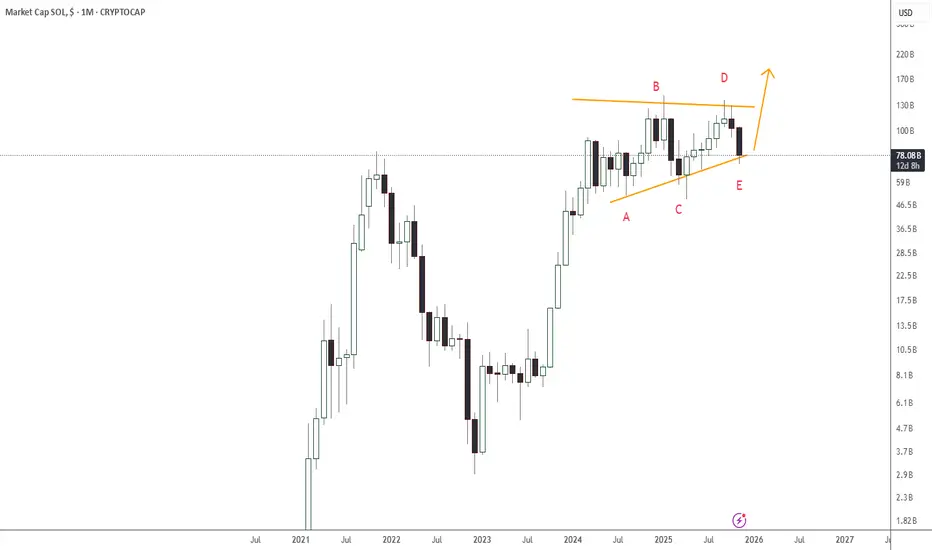
Hi, this is $SOLCould this be the next 100% pump on CRYPTOCAP:SOL ??
What we are witnessing is people selling entire portfolios at a loss.
Panic is in and it seems like it started a potential flame for a new bull rally.
Thanks for reading this very brief perspective.
Comment, Like & Share.
SOL/USD — Technical Breakdown as Downtrend StrengthensSOL/USD has broken below its long-term ascending channel and has been forming a new three-month downtrend, confirming a major structural shift in market sentiment.
The pair is currently testing the 156.25 level (Murray ). A confirmed breakdown below this support would open the way toward:
• 125.0

SOL/USD — Solana Tests Key Support as Bulls Lose MomentumSolana (SOL/USD) continues to trade within a long-term ascending channel, though the pair is now hovering near the lower boundary of that structure. Market sentiment remains cautious after Fed Chair Jerome Powell’s comments on Wednesday, suggesting the central bank may keep rates unchanged in Decemb

See all ideas
Summarizing what the indicators are suggesting.
Oscillators
Neutral
SellBuy
Strong sellStrong buy
Strong sellSellNeutralBuyStrong buy
Oscillators
Neutral
SellBuy
Strong sellStrong buy
Strong sellSellNeutralBuyStrong buy
Summary
Neutral
SellBuy
Strong sellStrong buy
Strong sellSellNeutralBuyStrong buy
Summary
Neutral
SellBuy
Strong sellStrong buy
Strong sellSellNeutralBuyStrong buy
Summary
Neutral
SellBuy
Strong sellStrong buy
Strong sellSellNeutralBuyStrong buy
Moving Averages
Neutral
SellBuy
Strong sellStrong buy
Strong sellSellNeutralBuyStrong buy
Moving Averages
Neutral
SellBuy
Strong sellStrong buy
Strong sellSellNeutralBuyStrong buy
Displays a symbol's value movements over previous years to identify recurring trends.