SOLANA trade ideas


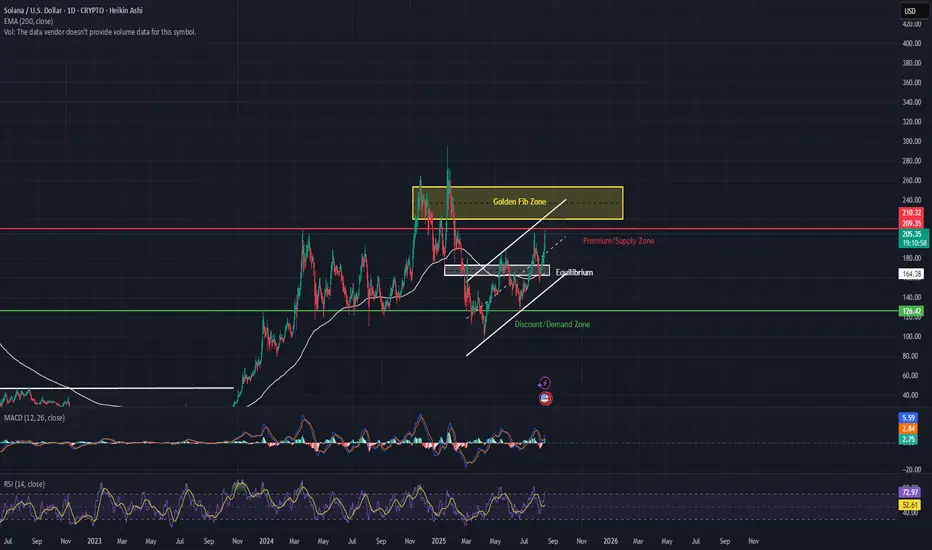
Solana Daily Outlook — Fib Zone Breakout Could Reignite the Run Solana is pressing against the top of its rising channel and is now within striking distance of the Golden Fib Zone ($210–$240). This is a critical area that could decide whether SOL charges toward its All-Time High (ATH) or pauses for a healthy pullback.
A confirmed daily candle break and close above the channel and into the Fib Zone would be a strong bullish signal — but historical behavior suggests that the first touch of the Fib Zone often triggers a rejection before the next leg higher.
📈 Primary Bullish Scenario
SOL breaks above the upper channel trendline and closes inside the Golden Fib Zone.
Price faces initial rejection near the bottom of the Fib Zone (~$210–$215) as short-term traders take profit.
This pullback finds support at the Premium/Supply Zone floor (~$200–$205), which aligns with a key structure level.
After resetting momentum indicators (RSI & MACD), price launches into a second leg toward the ATH (~$260–$270).
✅ Buy Zone on Retest: $200–$205 after rejection from $210–$215.
🎯 Take Profit Targets:
TP1: $240 (upper Fib Zone)
TP2: $260–$270 (ATH retest)
📉 Bearish Scenario
If SOL fails to hold $200 after the rejection and closes back below the channel breakout point, momentum shifts back to the bears. This could trigger a drop toward the Equilibrium Zone near $165 (200 EMA support).
Technical Notes
Golden Fib Zone: $210–$240 — major resistance cluster and potential final hurdle before ATH.
MACD: Positive momentum but nearing a possible signal-line crossover if pullback extends.
RSI: Sitting in the low 70s — still bullish, but in the zone where corrections are common before continuation.
Trend Channel: Clean breakout would signal strong upside continuation if sustained.
Final Thoughts
The next daily close will be key. A strong break into the Golden Fib Zone, followed by a controlled pullback to the $200–$205 range, could set up one of the best swing trades of the quarter, with clear upside into the ATH range.
Patience on entry will be critical — buying after the rejection and retest could offer the best risk/reward.
Solana Short SetupHi everyone.
I think we can set an order in this area to go short.
As we're in daily Order Block and getting close to the demand zone, so I'll post a buy setup after this one.
Let's see how does the market reacts.
Dear traders, please support my ideas with your likes and comments to motivate me to publish more signals and analysis for you.
Best Regards
Navid Nazarian
Solana Wave Analysis – 15 August 2025- Solana reversed from resistance zone
- Likely to fall to support level 173.55
Solana cryptocurrency recently reversed from the resistance zone located between the resistance levels 200.00 and 210.00, as can be seen from the daily Solana chart below.
This resistance zone was further strengthened by the upper daily Bollinger Band and by the resistance trendline of the daily up channel from April.
Solana cryptocurrency can be expected to fall to the next support level 173.55 (low of the earlier minor correction).

Solana - Don't miss it General background and conclusions
Solana is showing a pre-split state - neutral with an upward slope, holding above MA-200 and receiving confirmation from structural patterns.
Technical signals point to the importance of the $188 level: its breakout will open the way to $200-206 and potentially to $247.
In the short term, growth to $180 is possible if the direction is confirmed.
In the absence of volumes and strength, a downward movement to the lower support of $160 and further is possible.
Recommendations
Strategy "buy on breakout": entry at the close and holding above $188 with a target of $200-206. Alternative: buy on dip to $160 in case of a technical rebound.
Stop loss: it is reasonable to place it just below $160.
Additional monitoring: It is important to monitor the dynamics of volumes, price behavior around $188, as well as the development of fundamental drivers (ETF, Firedancer, etc.) in order to clarify the movement scenario.

solana to $1,100 by September 22 , then drop %90this is not a financial advice but Solana will continue the real bull run in 2026
the next 35 days will be explosive then we will have 2 and half month of real blood shed
then the real altcoin season in 2026
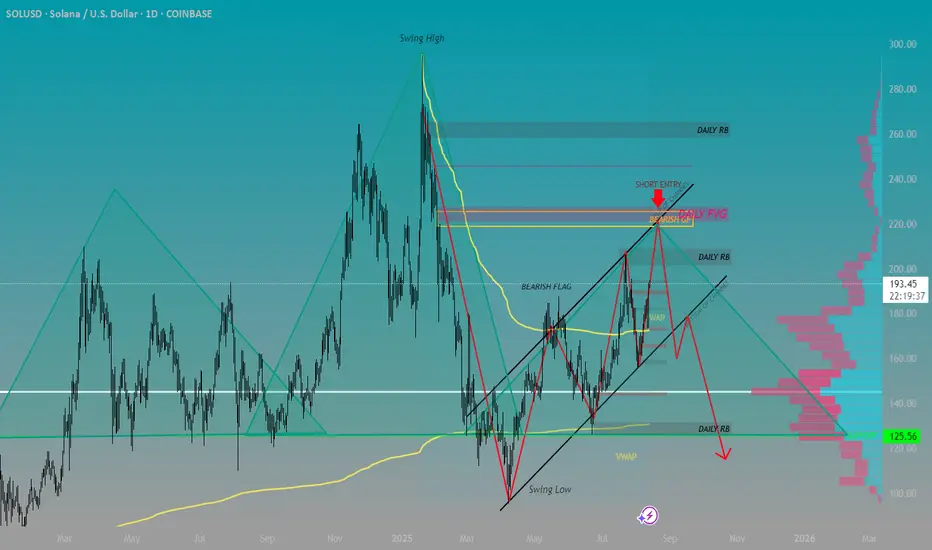
Short Opportunity Presented After Rally on CPI News ReleaseContext 1:
Support: $125.50
Resistance: $185.00
Psychological Levels: $150.00 and $200.00 and $225.00
Context 2:
Technical Structure 1: We find ourselves in a Bearish Flag Pattern to finish off an almost 2 year long Head and Shoulders. After CPI news today we saw a bullish push to sweep liquidity at the $190.00 significance level with some force. Support test 3 times and resistance tested twice.
FVG’s:
FVG Confluence 1: One bearish Daily FVG located above price..
Golden Pocket: Sits inside the bearish Daily FVG and aligns with the $225.00 Psychological level and the apex of our last test of resistance of the Bearish Flag Pattern. Strong confluence.
Context 3:
Volume Insight: OBVshows a spike in volume from level $145.00 to psych level $150.00 aligning our POC with a major support level at psych level $125.00.
Bearish Scenario: There is a Daily RB in our way to $200.00 to $210.00. If we mitigate and close above the RB; we may see a solid push to our initial bearish GP created from the inital move down. We may see a sweep of the GP at the $225 psych level and a bounce rejection from the Daily FVG at the top of our Bearish Flag and a flush of liquidity to follow.
Solana Summer Kick-Start Lunar MissionCRYPTOCAP:SOL IS REPRICING.
Gimme a Weekly Close above this POI and it’s gonna rip your mother’s face off.
Bullish Engulfing Candle kicked off the 3D run with a close above the 50% Gann.
Riding well above the DMA9.
RSI has plenty of gas left in the tank.
You've been warned.

$200 soon - SOL weekly update August 12 - 18thFrom an Elliott Wave perspective, the scenario for Solana has been slightly adjusted from previous counts. Current price action suggests that SOL is already in an impulsive upward move, which aligns well with the broader correlation observed across the altcoin market. As with many other altcoins, the structure shows a completed 1–2 sequence at the Primary degree and another 1–2 sequence at the Intermediate degree. At the Minor degree, price is in the final stages of Wave 1, specifically in Minute Wave 5.
An alternative scenario — less likely but still possible — is that the move is actually a corrective structure, with the Minor degree currently forming Wave C. This would become more probable if price extends significantly beyond the 1.618 Fibonacci extension, as such behaviour would be atypical for a standard fifth wave.
From a liquidity standpoint, short- to medium-term bias points upward. The liquidity heatmap shows a large concentration of liquidity at the local high of Wave 3, as well as significant order clusters near the 1.0 extension target for the current Wave 5. However, substantial liquidity is also accumulating below current price, which will likely be targeted during the subsequent Wave 2 retracement.
Funding rates have shifted from slightly negative toward positive territory, and open interest is climbing — both signs of a stable and sustained upward move.
Macro conditions also support the current market tone. The latest CPI data came in at 2.7%, better than expected, boosting sentiment. As the FOMC meeting approaches, retail traders are increasingly positioning for a potential “altseason” — a dynamic that raises the probability of a sell-the-news event if expectations are overextended.
Given the current wave structure, liquidity positioning, and macro backdrop, the 1.0 Fibonacci extension level has been set as the primary target for the completion of this Minor Wave 5. This area aligns with heavy order clustering and fits the typical profile for a fifth wave termination before a corrective phase.
Do your own research — and trade safe.

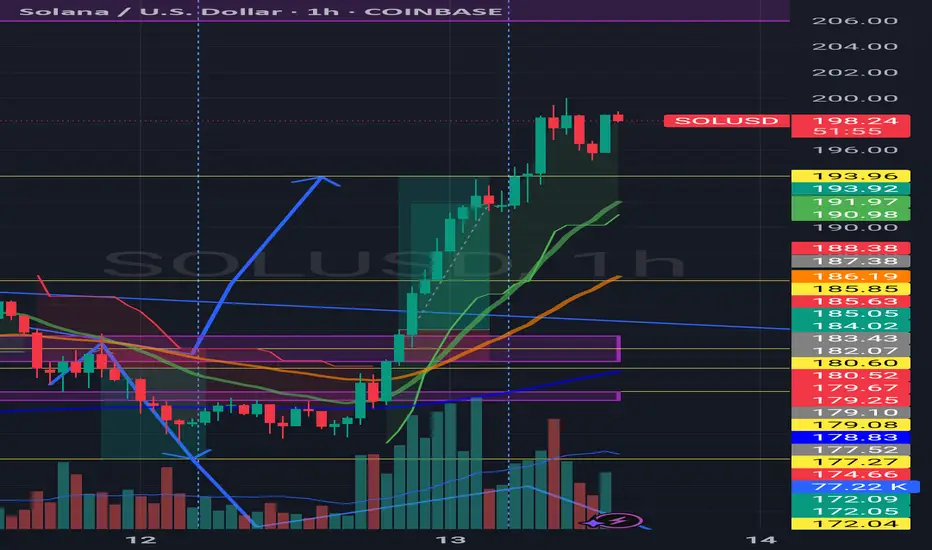
SOL/USDT – 15M Market Outlook Price is currently reacting near the Swing High at 200 after a strong bullish push.
Two possible scenarios ahead:
1️⃣ Immediate Continuation:
Break and hold above Swing High → target the Strong High near 209.
2️⃣ Deeper Retracement Before Rally:
Reject from Swing High → drop toward FVG (196) or even OB at 185–184, before bouncing back to target Strong High.
Key Levels:
Resistance: Swing High (200), Strong High (209)
Support: Swing Low (196), OB Demand Zone (185–184)
📌 Plan: Watch the reaction at Swing High for entry confirmation — both breakout and retracement setups possible.

Solana Double Top Pattern Breakout#Solana nailed it both ways — long and short — over the last 2 days. And when it finally smashed through that double-top, it didn’t just break… it rocketed. 🚀
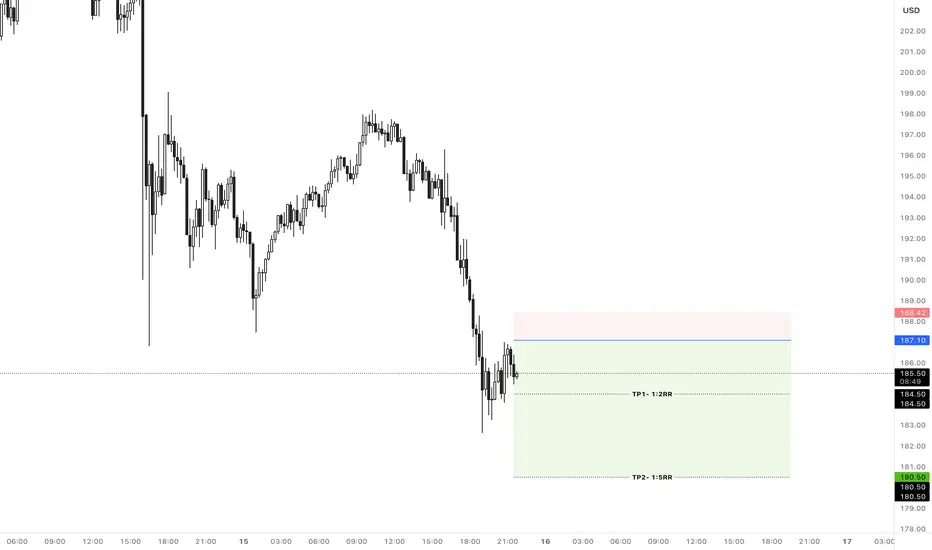
SOL/USD – Reclaiming Levels After Dip🟢 LONG above $176.25 – target $179.00+
SOL has bounced from $173.03 support and is now pressing against $176.25 resistance. RSI is climbing to 59, suggesting renewed buying pressure. A clean break above $176.25 could drive price back toward $179.00–$180.00.
📊 Keywords: #SOLUSD #SupportBounce #CryptoLong #AltcoinRally #PriceAction

$SOL Short term Bearish Outlook ?CRYPTOCAP:SOL Solana is currently testing the daily pivot as support which must hold to keep the bullish count alive.
I have 2 Elliot Wave counts, short term bullish and bearish that I am patiently waiting to see unfold. Long term is still bullish.
The white count suggests that we have printed a wave (1) and are completing a wave (2) now at the daily pivot just above the daily 200EMA where price should move powerfully in a wave 3 upwards.
Alternatively, the red count, wave B of a larger corrective could also be complete at the recent swing high and losing the pivot and daily 20EMA would confirm this. Wave C has a target of the triple support alt-coin golden pocket 0.786 Fibonacci retracement, S1 daily pivot and major support High Volume Node at $142 to complete wave 2.
The bearish analysis is my preferred count due to the amount of confluence, including the fact we are entering mid August and this move would also push daily RSI back into oversold.
This would set up new long signals! The asset is in limbo atm, not very impulsive as you would expect for wave 3.
Safe trading

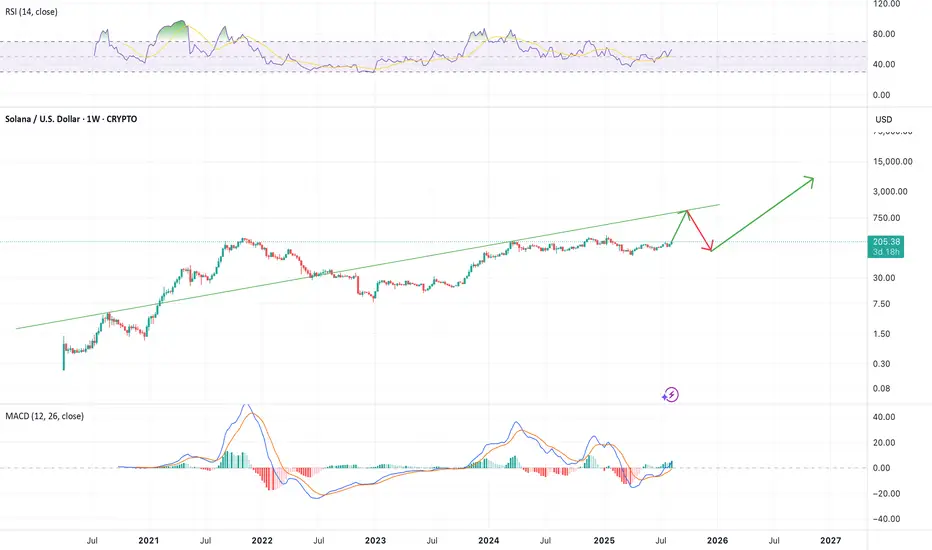
Bullish Case For SolanaThis is my bullish scenario for Solana in 2025–2026. It is moving in an ascending channel and is likely to continue toward the upper boundary of the channel. We will face resistance around the middle of the upper channel and experience many corrections along the way. The midline of the lower channel will act as a support line on the way, but overall this remains a bullish case for Solana. The passing of the Clarity Act will be a catalyst for this.

Solana Setting Up For Bullish moveSolona is currently inBullish triangle pattern. Completing Elliot wave ABCDE Pattern. Looking for SOL to move up to Fib level 141.00% which is $251 after move down.

Solana is trading around $207-208, showing strong growth.1. Current dynamics
Solana is trading around $207–208, showing steady growth. During the last day, the price has added about 0.5–0.7%, with a weekly gain of about +8%.
2. General technical picture
On timeframes from 1 hour to a month, SOL receives a general “Strong Buy” signal; the pace slows down only on the minute chart.
Indicators confirm: RSI — ~62 (Buy), MACD — Buy, ADX shows a strengthening trend — also Buy.
3. Fundamental levels and scenarios according to TipRanks
The price is above MA100 and MA200, which forms a stable bullish base. However, the price is below EMA20, the signal is Sell, while EMA50 supports Buy.
Pivot points (pivot) approximately:
Support: $177-182
Resistance: $187-200
4. Short-term driver
SOL is trading around $204, forming a triple top at $210.
Breaking this resistance can lead to +10% growth, with targets at $218-$228, and then to $250.
Current indicators: RSI - ~67 (bullish), MACD - confirms bullish momentum.
5. Trading activity review
SOL is trading with a volume of about $7.2-7.7 billion. Market capitalization is about $112 billion.

#SOLUSD - $80 MOVE?Date: 24-08-2025
#SOLUSD - Current Price: $203.88
Pivot Point: $196
Support: $181
Resistance: $211
Upside Targets:
--------------------------------
| Target | Price |
---------------------------------
| 🎯 Target 1 | $232 |
| 🎯 Target 2 | $252 |
| 🎯 Target 3 | $273 |
| 🎯 Target 4 | $294 |
Downside Targets:
| 🎯 Target 1 | $161 |
| 🎯 Target 2 | $140 |
| 🎯 Target 3 | $119 |
| 🎯 Target 4 | $98 |
#TradingView #Nifty #BankNifty #DJI #NDQ #SENSEX #DAX #USOIL #GOLD #SILVER
#BHEL #HUDCO #LT #LTF #ABB #DIXON #SIEMENS #BALKRISIND #MRF #DIVISLAB
#MARUTI #HAL #SHREECEM #JSWSTEEL #MPHASIS #NATIONALUM #BALRAMCHIN #TRIVENI
#USDINR #EURUSD #USDJPY #NIFTY_MID_SELECT #CNXFINANCE
#SOLANA #ETHEREUM #BTCUSD #MATICUSDT #XRPUSDT #PEPEUSDT #SHIBUSDT
#Crypto #Bitcoin #BTC #CryptoTA #TradingView #PivotPoints #SupportResistance

SOLUSDSOLUSD Short Call Minor support broken
A short is planned as on larget time frame retracement is pending


SOL/USD – 15M Bearish Breaker PlayPrice is forming LHs below the 15M Order Block after a strong rejection from the 200+ zone. Current structure shows equal lows near the swing high level, with potential liquidity sweep before continuation lower.
Bearish Plan:
Sweep equal lows → Reject from swing high area (~196)
Break swing low → Drop into the breaker block (~191–192) and potentially reach rejection block (~185–186)
Bullish Alternative:
Break & hold above swing high → Target OB (~204) and P1D High (~210)
Key Zones:
🔴 15M OB: ~204
🔵 Breaker Block: 191–192
🟢 Rejection Block: 185–186
Maintain strict risk management — price may trap traders near equal lows before making the real move.

Solana Buy SetupHi everyone.
Right now we're in a pullback and I think this area has its potential to set an order.
Please consider the risk management.
Dear traders, please support my ideas with your likes and comments to motivate me to publish more signals and analysis for you.
Best Regards
Navid Nazarian

Solana off to the races??? Is Solana unstoppable?
The fibbs from the bottom to the ATH showed clearly, Solana hit the 0.702 once, then again the 0.618 and then bounced off the 0.5 around USD153.
It is currently blasting through 200USD, was that the point of no return?
Whats your target in Solana? Comment.
