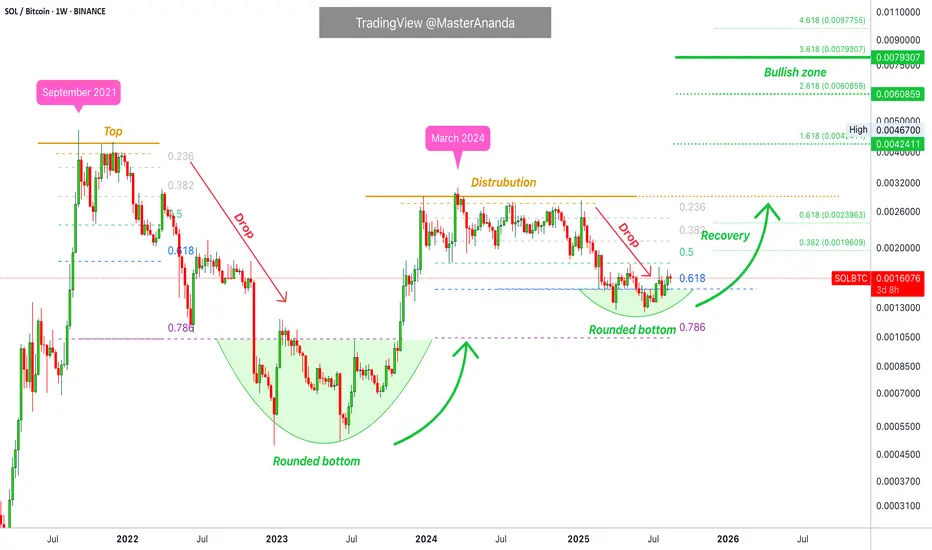
Will Solana Recover? SOLBTC Reveals the AnswerThe truth is that we can find the answer by looking at SOLBTC (Solana vs Bitcoin). If we have a bearish SOLBTC then we know the market is about to tank and about to do so wildly. But, with a bullish SOLBTC we know Solana to be bullish and related altcoins as well. Let's dive into this chart and see
Related coins
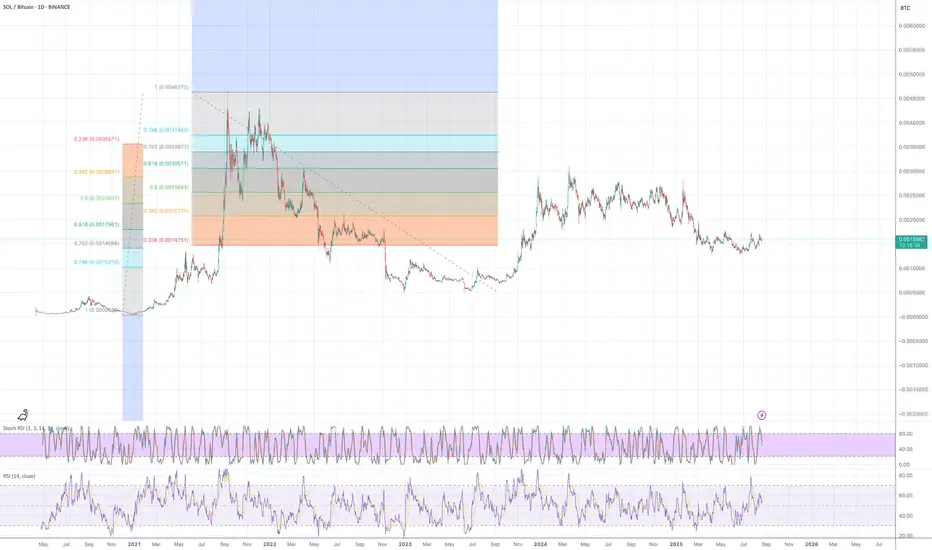
SOL - BTC Is it a buy? Checking the SOLBTC chart I notice that it might be time to buy into SOL.
Why? We have reached the golden pocket 0.702 level in retracement and now SOL could gear up for a massive pump.
Are you buying? Or Waiting?
Do you want to risk your BTC for it?
Where is SOL’s home?ETH recently went home and it is proposed (by the wonderful Ben Cowan) that alts will do the same. Until BTC finds its high, alts will bleed.
Check SOL’s long term support. That, imo, is SOL’s home.

$SOLBTC Broke down. Same with $SOLETH. Will it rebound? We peaked in CRYPTOCAP:BTC.D chart as we predicted here.
CRYPTOCAP:BTC weathering the storm: CRYPTOCAP:BTC.D close to 66%. CRYPTOCAP:BTC to 160K. for BITSTAMP:BTCUSD by RabishankarBiswal — TradingView
Since then, Altcoins have shown signs of strength and CRYPTOCAP:ETH.D is bouncing back
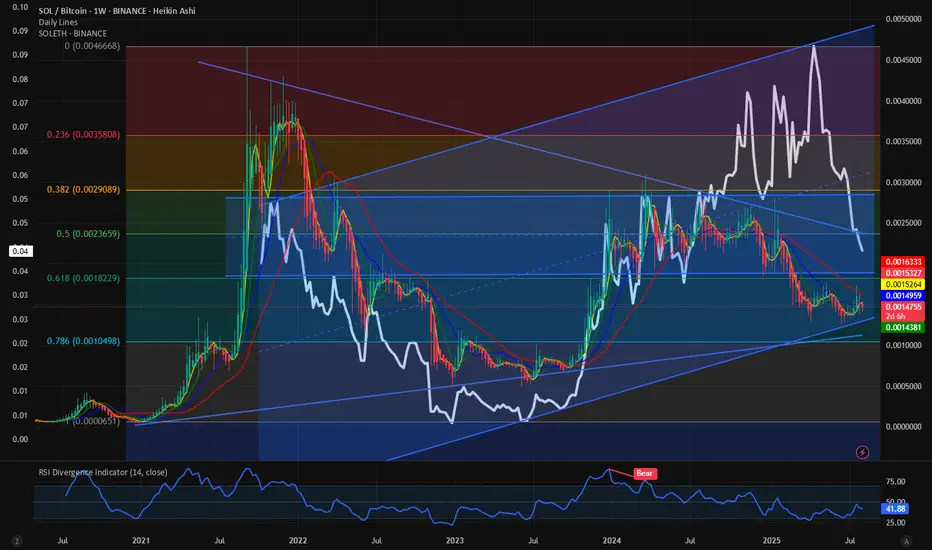
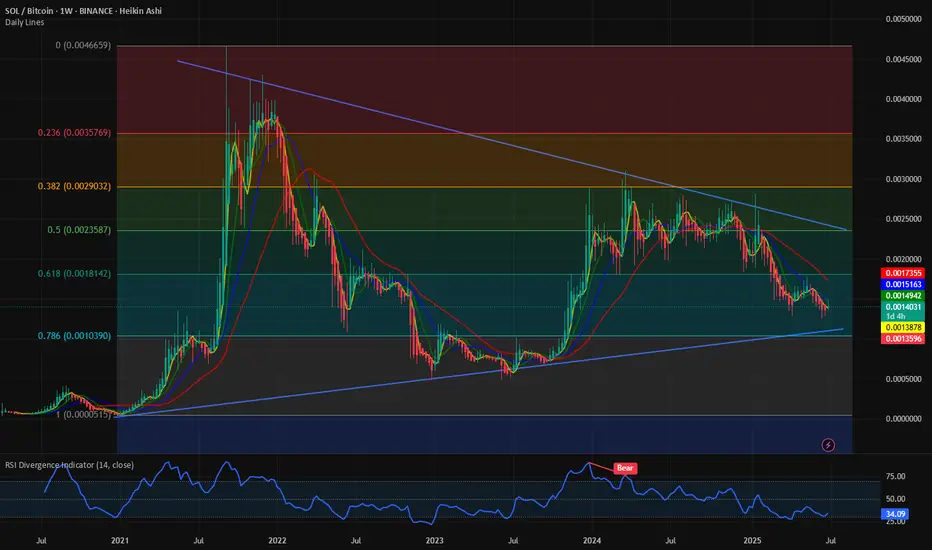
Sol/Btc✨ Solana vs Bitcoin — a quiet moment before the move?
📍 First week of August 2025
From the roaring highs of 2021,
Solana slowly faded under Bitcoin’s shadow…
Now resting around 0.0014 BTC,
breathing quietly, perhaps gathering strength:
🔸 RSI shows a bullish divergence — momentum building.
🔸 Movi

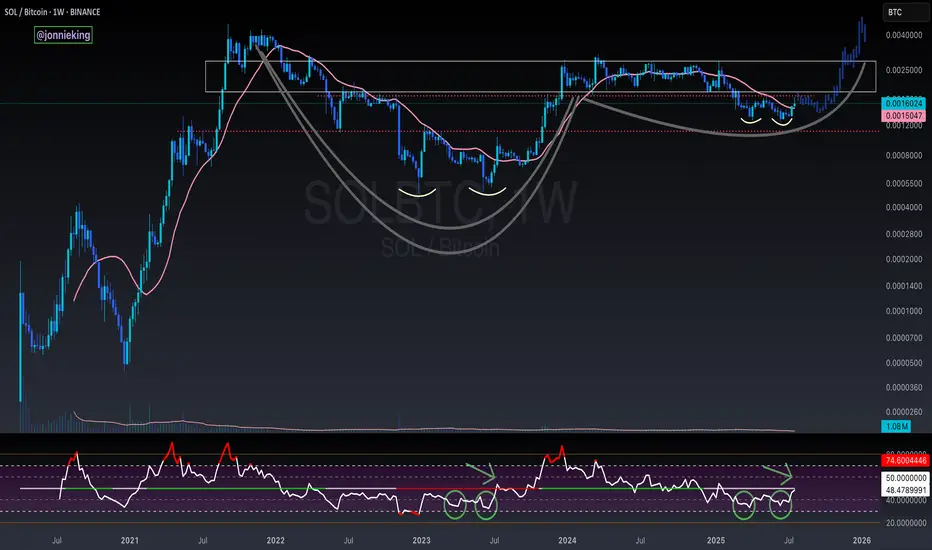
SOL / BTC Cup and Handle Weekly ChartBeautiful cup and handle on the SOL / BTC Weekly chart.
Need to break above the neckline and reclaim the POI.
Double bottom on the RSI matches just before the rip in July 2023.
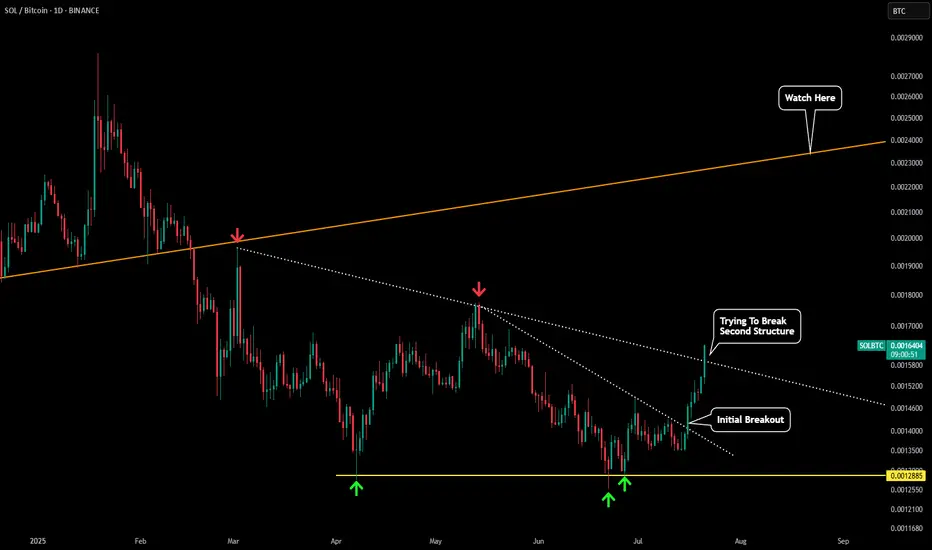
SOLBTC - Still Showing Strength Sol finally catching up to the recent momentum we have seen with other crypto assets such as BTC, ETH, and XRP.
Looking at the SOLBTC chart we can see that we are trying to breakout of the second resistance structure. As long as price does not close the daily below this trendline then it should act
SOL/BTCI've been talking smack about SOL/BTC, because it has a gap below, and I just assumed that when BTC goes for $1M, Sol would get drained in sats. I have to admit though that it's holding up better than I thought. I've said in past posts that I predicted that about 20 coins will "hold in sats" whe

$SOLBTC: Little strength to show for. In the crypto space we time and again regularly focus on the CRYPTOCAP:BTC and the CRYPTOCAP:BTC.D chart and we have time and again predicted that CRYPTOCAP:BTC.D will touch at least 66% in this Crypto cycle. This CRYPTOCAP:BTC Dominance can be interpreted not only as the CRYPTOCAP:BTC sup
Not clear path to SOLBTC but sqeeze higher more probableIt needs to break above 18000 for this to fulfill. Current QE scenario will help

See all ideas
Summarizing what the indicators are suggesting.
Oscillators
Neutral
SellBuy
Strong sellStrong buy
Strong sellSellNeutralBuyStrong buy
Oscillators
Neutral
SellBuy
Strong sellStrong buy
Strong sellSellNeutralBuyStrong buy
Summary
Neutral
SellBuy
Strong sellStrong buy
Strong sellSellNeutralBuyStrong buy
Summary
Neutral
SellBuy
Strong sellStrong buy
Strong sellSellNeutralBuyStrong buy
Summary
Neutral
SellBuy
Strong sellStrong buy
Strong sellSellNeutralBuyStrong buy
Moving Averages
Neutral
SellBuy
Strong sellStrong buy
Strong sellSellNeutralBuyStrong buy
Moving Averages
Neutral
SellBuy
Strong sellStrong buy
Strong sellSellNeutralBuyStrong buy
Displays a symbol's price movements over previous years to identify recurring trends.