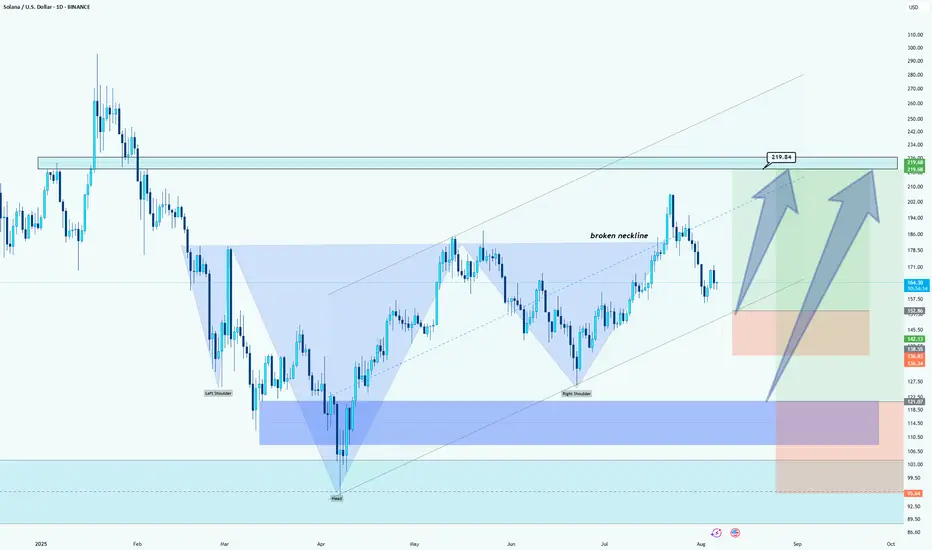
Solana (SOL): Bullish Continuation after Neckline BreakoutWhat I see:
Chart Patterns (Head and Shoulders): The chart illustrates a classic "Head and Shoulders" pattern. The left shoulder, head, and right shoulder are formed, and the neckline (the blue dashed line) has been broken, which suggests that the price could rise towards the target zone above
Key facts today
Key stats
About Solana
Solana is a blockchain fairly new to the crypto game, but that's not to say it's not a serious player. Attempting to rival smart-contract titan Ethereum for the NFT and web3 crown, Solana has a strong focus on scalability through its hybrid proof-of-history/proof-of-stake consensus that aims to accommodate a flourishing dApp ecosystem. Its native token SOL has enjoyed the successes of Solana-based NFTs and dApps, but since its inception has also felt the strain of the network’s tendency to experience outages. Although that hasn't stopped it from reaching the top 15 coins by market cap.
Related coins
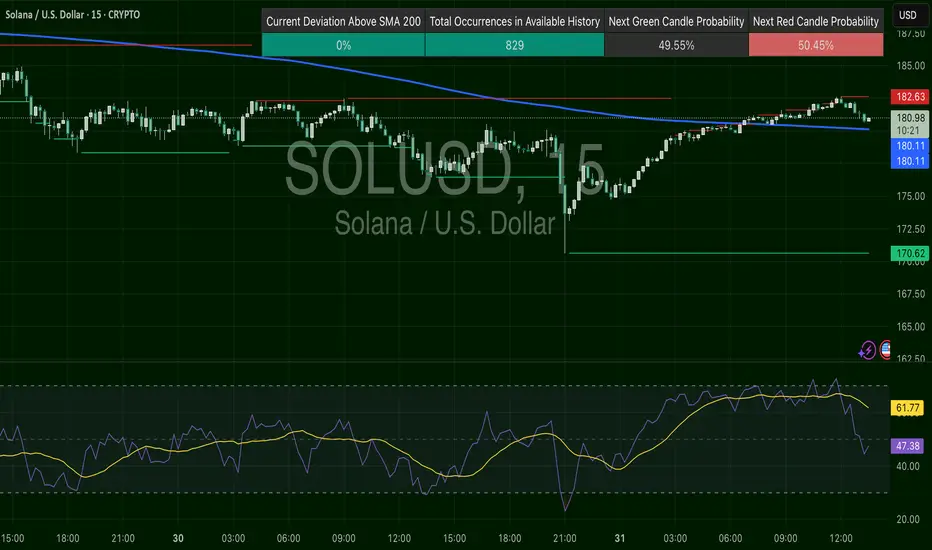
SOLUSD – Faded Highs, Now RetestingSOL recovered off the $170–172 lows and is now testing $182.63 resistance. RSI was high and now cooling off (~47), suggesting momentum is slowing. Still trading just over the 200 SMA, this is a breakout pullback zone. $180.13 is the key level to stay above.
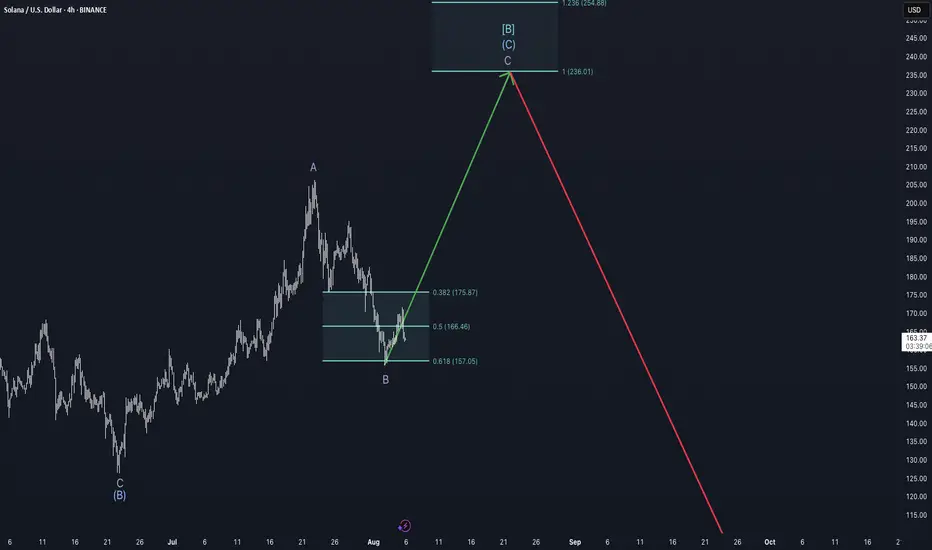
Bulls will be disappointed - Weekly Update August 5-11thSolana appears to be in the final leg of a complex corrective structure. According to the current Elliott Wave count, the larger cycle degree is unfolding in a downward wave c, while the primary degree is in an upward wave B, subdividing into intermediate wave C, which itself is in minor wave C—now
Solana coin Long setupIn this video I go through the current price action and talk about how the 126$ target level was recently reached for a clean long entry and on the daily timeframe we printed a higher low .
I expand on my thoughts for a continuation to the upside and to retest some higher levels of resistance 180

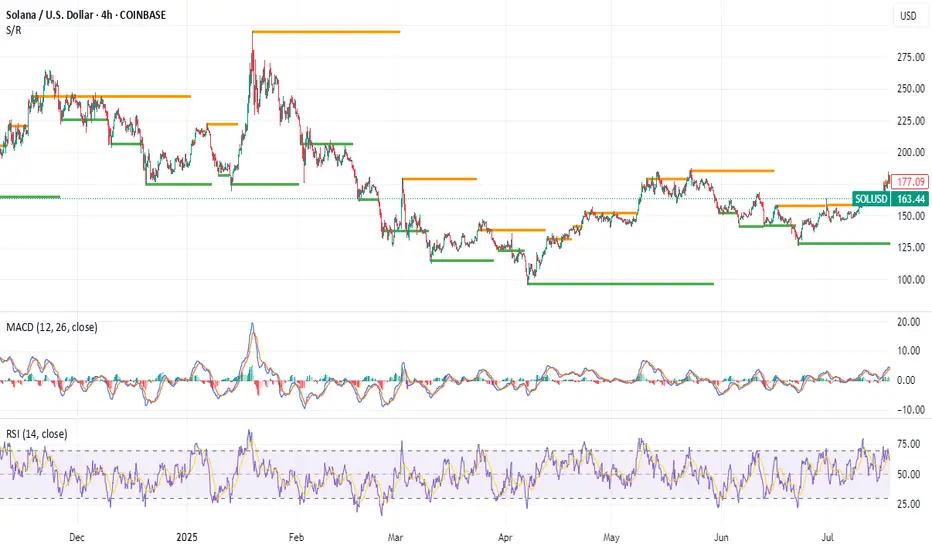
SOL/USD Last Level before $143Using a simple fib retracement from June Low to July High, mid 150s is a good buy after we lost $165, but it all depends on BTC. If BTC loses 112k-110, we are going to $140s and potentially the June low. God Speed

SOL Institutional Capital Fuels Bull Run SpeculationSolana's Ascent: A Perfect Storm of Adoption and Institutional Capital Fuels Bull Run Speculation
A powerful and rare confluence of tangible real-world adoption, significant institutional investment, and bullish technical indicators is generating a palpable buzz around Solana (SOL). The high-perfor
Very Bullish!!
Solana chart looks very bullish. The price is currently dropping but I think it is a very healthy correction.
Weekly chart:
1) all momentum indicators just entered the bull zone.
2) The chart is forming higher highs.
Daily:
1) EMA55 finally crossed EMA200. The last time they crossed w

SolSolana is currently in a correction phase, and a strong demand is forming near the 151 area.
As per the rules, the market should ideally start buying from here.

Solanawe can see price, going in perfect channels all price level are golden levels, So we look to buy dip between 137 and 145, next target will be 220$

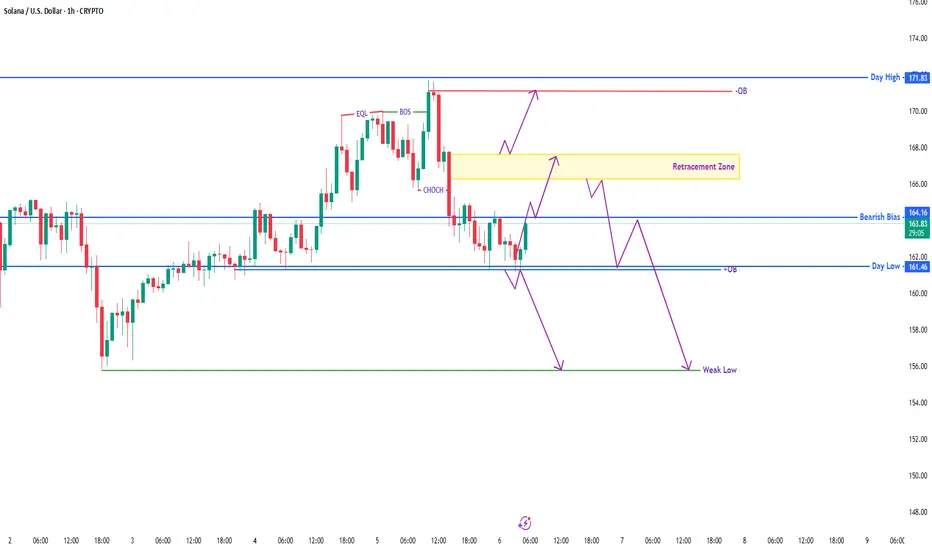
SOL/USDT – Price Action AnalysisKey Levels:
Day High: 171.83
Day Low: 161.46
Retracement Zone: Focus on the yellow zone for possible entry
Key Concepts:
Bullish Bias: The market is currently showing potential to move upward after testing the Bearish Bias zone at 164.16. A breakout above the retracement zone could lead to upwa
See all ideas
Summarizing what the indicators are suggesting.
Oscillators
Neutral
SellBuy
Strong sellStrong buy
Strong sellSellNeutralBuyStrong buy
Oscillators
Neutral
SellBuy
Strong sellStrong buy
Strong sellSellNeutralBuyStrong buy
Summary
Neutral
SellBuy
Strong sellStrong buy
Strong sellSellNeutralBuyStrong buy
Summary
Neutral
SellBuy
Strong sellStrong buy
Strong sellSellNeutralBuyStrong buy
Summary
Neutral
SellBuy
Strong sellStrong buy
Strong sellSellNeutralBuyStrong buy
Moving Averages
Neutral
SellBuy
Strong sellStrong buy
Strong sellSellNeutralBuyStrong buy
Moving Averages
Neutral
SellBuy
Strong sellStrong buy
Strong sellSellNeutralBuyStrong buy
Displays a symbol's price movements over previous years to identify recurring trends.
Curated watchlists where SOLUSD is featured.

Gen 3 crypto: A new day dawns…
25 No. of Symbols

Smart contracts: Make the smart decision
36 No. of Symbols

Staking Coins: Pick up a stake
18 No. of Symbols

Top altcoins: Choose your alternatives carefully
28 No. of Symbols

Up-and-coming crypto: New kids on the block
30 No. of Symbols
See all sparks
Frequently Asked Questions
The current price of Solana (SOL) is 169.98 USD — it has fallen −0.52% in the past 24 hours. Try placing this info into the context by checking out what coins are also gaining and losing at the moment and seeing SOL price chart.
The current market capitalization of Solana (SOL) is 91.64 B USD. To see this number in a context check out our list of crypto coins ranked by their market caps or see crypto market cap charts.
Solana (SOL) trading volume in 24 hours is 4.72 B USD. See how often other coins are traded in this list.
Solana price has fallen by −10.05% over the last week, its month performance shows a 7.45% increase, and as for the last year, Solana has increased by 17.67%. See more dynamics on SOL price chart.
Keep track of coins' changes with our Crypto Coins Heatmap.
Keep track of coins' changes with our Crypto Coins Heatmap.
Solana (SOL) reached its highest price on Jan 19, 2025 — it amounted to 295.00 USD. Find more insights on the SOL price chart.
See the list of crypto gainers and choose what best fits your strategy.
See the list of crypto gainers and choose what best fits your strategy.
Solana (SOL) reached the lowest price of 8.00 USD on Dec 29, 2022. View more Solana dynamics on the price chart.
See the list of crypto losers to find unexpected opportunities.
See the list of crypto losers to find unexpected opportunities.
The current circulating supply of Solana (SOL) is 606.90 M USD. To get a wider picture you can check out our list of coins with the highest circulating supply, as well as the ones with the lowest number of tokens in circulation.
The safest choice when buying SOL is to go to a well-known crypto exchange. Some of the popular names are Binance, Coinbase, Kraken. But you'll have to find a reliable broker and create an account first. You can trade SOL right from TradingView charts — just choose a broker and connect to your account.
Crypto markets are famous for their volatility, so one should study all the available stats before adding crypto assets to their portfolio. Very often it's technical analysis that comes in handy. We prepared technical ratings for Solana (SOL): today its technical analysis shows the buy signal, and according to the 1 week rating SOL shows the buy signal. And you'd better dig deeper and study 1 month rating too — it's buy. Find inspiration in Solana trading ideas and keep track of what's moving crypto markets with our crypto news feed.
Solana (SOL) is just as reliable as any other crypto asset — this corner of the world market is highly volatile. Today, for instance, Solana is estimated as 2.23% volatile. The only thing it means is that you must prepare and examine all available information before making a decision. And if you're not sure about Solana, you can find more inspiration in our curated watchlists.
You can discuss Solana (SOL) with other users in our public chats, Minds or in the comments to Ideas.