Solana -> a descending broadening wedgeHello guys!
A descending broadening wedge is forming, indicating a potential bullish reversal if price follows the typical pattern.
Pattern Analysis: Descending Broadening Wedge
The wedge is marked with two diverging trendlines, where the upper line is descending and the lower line slopes down but at a slower rate.
This pattern generally signals a reversal scenario, especially after a downtrend.
Price typically oscillates between the upper and lower trendlines before a breakout occurs.
Support and Resistance Levels
Immediate resistance: Near $205–207 (upper trendline of the wedge).
Support zone: Around $192–193, marked by the lower wedge line and a grey horizontal area, which historically acted as strong demand.
Price objective: Upon breakout, the target is around $212+, as indicated by the schematic at the top-left corner of the chart.
SOLUSD trade ideas

From Rocket to Rock: Solana’s Gravity CheckCRYPTOCAP:SOL may reach $262 as network adoption accelerates and throughput metrics hit new highs, but market dynamics are rarely linear. Cyclical retracements below $100 remain a distinct possibility, reflecting the interplay between speculative sentiment, ecosystem development, and the inherent volatility of high-performance blockchain networks.

Solana - The sleeping giant waking up!🔦Solana ( CRYPTO:SOLUSD ) will still head higher:
🔎Analysis summary:
Yes, over the past four years, Solana has overall been just consolidating. But eventually, Solana will catch up with the entire crypto market and create a new all time high. Specifically with bulls picking up momentum lately, it becomes more and more likely that Solana will do exactly that.
📝Levels to watch:
$250
SwingTraderPhil
SwingTrading.Simplified. | Investing.Simplified. | #LONGTERMVISION

Solana goes Bearish: Rising WedgeSolana is forming a rising wedge. Probably the price goes to $120 because there's a big resistance.

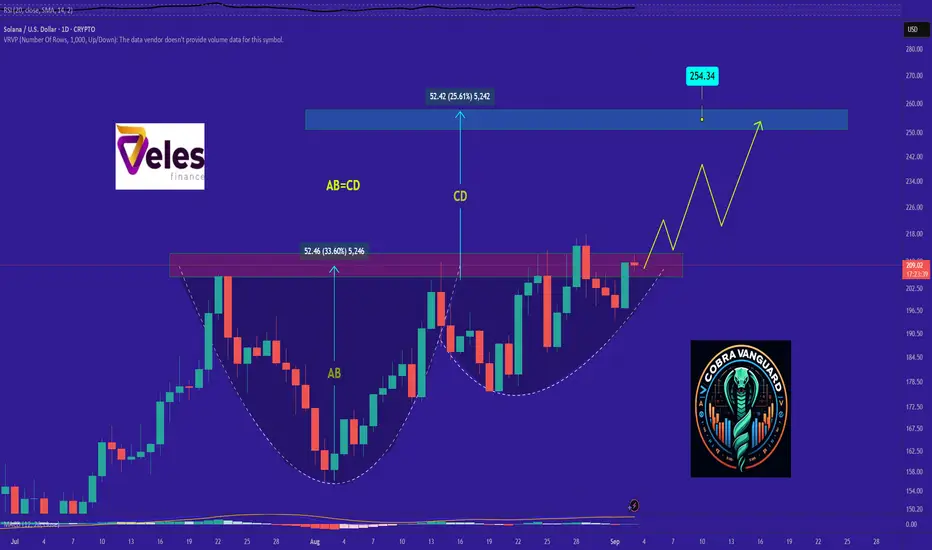
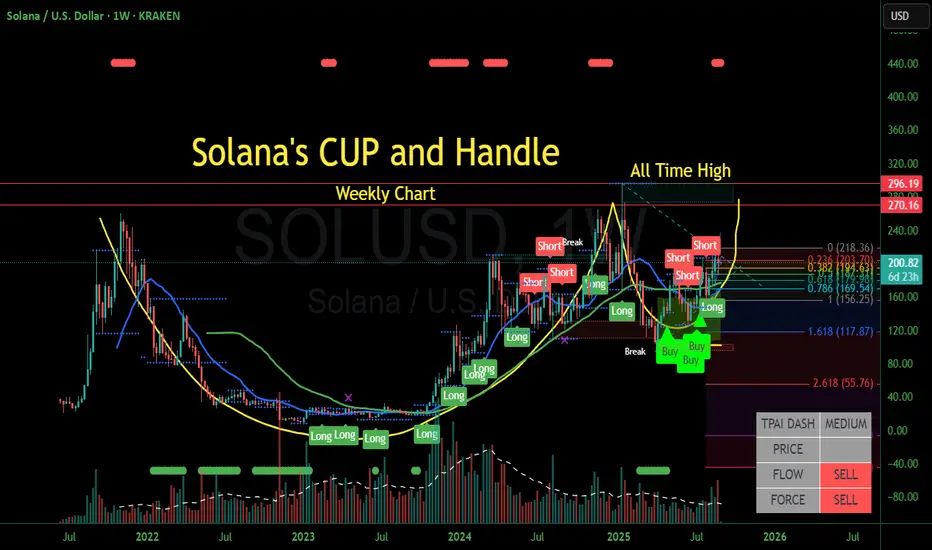
SOL's Situation, A Comprehensive Analysis !!!It appears that the price is forming a cup and handle pattern, and if this occurs, it could push the price above $215.
Best regards CobraVanguard.💚
Sol - Support and resistance & take profit targetsSol - Support and resistance & take profit targets. Ideally Sol gets a retrace this weekend to my T2 so I can load up even more. Either way I'm taking profits at my green T1.
May the trends be with you.
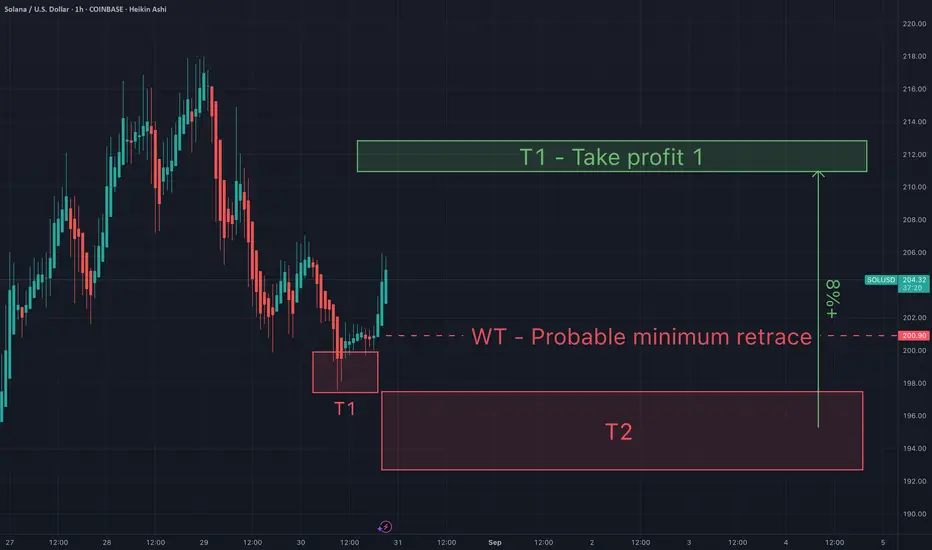
You will ask yourself "how did he know Sol would do that"?On Aug 30th I suggested that Sol was approaching my ideal buy zone at T2. I anticipated a bounce to my take profit target soon after. That played out perfectly.
Question remains...will T2 remain support? What do you think? I'd love to hear your thoughts.
May the trends be with you.

SOLUSD ShortThe Crab harmonic pattern signals a robust downward movement for SOLUSD, beginning at 209 USD and targeting likely TP 1 and TP 2 .

01-09-2025 SOLUSDThe market is not always chaotic and disorderly, and there is a precise geometric beauty hidden in price fluctuations. The harmonic form long strategy is a powerful tool for accurately identifying potential market reversal points based on the Fibonacci ratio. When the form forms perfectly at the key support level, it often indicates the depletion of bearish momentum and the initiation of bullish trends.
As shown in the figure: 15M Bullish Bat

Ascending triangle - Solana momentum building Solana is on the rise again, forming an ascending triangle and a golden cross. This could be a good opportunity to accumulate before the next big push upwards. Furthermore, XRP, ETH, and BTC have all surged higher, but Solana has remained relatively stable along its trend line. It’s only a matter of time before Solana reaches a new all-time high, and with increased industrial accumulation, it is very likely to be the next altcoin to push higher. This is not financial advice. The technical indicators also support this, as increased trading volume and strong support above 190 indicate that Solana has proven to be resilient and is on an upward trajectory. Additionally, the Sol/BT and Sol/ETH ratios are now in favor of Solana, suggesting that capital is rotating into Solana.

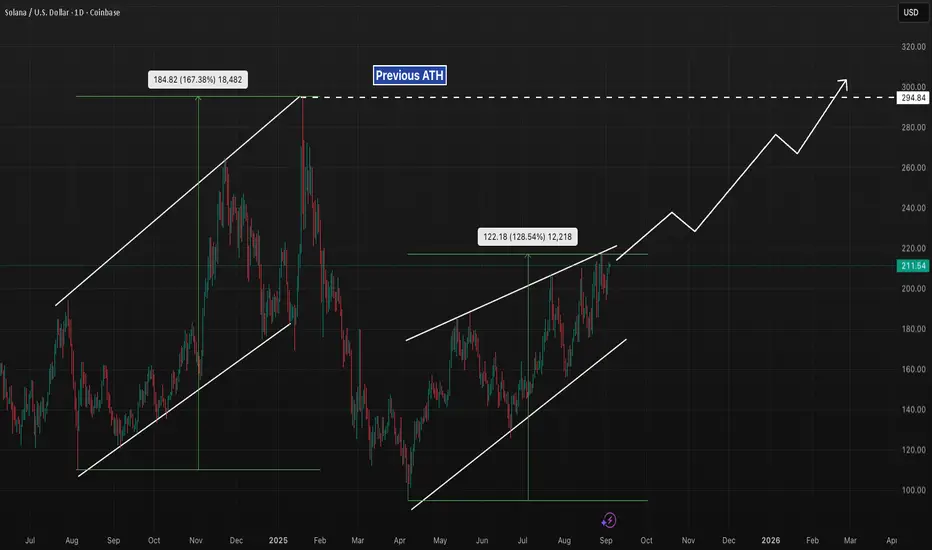
SOL 1D – Channel Breakout Targeting $295 ATH Zone?Solana has repeated a very similar channel structure to late 2024 — a steady grind higher inside an ascending channel followed by an explosive breakout. The current channel has already delivered a +128% measured move, echoing the prior +167% surge.
Key levels:
Channel top breakout → could extend toward $280–300.
$295 ATH resistance remains the key upside magnet.
Channel support → if lost, risk of retrace toward $180–170.
This symmetry suggests SOL could be setting up for another leg higher, with the $295 zone acting as the next major target.
SOL BUY SETUP ,Long from $203SOL BUY SETUP
Currently $203
Bought From $203
Stop loss $177
(Trading plan If SOL go down ,
to $197 will add more longs)
Expecting target $208 OR ABOVE
In the event of an early exit,
this analysis will be updated.
Its not a Financial advice

Can We See SOLUSD Push $5K+?Solana continues to show strength holding above key levels. If this breakout sustains, the measured move from price ranges A to B and B to C points toward a potential first target between $3,628 and $5,869. Long term structure remains intact and momentum is building. Patience could pay off big here.
On the fundamentals side, big players like Pantera Capital and Galaxy Digital are reportedly building SOL treasury reserves a strong signal that institutions see Solana as a core layer-1 for the next cycle. The technicals and fundamentals are starting to align here, and that’s when things get exciting.

Solana Forming a Weekly Cup and Handle StructureSolana is now forming a cup and handle pattern with an impending breakout on the handle at $296. A measure move would suggest a target of around $526, based on the cup's average bottom of around $18.
SOL 4H Demand Zone Retest in Play, Will Bulls Drive Toward $230Solana continues to respect the ascending support trendline, with clean higher lows forming the base for each leg higher. The $200–205 demand zone is once again in focus after recent rejection wicks, serving as a key retest level for continuation.
If buyers defend this zone, momentum favors another bullish impulse toward the $225–230 area. Liquidity sits lower at $196.7 and $175.8, which may attract price before continuation if demand weakens.
Indicators show mixed signals: the Stoch RSI is stretched into overbought territory, hinting at possible short-term cooling, while the MACD Liquidity Tracker is still showing momentum building.
Key levels:
– Demand Zone: $200–205
– Liquidity: $196.7, $175.8
– Bullish target: $225–230

Solana (SOLUSD): Is a move to $252 coming?Solana is showing signs of a bullish reversal on the daily chart.
The price has retested and held a key support level at $196. This is a strong signal that buyers are defending this area.
Looking at the RSI, it has bounced from oversold territory, which supports the potential for a bullish reversal.
My target is $252, which represents a significant resistance level. A successful break above this could confirm a major uptrend.

$SOL Rotation IncomingNow that the CRYPTOCAP:ETH hype has calmed,
it’s almost time for CRYPTOCAP:SOL
to rip the haters face off...
once again🎃

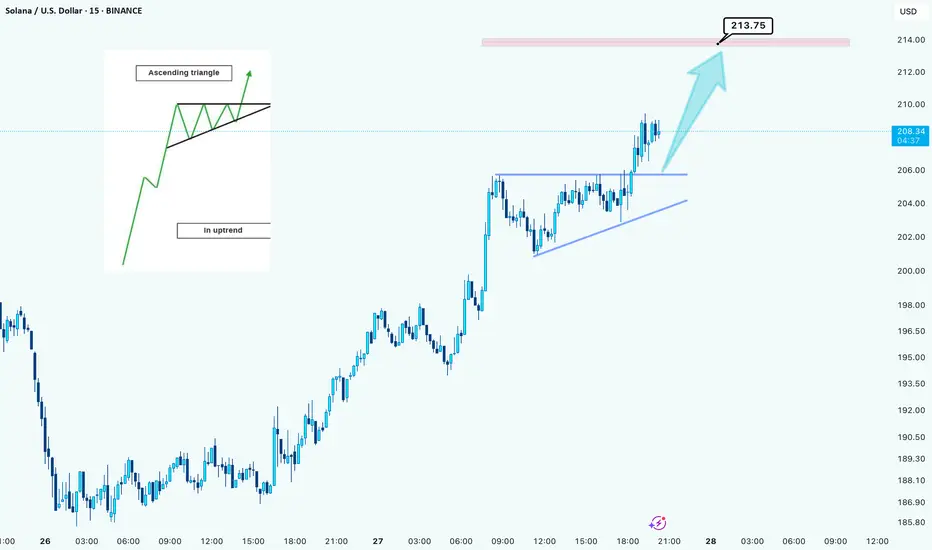
Solana Breaks into an Ascending Triangle – Bullish Continuation Hello guys!
The chart shows Solana (SOL/USDT, 15m timeframe) forming a classic ascending triangle pattern during an ongoing uptrend. The upper resistance level around $206 has been tested multiple times, while the rising trendline from the bottom confirms consistent buying pressure and higher lows.
This setup is a textbook bullish continuation signal, where buyers gradually squeeze sellers against a flat resistance until a breakout occurs. The breakout has already taken place, with SOL pushing above the resistance zone and heading toward the next key target around $213.75, which aligns with the projected move from the triangle’s height.
As long as price holds above the broken resistance (now support), momentum favors further upside. If bulls maintain control, we could see a continuation toward higher resistance zones. However, a drop back below the rising trendline would weaken the setup and signal caution.
most important levels:
Support (retest zone): $206
Immediate target: $213.75
Next potential resistance: above $214
Overall, the breakout from this ascending triangle suggests bullish momentum remains strong for Solana in the short term.
Sol To the Moonlet's go it"s time to fly for solana to break the key zone and create a new bullish movement be ready to collect enough momentum at the retracement level

SOL - Time to buy again!The price has finally broken this bullish pattern and now is the time for the price to rise to $250.
PREVIOUS ANALYSIS

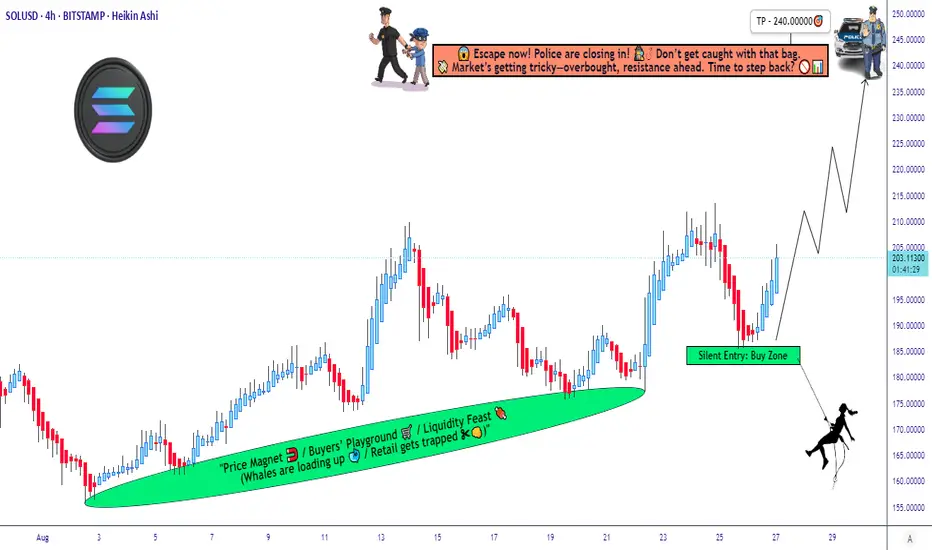
SOL/USD: Bullish Swing Plan w/ Layered Buy Limits & Target🏴☠️ ATTENTION ALL THIEVES & ROBBERS! 🏴☠️
Asset: SOL/USD "Solana vs U.S Dollar" Crypto Market Heist Plan (Swing / Day Trade)
Plan: Bullish Heist ✅
🎯 THE MASTER PLAN: OPERATION SOLANA BULL RUN
Ladies & Gentlemen of the thieving community! 👔🦹♂️🦹♀️ Based on the Thief Trader's secret technical analysis, the vault door to Solana profits is creaking open! Time to execute the heist!
🚪 ENTRY: LAYER UP & SLIP IN SILENTLY
The Thief is using a multi-layer limit order strategy for this entry! We don't knock down the door, we pick the locks one by one! 🔓
Place your buy limit orders at these levels:
Layer 1: 190.00000
Layer 2: 195.00000
Layer 3: 200.00000
🛠 PRO TIP: You can increase your limit layers based on your own capital! More layers = bigger haul! 💰💰
🛑 STOP LOSS: THE GETAWAY DRIVER'S LOCATION
This is the Thief's SL: @180.00000
Listen up, OG's! 👉 Adjust your final SL based on your own strategy and risk appetite! Don't get caught because you got greedy on the entry! Know your exit route! 🚗💨
🎯 TARGET: ESCAPE BEFORE THE COPS ARRIVE!
The police barricade is forming at @240.00000! 🚨👮♂️
Do NOT get greedy! Grab the stolen money, exit the vehicle, and ESCAPE WITH THE PROFITS before the target! A true thief knows when the job is done! 🏁💰
⚠️ THIEF'S FINAL WARNING & DISCLAIMER
📰 News is an Undercover Cop: It will wreck our plan! Avoid new trades during high-impact news!
🔄 Use Trailing SL: Once in profit, trail your stop to lock it in! Protect the loot!
📉 This is not financial advice. This is a heist plan. You are the thief. Your capital, your risk. I'm just the mastermind.
💖 Enjoyed the plan? SMASH THAT LIKE & BOOST BUTTON! ✅ It helps our crew grow and plan the next big score! 🚀🤝
Stay sharp, thieves! I'll see you on the next heist. 🤑👋
Solana - The future is clear!🎯Solana ( CRYPTO:SOLUSD ) breaks out soon:
🔎Analysis summary:
Solana is currently trading at the exact same level as it was about four years ago. In the meantime we witnessed crazy corrections and parabolic rallies, leading to another all time high retest. Quite likely therefore that Solana will break the previous all time high in the near future.
📝Levels to watch:
$250
SwingTraderPhil
SwingTrading.Simplified. | Investing.Simplified. | #LONGTERMVISION

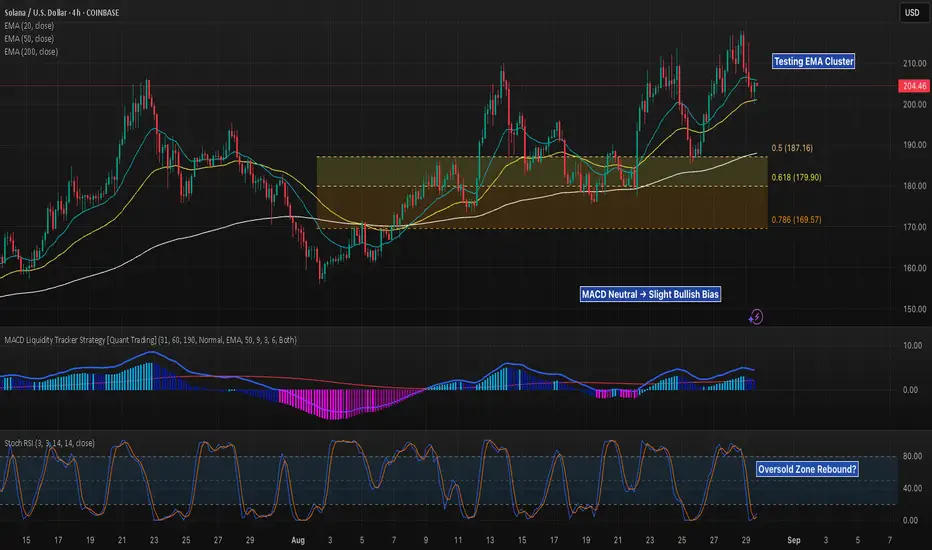
SOL 4H – Testing EMA Cluster at $204, Will Fib Support Hold?Solana on the 4H chart is retesting the EMA cluster (20/50/200) around $204 after its recent rally.
The key support to watch lies in the Fib retracement zone between $187 (0.5) and $169 (0.786), where previous consolidation provided strong demand.
EMA Confluence: Price is sitting directly on the 20/50 EMA with the 200 EMA nearby at $187. A clean break below could trigger deeper retracement into the Fib box.
MACD: Currently neutral but leaning slightly bullish, suggesting momentum is cooling rather than reversing.
Stoch RSI: Oversold bounce conditions are developing, which could fuel a short-term rebound if support holds.
Traders should watch the $200–$204 EMA cluster as the immediate decision point. A reclaim above $210 would re-confirm bullish continuation, while failure here risks a drop into the Fib support range.