Is Solana Preparing for a New Upside Wave After WMA Breakout?📊 SOL/USD – “SOLANA VS U.S Dollar” Crypto Market Opportunity Blueprint (Swing Trade)
🟢 Trade Plan Overview
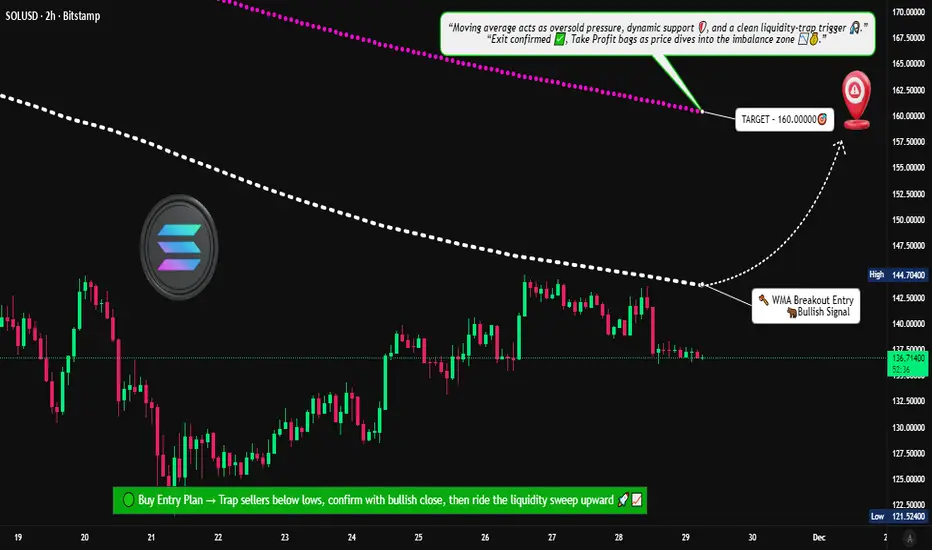
The bullish structure is confirmed after Weighted Moving Average (WMA) dynamic support breakout, signalling fresh momentum entering the market. This setup favors continuation as long as SOL holds above the breakout zone.
📌 Entry Zone
➡️ Entry: Any price level after the WMA breakout above 145.00000
The breakout + retest combination is your strongest confirmation. Let the chart validate the move—no rush entries.
🛡️ Stop Loss (Risk Protection)
➡️ Suggested SL: 132.50000
Dear Ladies & Gentlemen (Thief OG’s):
Use this SL only as a reference. Adjust based on your personal execution style, risk tolerance, and position size.
Place SL only after breakout confirmation — not before.
🎯 Profit Target
➡️ Target: 160.00000
Weighted moving averages are acting as dynamic resistance, and indicators show signs of potential overbought traps, so secure profits early instead of overstaying.
Dear Ladies & Gentlemen (Thief OG’s):
TP is your own choice. Lock in profits based on your comfort, not just my blueprint.
📚 Market Reasoning
WMA breakout shows renewed bullish strength.
Structure support aligned with higher-timeframe trend.
Volume expansion confirms buyers stepping in.
Resistance cluster around 160 remains the key zone to offload profits.
🔎 Related Pairs to Watch (Correlation & Key Notes)
💠 BITSTAMP:BTCUSD (Bitcoin)
High correlation with total crypto liquidity.
Strong BTC breakouts often pull SOL upward because altcoins follow BTC’s macro flow.
If BTC loses trend support, SOL setups weaken.
💠 BITSTAMP:ETHUSD (Ethereum)
ETH and SOL share similar Layer-1 ecosystem flows.
When ETH rallies aggressively, funds rotate into strong alts like SOL.
Good to use as a sentiment confirmation tool.
💠 COINBASE:ADAUSD (Cardano)
Another L1 competitor; correlated during broad alt-season pushes.
When ADA moves, retail interest usually spreads across L1s — including SOL.
💠 COINBASE:AVAXUSD (Avalanche)
Solana + Avalanche often move together during risk-on bursts.
AVAX momentum adds conviction to SOL’s breakout reliability.
💠 BINANCE:SOLBTC
The most important relative strength pair for SOL.
If SOLBTC is trending upward, SOL outperforms majors — huge confirmation signal for swing trades.
📈 Final Thoughts
This trade plan balances momentum, trend structure, and dynamic WMA confirmation. Follow the breakout logic, respect your risk, and let the chart guide your exits. The idea is designed to help traders act with clarity, control, and professional-level precision.
Market insights
SOL Daily Outlook | November 28, 2025SOL Daily Outlook | November 28, 2025
My bias on SOL remains bullish. Price is still holding higher-timeframe structure after rejecting 144.69, and the pullback into 136–138 looks corrective rather than a reversal. I want to see price reclaim 140–141 to confirm continuation and make another move toward 144.69. If that reclaim doesn’t hold, a retest of 133–135 is the next area of interest before pushing higher.
As long as SOL stays above 133–135, I expect the market to continue higher and eventually break through 144.69 in the coming days or weeks.

solana is ready to pump?currently I see solana ascending and getting ready to decide where we are heading, the way the market looks I dont want to get in a trade and get sandwiched in.
were either going to be
* bouncing off the small yellow trend line and go up to $145 and break towards the upside ^
* bounce off the small yellow trend line hit $145 to reject that level and head down to $135 again and finally bounce back up and retest to break $145 ^
* break small trend line and go lower towards $120 again and lower.

SOLUSDT Solana against the U.S. Dollar on the 1-hour timeframe, with several technical elements highlighted to visualize a potential bearish reversal setup
🔹 Overall Structure
The price recently climbed into a rising wedge pattern, indicated by two converging trendlines. These trendlines slope upward but gradually tighten, showing weakening bullish momentum as the price attempts to push higher. The rising wedge is often considered a bearish reversal pattern, especially when it forms near a strong resistance area.
🔹 Resistance Zone
At the top of the wedge, there is a clearly marked resistance zone between approximately $145 and $147.50. This zone is shaded in red, representing a potential area where buyers might exhaust and sellers begin to dominate the chart illustrates a possible fake out or final push upward, where the price momentarily spikes above the wedge before sharply falling. This pattern often traps late buyers and triggers a strong downward move.
Support Levels
Two key support zones are marked:
1st Support: Around 132
2nd Support; Around 128
These zones represent areas where the price may temporarily pause or consolidate during the decline.
If you find it helpful please like and comments for this post and share thanks.

Solana: Is the Bottom In, or More Downside Ahead?SOL has already climbed more than 15% from last Friday’s low at its peak, potentially signaling the completion of wave ii in orange. For now, however, we’re still keeping open the possibility that this move could dip to a new low—within our green Target Zone ($155.80–$113.20). In any case, once this interim correction wraps up, wave iii in orange should kick off an impulsive rally, only losing steam above resistance at $295.31.

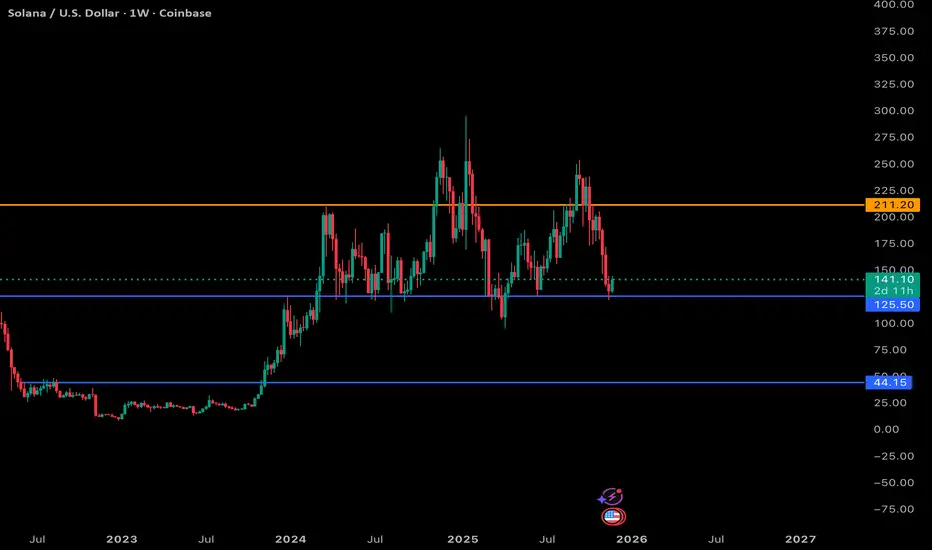
SOL UPDATE: My thoughts going into the Nov 28 2025 Weekend SOL is showing a solid reaction off the 125 support zone, which has been a major weekly level throughout this entire range.
As long as buyers defend this area, SOL can attempt a bounce back toward the mid-140s and potentially re-test the 170 region.
Still a choppy, range-bound structure overall, but this is the exact spot bulls needed to step in.
Solana Sophocatesas we marked the support and resistence of the solana chat , we can se it's bullish movement creating higher highs and higher lows , as long as seller are sitting at this level historically ; we have to wiat for the continuation of the trend and once it breaks we take our buy position with no fears

SOLUSDT Holds Support – Eyes on 148–150 ZoneLooking at the H4 chart, SOL has just broken above the green FVG cluster at 136–140 and is now holding above it, turning this area into new support. Multiple H4 candles closing above 140 indicate selling pressure below has weakened, and buyers are accepting higher prices.
The lower Ichimoku cloud is starting to curve up, signaling that the previous downward momentum has lost strength, and a corrective upswing is forming. Above, the large FVG cluster around 148–150 remains untested, likely acting as a “price magnet” for the current move.
My only forecast for SOLUSDT: I expect SOL to continue rising. In the short term, price may pull back slightly to 140–138 to retest the green FVG and attract more buying. As long as SOL holds above 136, these dips are just pullbacks within the uptrend.
From the current base, SOL could gradually climb toward 148–150 USDT, where strong FVG and resistance are located, making it an area to watch in the coming sessions.

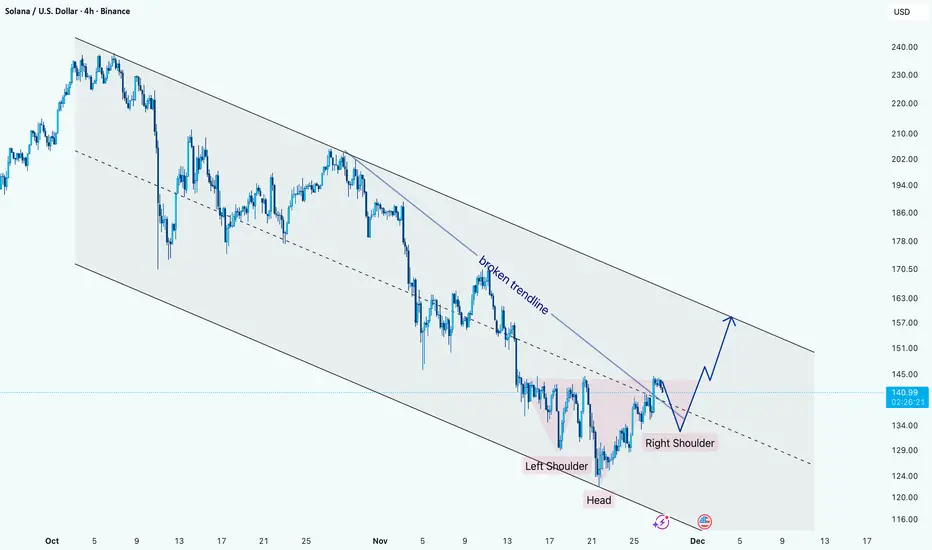
SOL Reversal Structure Forming Inside Downtrend ChannelHi!
Solana is trading inside a well-defined descending channel, but momentum is shifting. Price has broken the inner descending trendline and is now forming a clear inverse Head & Shoulders at the bottom of the structure.
The neckline zone has been tested multiple times, showing growing buyer strength. As long as price holds above the right-shoulder support, the structure favors a bullish continuation.
A breakout above the neckline opens the way toward the upper boundary of the main descending channel, with the next key reaction zone near $155–160. Failure to hold the right shoulder would delay the reversal and pull the price back toward mid-channel support.
$SOL - Overall SituationCRYPTOCAP:SOL - everyone sees this as H&S, but I'm Bullish on SOL.
Sol will start its race when nobody expects.
According to my last analysis, it has reached its first target; it could reach $126 too before the real move.

SOL USDHI GUYS,
Btc usd is moving, well SOL USD is following
NOTE. always use Btc analysis to confirm trades on small coins

Sol continues to hold up strongCRYPTOCAP:SOL is holding up well with only a shallow retracement to the 0.382 for wave (4)- the weekly 200EMA.
Price is above the weekly 200EMA, which is bullish, but lost the pivot, which is bearish, giving the overall pattern ambiguity. Wave C is underway, but looks near completion at wave 4’s expected Fib targets.
🎯 Terminal target for the business cycle could see prices as high as $660 based on weekly pivots
📈 Weekly RSI is bearish with room to fall, but doesn’t often reach oversold.
👉 Analysis is invalidated if we close back below $50, as wave 4 can not go below the 0.5 Fib.
Safe trading

SOL Fights Back After Breakdown – Is This Just a Relief Rally?SOL bounced from 125 lows but remains under key bearish OB zones between 180 and 220. Structure is still broken, and price is climbing into resistance.
MACD is curling up, and RSI pushed above 50 for the first time since early November — but there's no market structure break yet.
This move might be a relief bounce unless bulls reclaim 160 and start forming higher highs. Until then, bias remains cautious.
Bias: Neutral to Bearish
Pair: SOL/USDT
Timeframe: 12H
This is not financial advice, only data analysis. Please consult a qualified financial professional for personalized guidance.

SOL Daily Outlook | November 26, 20251hr timeframe has been pushing up to 144.69 beautifully above the 50ema. Lots of opportunity to catch long entries here inside the 1hr ranges.
Bias: We continue to push higher BULLISH

Breakout from falling wedge pattern?I think as soon as the EMA crossover VWMA occurs on the 1D that we will see a breakout from here. 1D macd bullish signal already occured in the meanwhile. Bulls are back!

SOL to Bottom Out Around $103-104SOLANA – Eyes on the Final Flush? 🔥 Key Confluence at $103–$104
Solana is approaching what might be the most important support zone of this entire macro structure. Several major technical factors are all pointing to the same potential bottom area:
🟢 1. Head & Shoulders Breakdown Target
The measured move from the H&S pattern puts the projected downside right into the $103–$104 zone, creating a textbook target alignment.
🟠 2. Long-Term Trendline Support (Orange)
Price is now dropping toward a multi-year rising trendline that has held since early 2024.
This line has acted as major dynamic support across multiple cycles, and SOL is now coming back to retest it.
🟣 3. Fibonacci 0.886 Retracement
The 0.886 retrace of the full macro move lands perfectly in the same area.
This fib level is often where deep retracements reverse during strong bullish expansions.
📉 Current Structure
– Breakdown from right shoulder confirmed
– Momentum still down, but seller exhaustion showing up
– Volume declining on the drop → typical late-stage correction behavior
📌 Key Zone to Watch
$103–$104 (Green Box)
This is my “high-probability reaction zone” where I expect Solana to bottom or at least produce a significant bounce.

SOL Daily Outlook | November 25, 2025Solana buyers in control. Price is above the 50ema with a strong push heading towards 144.69!
Bias: Bullish

SOL - The Next Collapse May Be InevitableCRYPTOCAP:SOL COINBASE:SOLUSD BINANCE:SOLUSDT BINANCE:SOLBTC
Fundamental Analysis:
Solana pumped strongly in 2020–2021 because it offered high speed, low fees and a new ecosystem that attracted developers and traders. The same thing happened again in 2024–2025, but this time the main driver was the huge wave of easy-to-create tokens and memecoins . Anyone could launch a coin in a few minutes and many of these tokens were dumped on the market with no real purpose. Now that most of these new coins are losing popularity and people are realizing that many were simply scams, activity on the Solana blockchain is starting to slow down. Even with the recent Solana ETFs, large investors will likely wait for a major price drop before buying, not during a hype phase that has already ended.
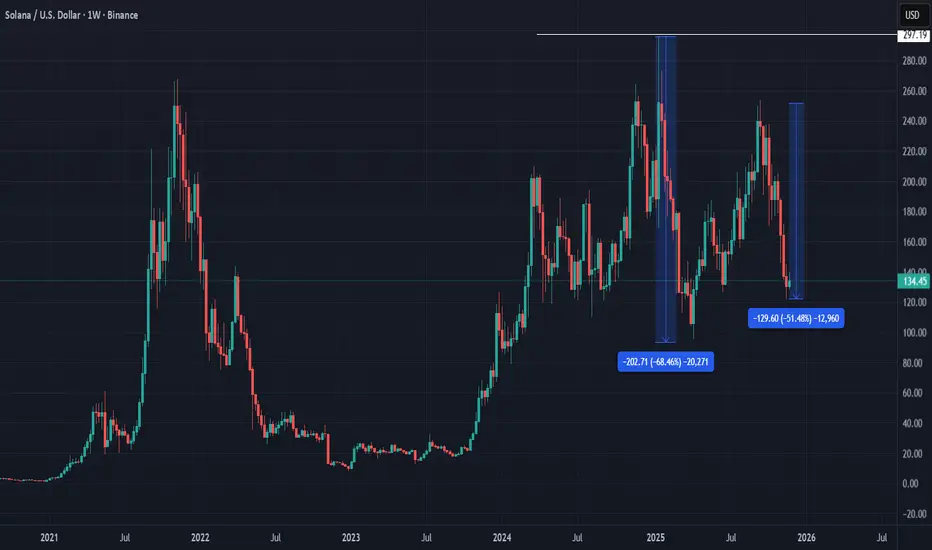
Technical Analysis:
The price almost hit $300, then made a very strong correction of around 68%. After that, the market struggled to bring the price back to $250, and it quickly fell again to around $135. This tells me that the zone between 200–300 was used by whales as a distribution zone. They sold heavily while the market was excited, and the weak recovery shows that buying pressure is not strong anymore.
My Expectation:
Because the fundamentals are weakening and momentum is fading, I believe the next range of distribution will move lower, likely around . If activity keeps dropping and no new narrative appears, holders may rush to exit and the price could fall sharply.
This is not a signal to short — it is only my personal point of view on how Solana currently looks to me.
Retrace in Solana UnderwayWe're getting very close to confirming a minor wave bottom that should get price into the target box. Afterwards, I look for a new local low in 2026 towards the $70 level. That should be bought like Crypto is going out of style.

Monthly Crypto Analysis: Solana (SOLUSD) – Issue 107 The analyst expects Solana’s price to decline by the specified end time, based on quantitative analysis.
The take-profit level only highlights the potential price range during this period — it’s optional and not a prediction that the market will necessarily reach it.
You don’t need to go all-in or use leverage to trade wisely.
Allocating just a portion of your funds helps keep overall risk low and ensures a more sustainable approach.
Our strategy is built on institutional portfolio management principles, not the high-risk, all-in trading styles often promoted on social media.
Results are evaluated over the entire analysis period, regardless of whether the take-profit level is reached.
The validity of this analysis is based on a specific time range (until 23 Dec 2025), and after this period, the analysis will be reviewed and updated (once every 28 days).

SOL USDHI GUYS,
We failed to sell today as i expected a break and retest.
however there was news toady shifting to a new sell structure.
Hopefully a few hours from now i expect sells as illustrated above.


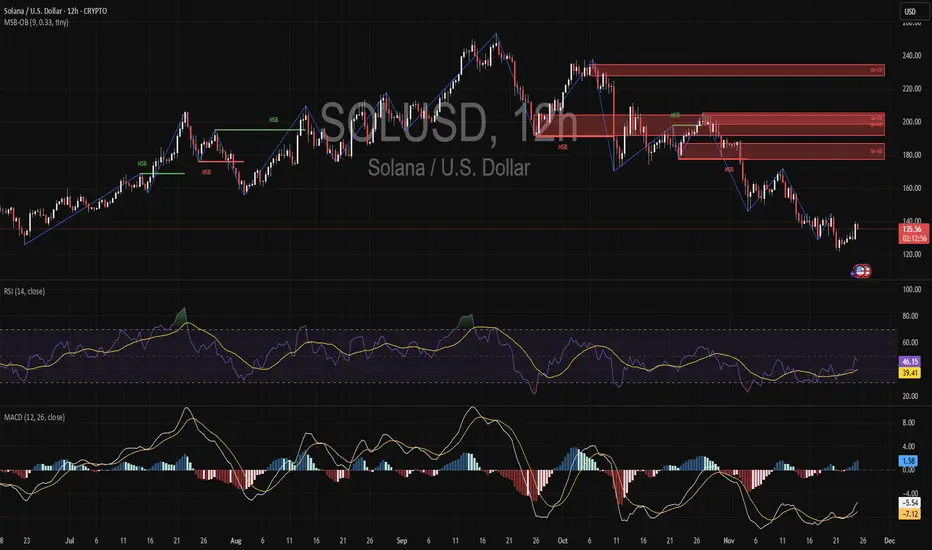
Solana Rejects Supply at 200 – Breakdown Just Getting Started?SOL rejected cleanly from stacked supply zones above 200 and confirmed a bearish market structure break on the 12H.
This rally looks exhausted, with a lack of momentum and no reclaim of key invalidation levels.
MACD is still trending down, RSI struggles to break 50, and previous support zones are now flipping resistance.
Unless bulls reclaim 150 fast, Solana could bleed back toward the 115–120 range.
No signs of strength yet. Bears holding the range.
Bias: Bearish
Pair: SOL/USDT
Timeframe: 12H
This is not financial advice, only data analysis. Please consult a qualified financial professional for personalized guidance.