Capital Flows Impacted1. Understanding Capital Flows
Capital flows are broadly classified into two categories:
Foreign Direct Investment (FDI):
Long-term investments in physical assets like factories, infrastructure, or real estate. FDI represents stable and sustainable investment because it indicates confidence in the host country’s economy.
Portfolio Investment:
Short-term investment in financial assets like stocks, bonds, or other securities. These flows are more volatile, as investors can quickly withdraw funds based on changes in risk perception or economic conditions.
Other Capital Flows:
These include banking sector flows, loans, and remittances. While remittances are generally stable, banking flows can fluctuate depending on interest rates and credit conditions.
Capital flows contribute to a country’s balance of payments, affect exchange rates, and determine the availability of foreign reserves. They can enhance investment, technology transfer, and job creation, but excessive inflows or sudden outflows can destabilize financial markets.
2. Factors Impacting Capital Flows
Capital flows are influenced by both push factors (conditions in advanced economies) and pull factors (conditions in emerging markets).
a. Global Interest Rates
One of the most powerful influences on capital movement is the difference in interest rates between countries.
When interest rates in advanced economies like the United States rise, investors tend to pull money out of emerging markets to take advantage of higher returns on safer assets such as U.S. Treasury bonds.
Conversely, when global interest rates are low, investors seek higher yields in developing countries, leading to capital inflows.
For example, during the U.S. Federal Reserve’s monetary tightening cycles, emerging markets like India, Brazil, and Indonesia often experience capital outflows and currency depreciation.
b. Inflation and Macroeconomic Stability
High inflation reduces the real return on investments, making a country less attractive for foreign capital. Investors prefer economies with stable prices and predictable policy environments. Macroeconomic instability—such as high fiscal deficits, political turmoil, or weak governance—can trigger capital flight as investors look for safer destinations.
c. Exchange Rate Movements
Exchange rate expectations play a crucial role in capital flow decisions.
If investors expect a currency to appreciate, they increase inflows to benefit from exchange gains.
If depreciation is expected, capital outflows intensify as investors try to avoid losses.
Unstable or artificially managed exchange rates can also discourage long-term investment, as they create uncertainty about future returns.
d. Trade and Investment Policies
Governments that promote open trade, ease of doing business, and investor-friendly policies tend to attract more capital. On the other hand, restrictive trade policies, high tariffs, or uncertain regulatory environments discourage investors.
For example, India’s liberalization reforms in the 1990s led to significant FDI inflows, while policy uncertainty in some developing countries has caused capital to dry up.
e. Geopolitical and Global Uncertainties
War, sanctions, political instability, and diplomatic tensions often lead to abrupt shifts in capital flows. Investors seek safe-haven assets such as gold, the U.S. dollar, or Swiss franc during uncertain times. The Russia-Ukraine war and tensions in the Middle East have both demonstrated how quickly capital can move in response to global crises.
3. How Capital Flows Impact Economies
The impact of capital flows can be both positive and negative, depending on their nature, duration, and management.
a. Positive Impacts
Boost to Investment and Growth:
Inflows of foreign capital provide funds for domestic investment, which can increase productivity, job creation, and infrastructure development.
Technology Transfer and Knowledge Sharing:
FDI often brings advanced technologies, managerial skills, and innovation to the host country, improving competitiveness.
Strengthening of Financial Markets:
Portfolio inflows increase liquidity in stock and bond markets, deepening the financial system and promoting market efficiency.
Improved External Balances:
Stable capital inflows help countries finance current account deficits and build foreign exchange reserves.
b. Negative Impacts
Volatility and Financial Instability:
Short-term capital, especially portfolio flows, can exit the market rapidly, leading to sharp currency depreciation, stock market crashes, and financial crises.
Exchange Rate Appreciation (Dutch Disease):
Excessive capital inflows can cause the local currency to appreciate, making exports less competitive and hurting the manufacturing sector.
Asset Bubbles:
Large inflows can fuel speculative investments in real estate or equities, inflating asset bubbles that may burst later.
Dependency and External Vulnerability:
Over-reliance on foreign capital can make an economy vulnerable to global shocks. Sudden outflows can lead to liquidity crises, as witnessed during the 1997 Asian Financial Crisis.
4. Historical and Contemporary Examples
Asian Financial Crisis (1997–98):
Rapid capital inflows into Southeast Asia fueled credit and asset bubbles. When investor confidence collapsed, massive outflows led to currency crashes and economic recessions.
Global Financial Crisis (2008):
In the wake of the crisis, developed nations lowered interest rates, leading to a surge in capital inflows to emerging markets like India and Brazil. However, these flows reversed when the U.S. signaled policy tightening in 2013, causing the “taper tantrum.”
COVID-19 Pandemic (2020):
The pandemic caused unprecedented global uncertainty, leading to sudden capital outflows from emerging markets. Later, massive liquidity injections by central banks brought capital back, especially into tech and healthcare sectors.
Current Scenario (2023–2025):
Persistent global inflation, high U.S. interest rates, and geopolitical instability have created volatile capital movements. Many emerging markets are witnessing capital outflows due to a strong U.S. dollar and rising global risk aversion.
5. Policy Measures to Manage Capital Flow Impacts
Governments and central banks use various strategies to mitigate the negative effects of volatile capital movements:
Monetary Policy Adjustments:
Central banks can use interest rate changes to stabilize currencies and control inflation, influencing the direction of capital flows.
Foreign Exchange Reserves:
Maintaining adequate reserves helps cushion against sudden outflows and currency volatility.
Capital Controls:
Temporary restrictions on certain types of inflows or outflows can prevent speculative attacks and financial instability.
Macroprudential Regulations:
Strengthening the banking system through regulations reduces the risk of asset bubbles and credit booms fueled by capital inflows.
Fiscal Discipline:
A sound fiscal policy framework reassures investors of a stable economic environment, encouraging long-term investment.
6. Conclusion
Capital flows are a double-edged sword in the global economy. While they promote growth, innovation, and development, their volatility poses challenges to economic stability. Managing capital flows effectively requires a careful balance between openness and prudence.
Countries must design policies that attract long-term, productive investments while shielding their economies from the adverse effects of short-term speculative movements. As globalization deepens, the interdependence of financial markets means that even local policy decisions can have global repercussions. Therefore, maintaining financial stability amid changing global capital dynamics remains one of the most critical tasks for modern policymakers.
In essence, capital flows reflect not just the movement of money but the pulse of global confidence — a signal of how nations are perceived in an interconnected economic world.
Trade ideas

SOLANA entered into bearish territory, targeting $105.Solana (SOLUSD) closed last week below its 1W MA50 (blue trend-line) for the first time since July 28 2025. This is an extension of the downtrend that started following the September 15 High, which took place right below the Resistance Zone that started back on the November 2021 Cycle Top.
This is a critical Resistance as it rejected the price another 2 times during this Bull Cycle, with the most recent causing the January - April correction to the 1W MA200 (orange trend-line).
Given the huge 1W RSI Bearish Divergence for almost 2 years now (Lower Highs), we expect last week's closing below the 1W MA50 to initiate the bearish extension towards the 1W MA200 (at least) again. Our Target is $105.00.
---
** Please LIKE 👍, FOLLOW ✅, SHARE 🙌 and COMMENT ✍ if you enjoy this idea! Also share your ideas and charts in the comments section below! This is best way to keep it relevant, support us, keep the content here free and allow the idea to reach as many people as possible. **
---
💸💸💸💸💸💸
👇 👇 👇 👇 👇 👇

Double top after ascending triangle: 163$ will be retestedDouble top occurred at COINBASE:BTCUSD and at $COINBASE:SOLUSD. 163$ will be retested. I think we will see a bounce from there.

SOLUSD⬆️ Buy Range: 156.100 - 153.000
⏹️ Stop Loss: 140.000
*️⃣ Take Profit: 172.800 - 179.000
🔠 Upward movement from medium-term support.

SOLUSD Looking strong selling from key resistance area📉 SOL/USD Technical Update (1H Timeframe)
SOL/USD showing a strong downtrend, with fresh selling pressure emerging from the resistance area around 156.27.
🎯 Technical Targets:
Support 1️⃣: 150.85
Support 2️⃣: 146.60
The momentum remains bearish — watch for potential continuation moves as long as price stays below key resistance levels.
⚠️ Risk Management Reminder:
Always apply proper risk and position management — protect your capital first.
💬 Like • 💡 Comment • 🔁 Share • ✅ Follow for more technical insights

BTC ETH SOL Ready for a DIVE?Just a knee jerk high bounce before a waterfall event into Wednesday...


Bitcoin, Ether and SolanaBITSTAMP:BTCUSD
COINBASE:SOLUSD
COINBASE:ETHUSD
Looking for this on the crypto market. Bullish narrative across the arena

The show must o on - SOL weekly update Nov 09 - 15thThe show must go on - even after my last analysis on Solana failed. In this analysis, I want to rework this and go through the current structure to evaluate where we are and what to expect.
So where are we?
First coins pumped, most coins show the end of their corrective movement and Ethereum and Solana are standing still although the long desired Altseason seems to start. Meanwhile, ETF flows show inflows over the past weeks. The liquidity heatmap shows massive amounts of liquidity above the current price and funding rates stay low to negative. The current structure suggest an ending of the current corrective movement, or atleast there should be a move upwards in the short-term. Looking at the current macro environment, the Fed ends its quantitative tightening and may be starting quantitative easing in december, as the Deutsche Bank expects. Not only the Deutsche Bank, but also do I expect the Fed to start QE. Not because of weakening economy but because of monetizing the US debt and preventing a liquidity crisis which can lead to a bank run in the future. For short: they don't have a choice but to start pumping liquidity into the market and economy.
This is my opinion on Solana and crypto as requested and I do suggest to slowly DCA into several cryptos to save the value of your money and maybe also profit off this cycle.

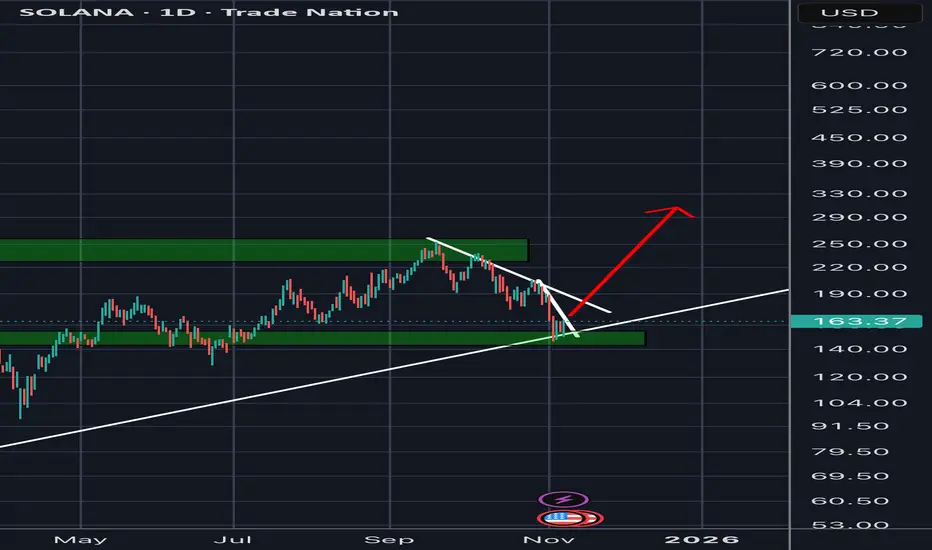
Ascending triangle formed!I think that an uptrend has become inevitable from here. 158$ marks our new support for Solana (BTCUSD already marked it).
We will again see some retracement at 175$. When we breakout of the big descending channel , a way higher price becomes inevitable too. I’m sure that the big cup and handle pattern can still playout (see linked idea).

SOLUSD - Bullish Structure eyeing 160+ TargetPrice is currently retesting a key resistance zone around 158.20–158.60, an area that has rejected price multiple times. The market has formed a series of higher lows, showing increasing bullish momentum as buyers continue to step in earlier on each pullback.
If price can break and close above this resistance zone with strong volume, it would confirm a potential bullish breakout, opening the path toward the next imbalance/target zone around 160.50–162.00.
However, failure to break above may result in another short-term pullback into support, so confirmation is important.
Bullish Bias as long as price holds above the higher-low structure
Breakout above resistance = continuation toward target zone
Watch for rejection candles or weak breakout attempts

(SOL) Spot Long 10-08-2025SOL /We have Government Shutdown Ending, ETF's, Clarity Act, Trump Tariffs Blocked, New Chair of the Federal Reserve, QE, & Maybe Stimulus Checks for the USA Taxpayers all Incoming Soon!
Plus,
Fear = Oversold = I Buy = $
SOL will RISE!
:)

SOL holds up wellCRYPTOCAP:SOL Price continues lower in the channel, a textbook ABC correction so far.
Wave 1 ended with a wedge throw-over. Price has found support above the Fibonacci golden pocket and High Volume Node at the channel's lower boundary. The probability is a continuation to the downside with a target of $140.
📈 Daily RSI tapped oversold with no divergence to suggest a bottom
👉 Continued downside brings up the $112 target, a great buy opportunity
Safe trading

SOLANA TECHNICAL UPDATE (4H Chart)
After months of bullish momentum, SOL/USD just broke below the trendline — showing early signs of bearish reversal.
📉 Setup Idea:
Price broke trendline support
Now retesting the $174–182 resistance zone
If rejection confirms, next targets →
🎯 TP1: $140
🎯 TP2: $95–100
⚠️ Invalidation:
If price closes above $182, bearish setup fails.
This is a classic break–retest–continuation pattern — watching for confirmation before entry

Long SolanaTrading Fam,
Received a buy signal from my indicator on Solana the other day. Inside a nice liquidity block, above the 200/350 SMA, and inside a bullish triangle. I'll easily take this trade all day. But with the crypto market continually disappointing, I am not going to risk more than an 8% loss here. Shooting for a target of around 32% profits brings my rrr to a 1:4. Best of luck!
✌️Stew

SOLANA (SOL/USD) 4H: Massive Double Top Breakdown Confirmed!🔥 SOLANA (SOL/USD) 4H: Massive Double Top Breakdown Confirmed! 🔥
The Hunt for Support Below $175 is On
The SOL/USD 4-Hour chart has confirmed a major bearish shift, driven by the breakdown of a large Double Top pattern (or a complex M-top structure) that formed between $175 and $205. This pattern reversal, often a powerful signal, has initiated a sharp correction, erasing significant gains.
The critical $175 support (the neckline of the double top) has been definitively broken, confirming the bearish trend and paving the way for further downside measured moves.
Key Levels Defining the Current Range
The price is currently in a highly volatile phase, testing resistance levels as it attempts to find a stable base.
🛡️ Immediate Resistance (Key Zone): $160 to $165 (Green Zone)
This is the area where the price is currently struggling. It was briefly reclaimed but failed to hold, turning it into the most immediate and critical resistance. Bears are defending this zone aggressively.
📉 Immediate Support (The Floor): $146 to $148
This is the recent swing low and the first crucial support level. The price bounced strongly from this area, which suggests buying interest is present, but it must hold on subsequent retests.
🛑 Major Overarching Resistance: $190 to $195
Reclaiming this zone is necessary to put an end to the mid-term bearish outlook. Until then, any movement below it is considered corrective.
🚨 Ultimate Bear Target: $135 (Major Demand Zone)
If the immediate support of $146–$148 breaks, the next major target derived from the pattern breakdown is the deep demand zone around $135.
What's Next for Solana? Two Critical Scenarios
Bearish Continuation (The Dominant Trend):
The price is rejected at the $160–$165 resistance zone.
Bears drive the price back down to test the $146–$148 low.
A decisive break and close below $146 confirms the continuation of the pattern breakdown, with $135 becoming the primary target.
Bullish Relief (The Reversal Attempt):
Bulls manage to successfully push the price above $165 and hold it.
This would signal that the local correction is over and could lead to a relief rally to test the original breakdown zone at $175 (now acting as formidable resistance). A move to $175 would be a good sign, but the primary trend remains down until $195 is reclaimed.
Conclusion: The path of least resistance remains downward following the breakdown from the $175 neckline. Traders should watch the $160–$165 zone for potential short entries and $146–$148 as the critical support line.
Disclaimer:
The information provided in this chart is for educational and informational purposes only and should not be considered as investment advice. Trading and investing involve substantial risk and are not suitable for every investor. You should carefully consider your financial situation and consult with a financial advisor before making any investment decisions. The creator of this chart does not guarantee any specific outcome or profit and is not responsible for any losses incurred as a result of using this information. Past performance is not indicative of future results. Use this information at your own risk. This chart has been created for my own improvement in Trading and Investment Analysis. Please do your own analysis before any investments.

SOL to $4500?Internet Capital Markets
I believe Solana is going to take over the entire financial system.

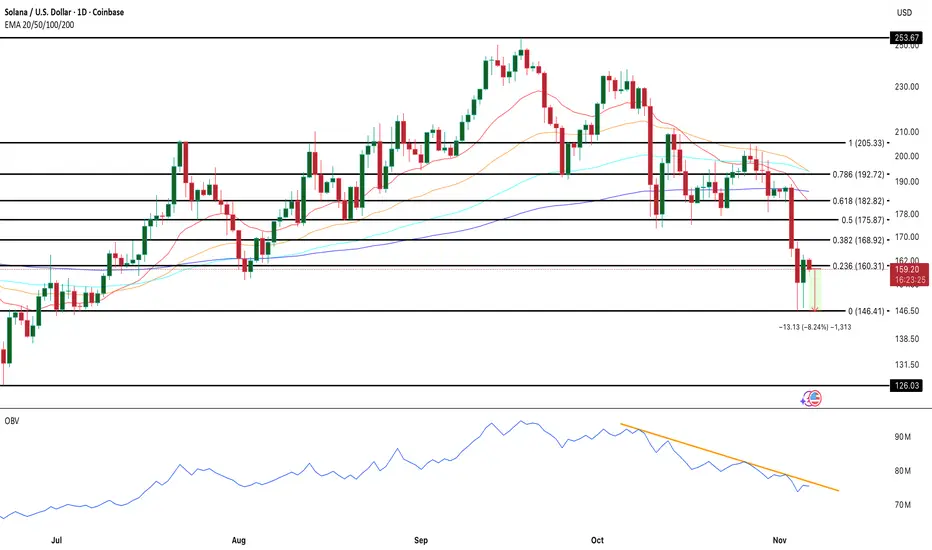
Solana Faces Key Technical Imbalance Ahead of Next MoveCOINBASE:SOLUSD trades near $159, caught between weakening technicals and fading volume strength. On the daily chart, a bearish crossover is forming, with the 50-day EMA on the verge of slipping below the 100-day EMA, hinting that sellers still control momentum. The On-Balance Volume (OBV) remains trapped under a descending trendline — every touch since mid-October has triggered short-lived rebounds.
Key support for COINBASE:SOLUSD sits at $146; a daily close below this could open the path toward $126. On the upside, bulls need a clean break above $168 to shift momentum, with further resistance at $182–$192.
On-chain data adds weight to the bearish tone: exchange flows flipped from heavy outflows to inflows this week, suggesting selling pressure is returning. Until OBV and money flows align with price action, Solana’s recovery remains fragile.
Solana Wave Analysis – 5 November 2025- Solana reversed from key support level 150.00
- Likely to rise to resistance level 175.20
Solana cryptocurrency recently reversed from the support area between the key support level 150.00 (which stopped the previous sharp downward correction (2) at the start of October), lower daily Bollinger Band and the two support trendlines from June and April.
The upward reversal from the support area stopped the impulse C-wave of the earlier ABC correction (2) from September.
Given the strength of the support level 150.00 and the oversold daily Stochastic indicator, Solana cryptocurrency can be expected to rise to the next resistance level 175.20 (former support from October).

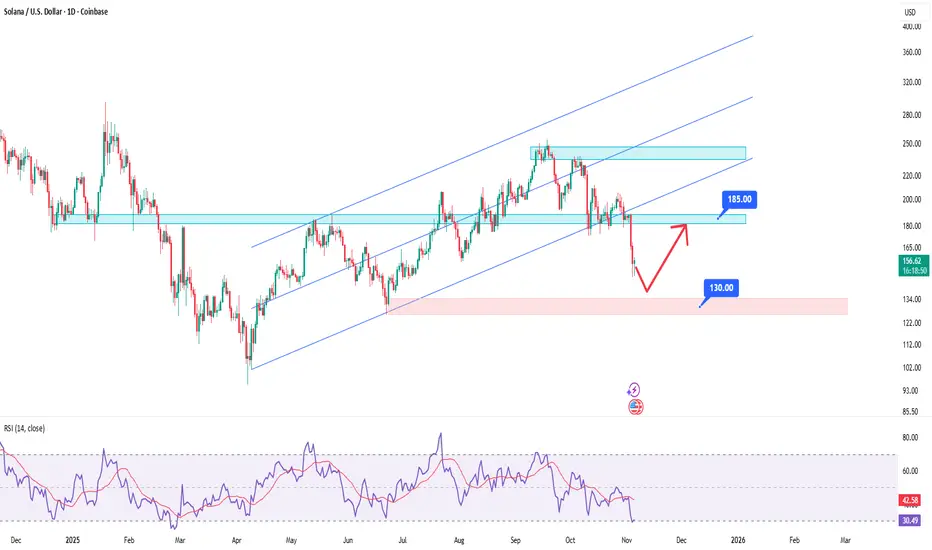
Solana price path for the next days🚨 NOT a financial advice, do you own analysis TOO.
SOL lost some of its important supports but hope is still there. dont panic because of the recent market selloff.
despite the terrifying current situation i am hopeful for solana price. the RSI indicator has reached the oversold zone meaning the strength of sellers is weakening. however there is still room for further decline.
as illustrated in the chart i expect the price to fell to 130 if BTC Dominance increase as well. hence, we can make sure that sellers are out.
SOL/USD Looking sell from consolidation area 📉 SOLUSD Technical Update
SOLUSD showing selling pressure after a consolidation breakdown.
Currently retesting near $164.00, acting as a potential sell zone.
🎯 Technical Target: $156.80 (support zone)
🕐 Time Frame: 1H
Traders should monitor price action closely and apply proper risk management.
💬 Like | 💭 Comment | 🔁 Share

The most important uptrend line for SOLUSDAll crypto assets are way oversold these days (but everyone knows that already). This is totally understandable due to the longer government shutdown and other uncertainties (usual 4 year cycle which is normally already ended now).
It would not surprise me if we go further down than 150$ right now. Only because of the fact that BITSTAMP:BTCUSD even went below 100.000$ today!
In the most worst scenario, it really needs to bounce from the white uptrend line if we still want to see a better Q4 this year or Q1 2026.
According to the fib. retracement level this normally should be a good buy opportunity. If it holds above the white trend line, then we are still inside the ascending triangle (which is a bullish pattern).
