When Profit Comes, Leave Before It Vanishes Again. how??!!Have you ever stayed in a winning trade just to get more?
That voice whispering “keep it longer, this might be the big one”?
It’s the same voice that’s emptied thousands of portfolios...
Hello✌️
Spend 2 minutes ⏰ reading this educational material.
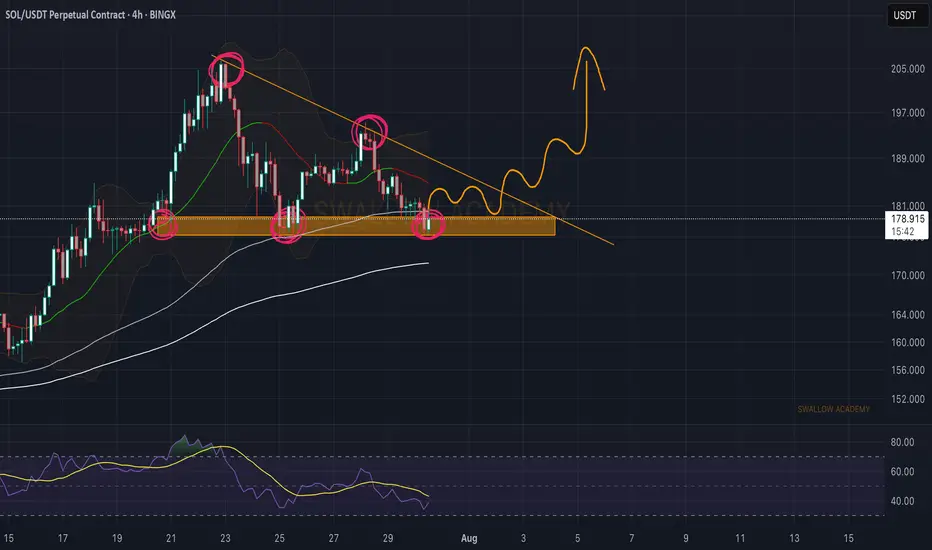
🎯 Analytical Insight on Solana:
BINANCE:SOLUSD

SOL's Golden Pocket: Is This the Bottom?SOL just tapped into the golden pocket zone and swept sell-side liquidity. Creating a high-probability long opportunity.
🟢 Long Setup:
Entry Zone: $156.67 – $151.50
Stop Loss: Below $150 (clear invalidation)
Target: $172
Risk:Reward: solid R:R setup
Why This Zone? Confluence Breakdown:

SOL/USDT | SOL Drops 25% – Approaching Key Buy Zone at $136–$148By analyzing the Solana chart on the daily timeframe, we can see that, like the rest of the market, it's undergoing a correction — dropping over 25% from the $206 area so far. Solana is now approaching a highly attractive buy zone between $136–$148, so be sure to closely monitor the price reaction i

SOL may test 170 before fallingThe SOL structure is quite weak. The price previously broke the upward trend and entered the range of 170-157 as part of a downward movement.
The market is reacting to Bitcoin's rebound, and in this case, SOL may test resistance at 169-170 before falling.
The upward trend has been broken by a H&S r

Lingrid | SOLUSDT Corrective Move Completed ? Long OpportunityBINANCE:SOLUSDT is forming a bullish higher low just above the 158.47 support after a corrective pullback from the recent higher high. Price structure remains within the upward channel, and the rebound from key horizontal support signals a continuation setup. As long as the 158.47–160.00 zone holds

Solana Update · Retrace, Bears & The Bullish BiasSolana had a retrace in May. Notice the 19-May date on the chart. This retrace produced four weeks red. The bullish move that led to this retrace lasted 6 weeks. The last rise lasted five weeks and the current retrace might last only two weeks, can be less.
We are seeing Solana rising but this rise

SOL Both scenarios are valid! SOL is still bullishSOL Both scenarios are valid! SOL is still bullish
SOL is in a critical zone. The price is still inside a large bullish pattern and as long as it stays inside the pattern, the trend remains bullish and SOL should follow the bullish scenario.
The bullish targets are at 205, 214 and 224
It may happ

80% drop into the abyss for Solana? - July 2025** The months ahead **
Examination of the 3-week chart for SOLANA reveals several compelling technical signals that suggest a potential bearish trend reversal. This analysis highlights crucial patterns traders and investors of Solana should consider.
1. Formation of a 3-Week Death Cross:
A nota


Solana (SOL): Triangle Pattern | Waiting For Bullish BreakoutSolana failed to break down from the local neckline zone (or support zone, for those who want to call it that). What we got instead is buyside dominance, where buyers took back the area and are now pushing the price back toward the upper side of that triangle pattern, so that's where our current tar
See all ideas
Summarizing what the indicators are suggesting.
Oscillators
Neutral
SellBuy
Strong sellStrong buy
Strong sellSellNeutralBuyStrong buy
Oscillators
Neutral
SellBuy
Strong sellStrong buy
Strong sellSellNeutralBuyStrong buy
Summary
Neutral
SellBuy
Strong sellStrong buy
Strong sellSellNeutralBuyStrong buy
Summary
Neutral
SellBuy
Strong sellStrong buy
Strong sellSellNeutralBuyStrong buy
Summary
Neutral
SellBuy
Strong sellStrong buy
Strong sellSellNeutralBuyStrong buy
Moving Averages
Neutral
SellBuy
Strong sellStrong buy
Strong sellSellNeutralBuyStrong buy
Moving Averages
Neutral
SellBuy
Strong sellStrong buy
Strong sellSellNeutralBuyStrong buy
Displays a symbol's price movements over previous years to identify recurring trends.