Solana (SOL): Good Buying Opportunity Incoming | June 2025Solana is gathering buyside volume, and we are back near daily timeframes of the 200 EMA, which might be our breakout for an upcoming long position.
More in-depth info is in the video—enjoy!
Swallow Academy
SOLUSDT.P trade ideas

Weekly Altcoin Analysis – XRP, BNB, SOL, DOGE, ADA
🚀🔥 Don’t forget to FOLLOW & hit the ROCKET button for more weekly altcoin setups! 🔥🚀
♦️ Weekly Altcoin Analysis – XRP, BNB, SOL, DOGE, ADA ♦️
Starting this week, I will publish weekly analyses of the top coins on CoinMarketCap.
Since I analyze BTC and ETH daily, this review will begin from the third coin onward.
💎 XRP
🚀 Entry Trigger: Breakout above 3.25 – entering here makes the breakout of 3.33 easier.
⭕ Resistance: 3.33 may act as a strong barrier.
❗ Stop-Loss: 2.90
💎 BNB
✅ Entry Trigger: The entry level was 786.1, which has already been surpassed.
🔄 Plan: Wait for a pullback, formation of new highs and lows, and then breakout of the new high.
💎 SOL
🚀 Entry Trigger: 192.5 for long positions.
❗ Stop-Loss: 176.4 (around 8% lower).
💎 DOGE
❓ Entry: No clear trigger yet.
⭕ Suggestion: Possible entry at 0.25 with lower capital and strict risk management.
❗ Stop-Loss: 0.221004
💎 ADA
🚀 Entry Trigger: Breakout above 0.8405.
❗ Stop-Loss: 0.7591.
🔥 Key Notes:
1️⃣ All setups are based on the 4H timeframe.
2️⃣ A drop in BTC dominance below 60.83 and then 60.42 = confirmation for holding long positions and a new trend formation.
3️⃣ TOTAL, TOTAL2, TOTAL3, and USDT.D levels remain the main factors for confirming these setups (explained in my previous analysis).
4️⃣ ⭕ Caution: There’s a high chance of fake breakouts and stop-outs in these positions. Use risk and capital management.
👇 Make sure to read my complete market, BTC & ETH analysis in the link below. 👇
🚀🔥 FOLLOW & smash the ROCKET to keep these analyses coming! 🔥🚀
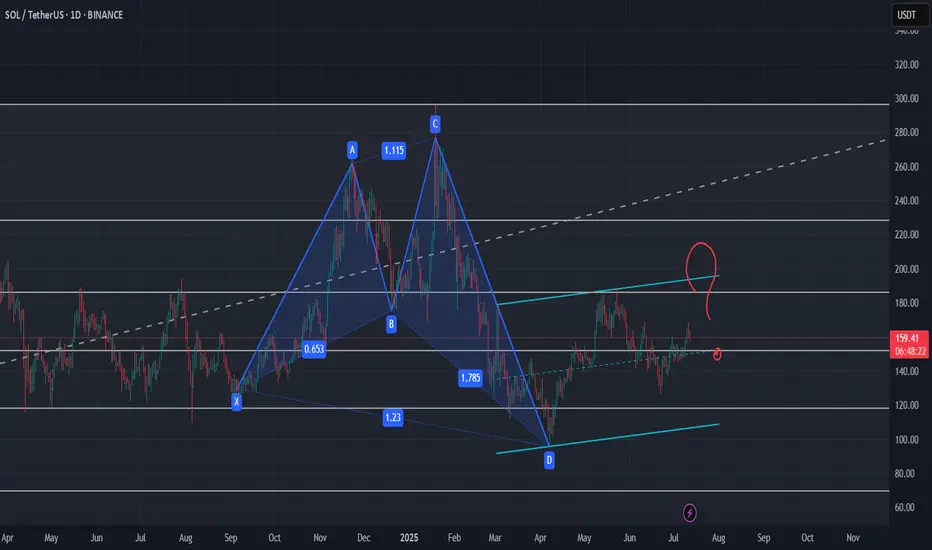
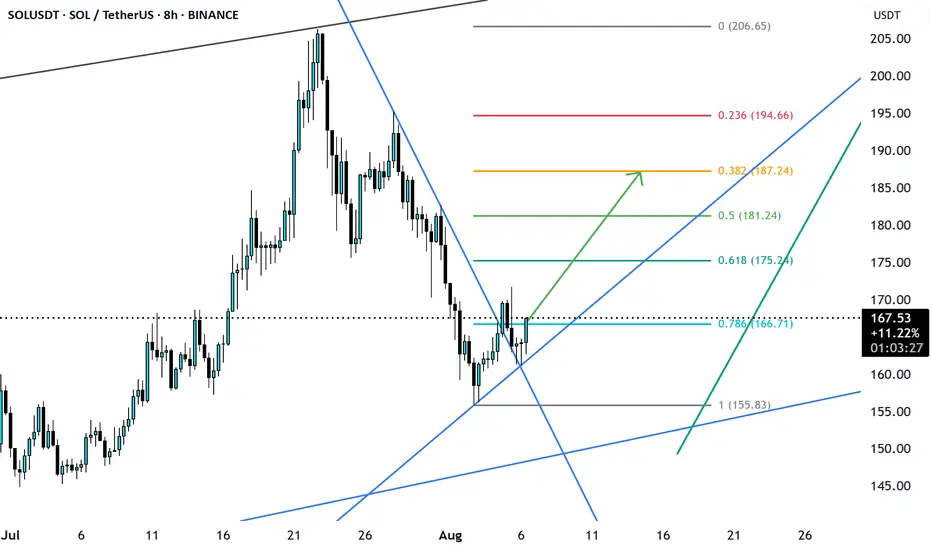
HARMONIC PATTERN on Daily for SOL ?I wonder if this pattern is the one which is highlighted by our friend and chart analyst @The_Alchemist_Trader_
Let's see if it need to test one last time the support of this channel or if it will break out for the long waited rally.
Level to keep an eye :
0.5 Fib support need to hold and clean breakout of the 0.382 Fib
Indicators : RSI, volume and volatility (liquidations)
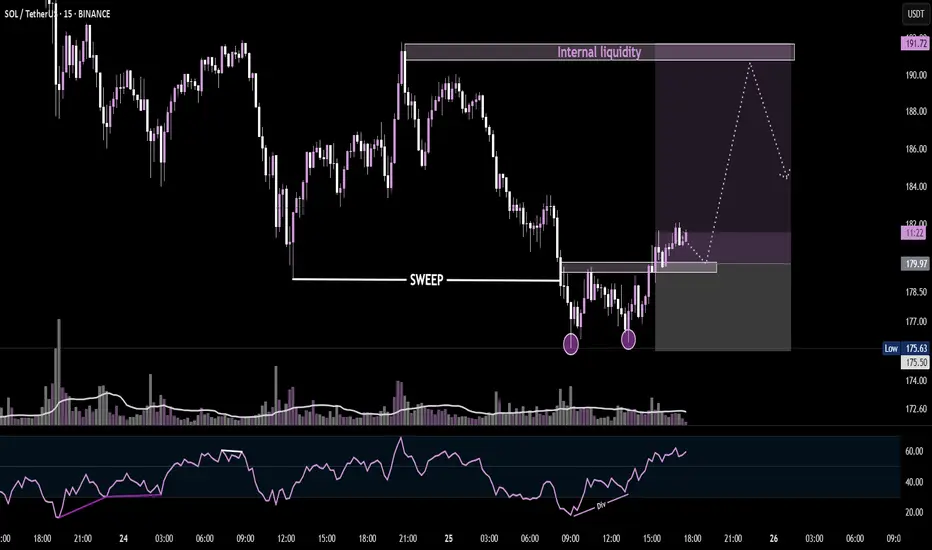
SOL/USDT - 15MINrice swept previous lows, formed a double bottom with bullish RSI divergence, and is now consolidating above the sweep zone. If support holds, we may see a rally into the internal liquidity zone around $191. Keep an eye on structure and volume confirmation for the next leg up.
Just like #AKRM, #SOL can also pump 100%Just like #AKRM, #SOL can also pump 100%..
SOL will also have this kind of exit rally. Whether there is a war between the US, Iran, and Israel or not, the market will crash very badly.

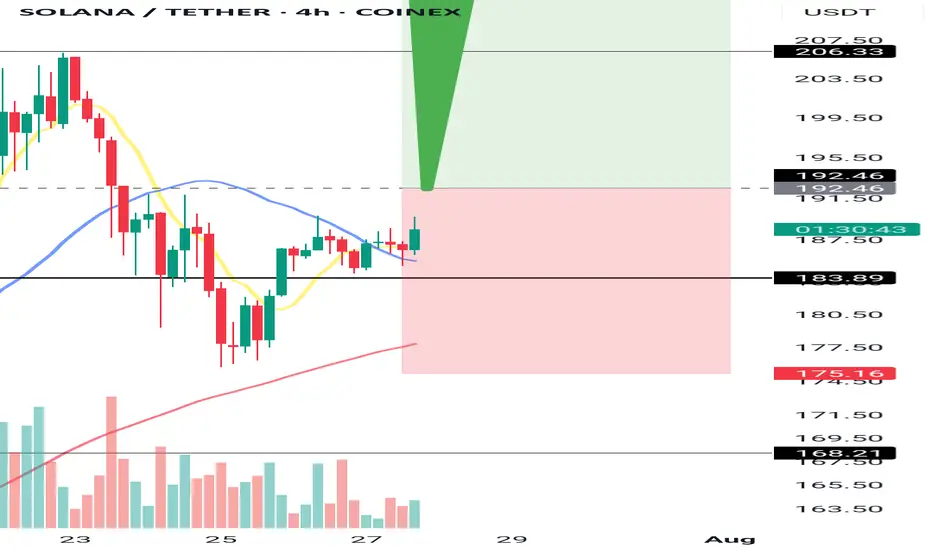
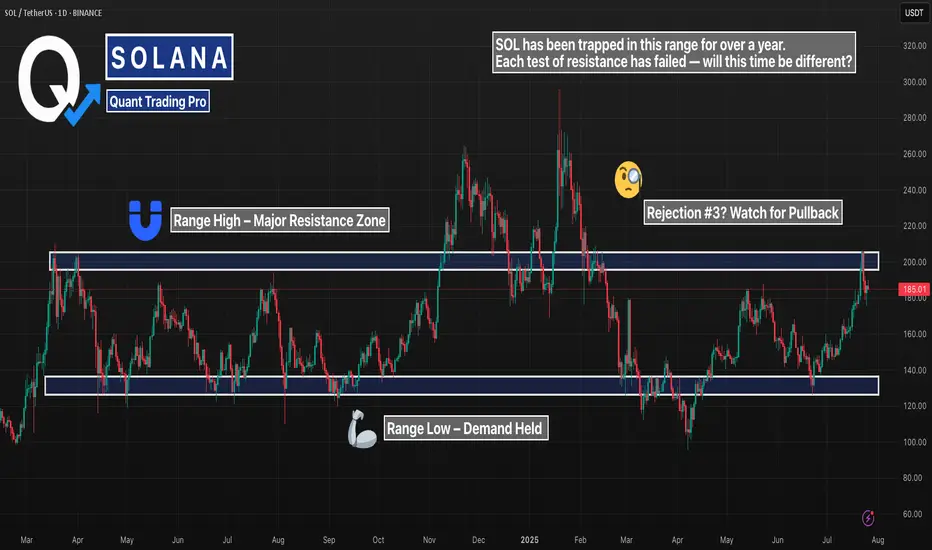
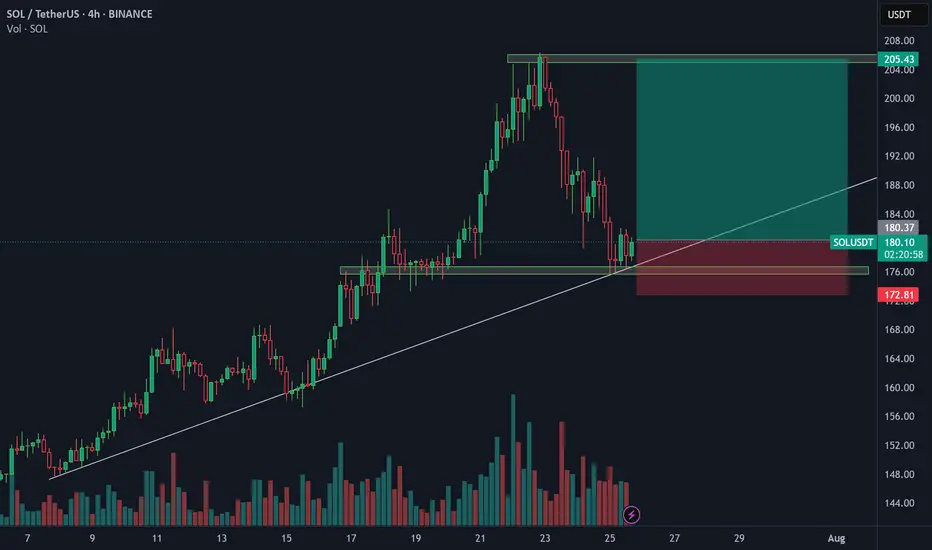
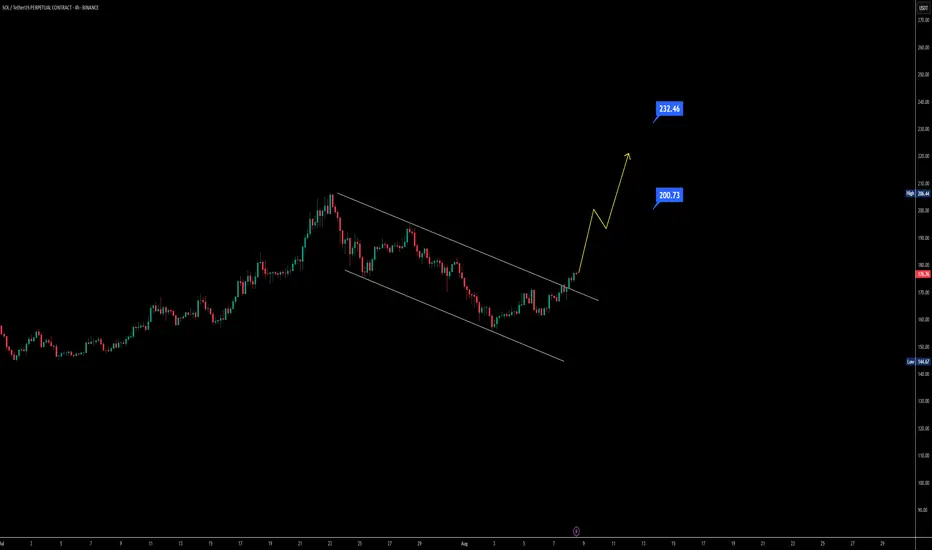
SOL 1D – Range High Rejected… Again?Solana just tapped major resistance — the same level that’s capped every rally since early 2024. This is now the third clean rejection off the $200 zone, and the structure couldn’t be more clear:
– Long-standing range between $115 and $200
– Previous rejections at the top led to full retracements
– This latest attempt? Rejected again — for now
If bulls want to flip the script, they’ll need a confirmed breakout with volume and a clean retest. Otherwise, this chart is screaming “range still intact.”
Until proven otherwise, this zone remains supply-heavy. Keep your risk tight — the next leg could move fast.
#Solana #SOL #RangeTrading #ResistanceZone #CryptoAnalysis #TechnicalBreakdown #QuantTradingPro #PriceAction
SOL LONGSolana is bouncing off the support level and the ascending trendline. Bullish movement is expected to continue and reach $205
SOL short (Execution in <48 hours)After touching the 156 region, SOL has been in an uptrend trading back into the mid 170's
Here's my setup for the trade:
Reason : Order block slightly above previous resistance level.
Expecting a break through resistance, clearing stops before retracing to the mid 170's.
Entry : 184.5 - 186.7 ($2 spread depending on your broker/exchange)
Stop Loss : 187.5 (Anything above that invalidates the analysis)
Take Profit : 175 (Closest Liquidity Pool)
N.B;
This analysis is just my overview based on the current market outlook and is NOT FINANCIAL ADVICE!!!
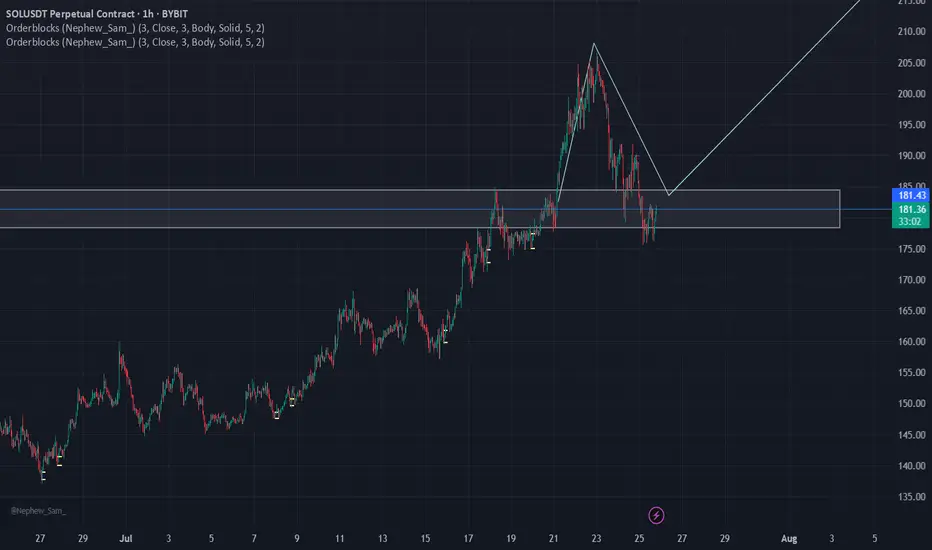
Solana consolidated above the descending wedge ┆ HolderStatBYBIT:SOLUSDT rotated higher after a swift corrective channel, reclaiming the mid‑range and pushing back toward the 195–205 supply. The chart highlights repetitive triangle resolutions and a strong sideway accumulation before the last impulse, suggesting ongoing demand. Immediate support sits at 176–180 and 168–170; holding above keeps attention on 195, then 205. A breakout through 205 unlocks 210–215 near the upper trend band. Only a daily close beneath 168 would compromise the structure and re‑open 155–160. Until then, dips remain buyable with targets at 195/205.

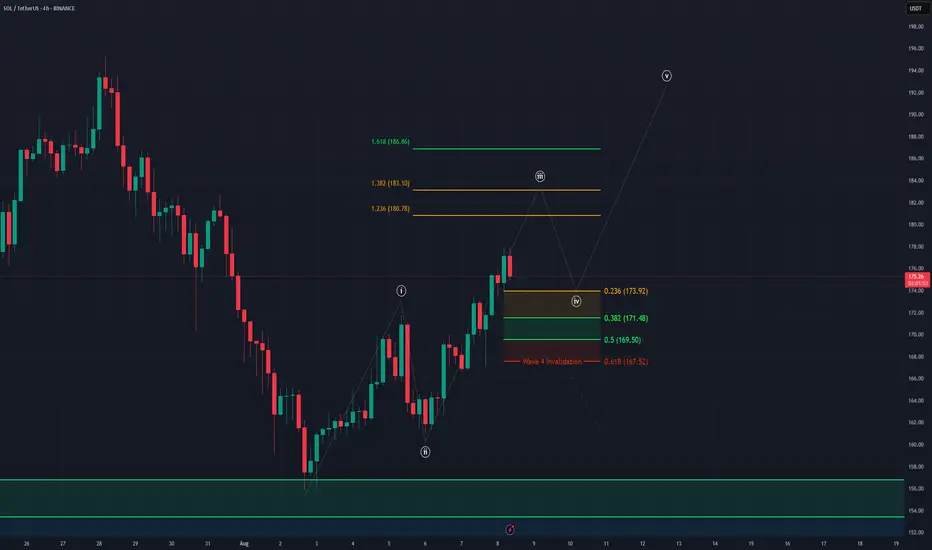
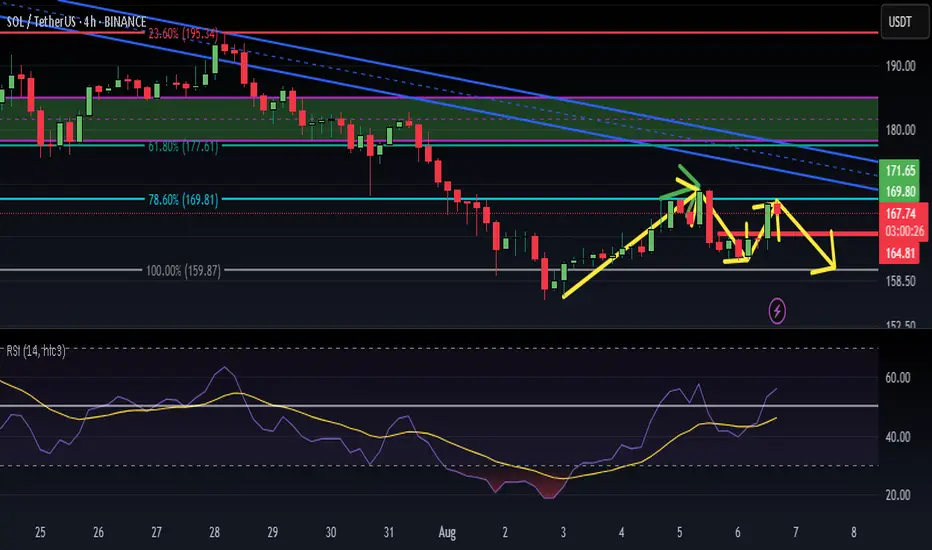
SOL - 4H Elliott Wave Analysis - 08.08.25Welcome to our Elliott Wave Count for Solana.
It seems that we bottomed on the 2nd of August and started an impulse to the upside displayed as white 5 wave move of which we finished Wave 1 and 2 and are working on Wave 3.
The white Wave 3 did hit the 1 to 1 FIB target which we removed now but we would prefer if the white Wave 3 goes higher. Next targets are the 1.236 FIB at 180.78 USD, the 1.382 FIB at 183.10 USD and the 1.618 FIB at 186.86 USD.
We already added a provisional white Wave 4 support which sits between the 0.236 FIB at 173.92 USD and the 0.5 FIB at 169.50 USD. We also added the 0.618 FIB at 167.52 USD which would be the invalidation point for an impulsive 5 wave move up and shift probabilities to another count.
Be aware the white Wave 4 support area move higher as the price climbs higher.
Thanks for reading.
NO FINANCIAL ADVICE.
bullish signalif the next candle in next wee be a big green candle its become a morning star candle we know the trend is start bullish and we ready for 230 or 240 target

$SOL channel breakout could lead to a rally toward $260Solana has broken out of its recent downtrend on both the daily and 4-hour charts, showing clear signs of bullish strength. The price is pushing beyond its channel, and momentum suggests that the $200 liquidity zone is within reach.
If CRYPTOCAP:SOL can close above the $206 resistance, it could open the door for a rally toward $230–$260, revisiting the prime all-time high area. EMA structure is also supportive — the 21 EMA has crossed above the 50 EMA, while the 100 EMA has crossed over the 200 EMA, both reinforcing the bullish outlook.
With technical aligning and momentum building, Solana’s next move could be one of the most significant runs we’ve seen this year.
SolFun and memetokens on Solana: from chaos to structure
Solana — an ecosystem with a long-term vector
Solana occupies a stable position among the leaders in blockchain infrastructure. High speed, scalability, and minimal fees make it an ideal platform for both serious DeFi products and speculative activity. In recent months, interest in Solana has only grown, which has directly affected the number of new projects within the network.
One of the most notable trends has been memecoins. They are filling the blockchain at a tremendous rate, with dozens and hundreds of new assets appearing every day. This dynamic is largely explained by the ease of launching tokens through the Pump.fun platform.
The more popular Solana becomes, the more tokens will appear within it. This is a direct correlation: a strong foundation generates high activity at the second level of the ecosystem.
Memes as a reflection of the market
Meme tokens are not just chaos and humour. They are a separate form of local trading, with high volatility and instant reactions. This segment has become particularly active on Solana :
The absence of commissions makes trading convenient;
The speed of the blockchain allows for instant reactions;
The ease of launching tokens is a factor in mass adoption;
The community itself fuels trends.
But along with this came complications: scams, dumps, and mass bot participation. And here, the need for filtering comes to the fore.
The problem of selection and how traders deal with it
In a rapidly changing market, it is impossible to analyse every token manually. Therefore, most traders have long since developed a basic set of tools. These include things like auto-filters in Telegram, dashboards, and, of course, extensions directly within Pump.fun.
One of the most widely used is SolFun . It is built into the interface and displays key token metrics: reliability index, decentralisation, activity, holder concentration, presence of suspicious addresses, etc.
For most active participants in the Solana market, SolFun is not a ‘tool’ but part of the working environment. It has long been used by those who make dozens of trades per session.
What the trading logic looks like
In a hyperactive market, it is not the speed of entry that is important, but filtering. Successful traders do not try to catch every wave. Instead, they build a funnel: 80% of tokens are cut off at the analysis stage.
The scenario is simple:
Low reliability index — pass;
One of the holders owns too large a share — risk of dumping;
Suspicious activity from bot-like accounts on Twitter — pass;
If there are no red flags, the distribution is even, and the activity is lively, you can continue with the analysis.
These signals are immediately visible — many of them are displayed in SolFun . But perception comes not through the interface, but through habit — the eye catches familiar parameters. And if the picture does not match expectations, the trader does not enter.
Why technical analysis is not needed here
Memecoins on Solana are a market where technical analysis loses its meaning. There are no histories, patterns, or liquidity. Everything happens in minutes, and by the time any pattern appears, the movement is already complete.
Therefore, the approach here is fundamental — in its adapted form. This is not a study of the white paper, but a quick check:
How many unique holders are there?
Who are they?
How are the tokens distributed?
Is there activity from live users?
Are there any red flags — such as pBOT or sudden injections?
Such metrics are the basis of the logic that traders operate on. And tools like SolFun simply make this process faster.
Where is everything heading?
Solana is showing steady growth. This means that the ecosystem will continue to expand. And that means the meme market will only gain momentum. This is not just speculation — it is a reflection of demand and attention.
In such conditions, it is not the first to enter who survives, but those who know how to filter out the noise. SolFun , like other automated assistants, has simply established itself as part of this ecosystem. Not as a solution, but as infrastructure.
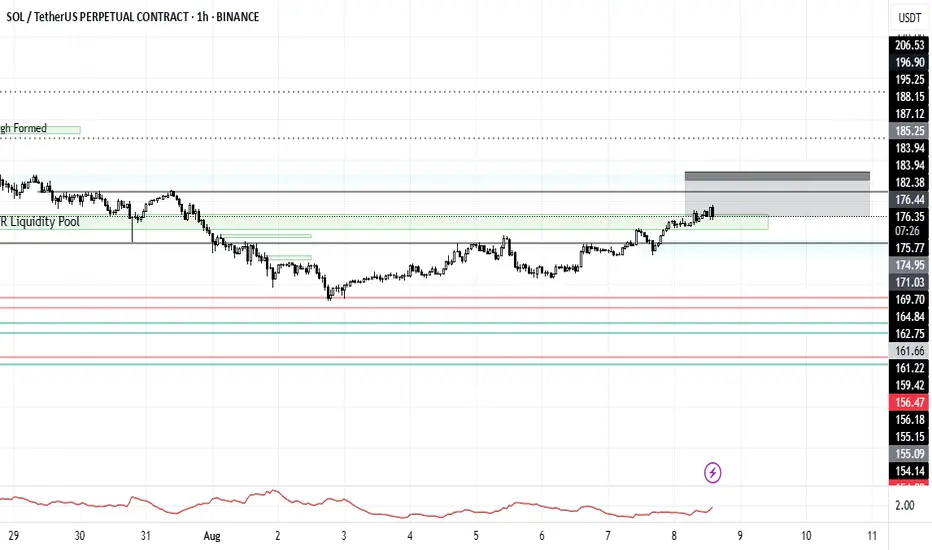
Solana Eyes Short-Term Bounce as Technical Setup StrengthenBINANCE:SOLUSDT 's price has come under pressure in recent days, falling nearly 10% from its local high. But despite the pullback, a rare technical pattern and steady institutional demand suggest the trend could be gearing up for a reversal.
On the daily chart, BINANCE:SOLUSDT is on the verge of a golden crossover, a bullish signal that occurs when the 100-day EMA crosses above the 200-day EMA. Historically, this setup has preceded short-term rallies. BINANCE:SOLUSDT is currently holding just above the $160 support level, and a move above $176 could confirm bullish momentum.
If price extends past $188, the next psychological target sits at $200. However, if BINANCE:SOLUSDT breaks below $155, downside pressure may build. A full invalidation occurs if the EMAs flip bearish, where the 200-day EMA overtakes the 100-day, forming a potential death crossover.
SOL’s balance on centralized exchanges has dropped nearly 10% since July 23, falling from 33.06 million to 30.78 million tokens. This reduction in available supply has coincided with a repeat of a historical crossover pattern, where price moves above the exchange balance trendline.
In past instances, such as on July 16 and July 24, this crossover preceded multi-day rallies. The latest crossover happened near $169. Although the price has pulled back, the trend remains valid as long as supply stays low and price holds above the $160 zone.
While SOL’s spot price corrected over the past week, CME futures open interest held steady. This divergence often suggests that larger players are maintaining their long exposure, waiting for weaker hands to exit.
A similar divergence in late July saw price rebound from $184 to $188 once open interest stabilized. As long as CME activity remains steady or rises, institutional sentiment will likely continue to act as a support buffer beneath current BINANCE:SOLUSDT price levels.

double Top patterntrend still bearish we have another Lower lower and i see Double Top pattern in 4 hour Time Frame i could say maybe we reach 160
SOL LONG Price respecting golden area demand zone . If bulls manage to defend this area next target is 240 resistance zone.
MACD also looking bullish on 1hr and 4hr chart.

SOLUSDT Potential targetsIf SOL aims for higher targets, these could be achievable by late August or early September.
Let's wait and see what unfolds next.
We're keeping our hopes high for these targets and aiming to secure a strong position in the market.
SOLANA NEXT Target 180-185Solana has recently retraced from the 0.318 Fibonacci level of its latest swing and is now positioned to potentially test the resistance zone between $180 and $185.
SOL | Solana Game Plan - Swing Long IdeaSOL | Solana Game Plan - Swing Long Idea
📊 Market Sentiment
Market sentiment remains bullish, supported by expectations of a 0.25% rate cut at the upcoming FOMC meeting. The weakening USD and rising risk appetite across global markets continue to favor crypto assets.
We’re currently seeing a minor retracement, primarily driven by the Nasdaq’s pullback — but the overall outlook for the crypto market remains bullish in the weeks ahead.
📈 Technical Analysis
Price was rejected from the HTF bearish trendline near $207 and is now retracing.
The retracement aligns with a HTF bullish trendline, which I believe could spark a strong move to the upside.
This area also aligns with the 0.5 Fibonacci retracement level (discount zone) and a HTF demand zone — forming a strong confluence for a potential bounce.
📌 Game Plan
I want to see price hit the HTF demand zone at $152 (purple box).
It should also tap the bullish trendline.
The zone aligns with the 0.5 Fibonacci level — my key discount area.
🎯 Setup Trigger
After these levels are tagged, I’ll be looking for a 4H bullish break of structure, which should also form a new 4H demand zone for confirmation.
📋 Trade Management
Stoploss: Below swing low of the 4H demand zone
Targets:
• TP1: $188
• TP2: $207
• TP3: $297
I’ll trail my stop to lock in profits aggressively as price moves in my favor.
💬 Like, follow, and comment if this breakdown supports your trading!
More setups and market insights coming soon — stay connected!

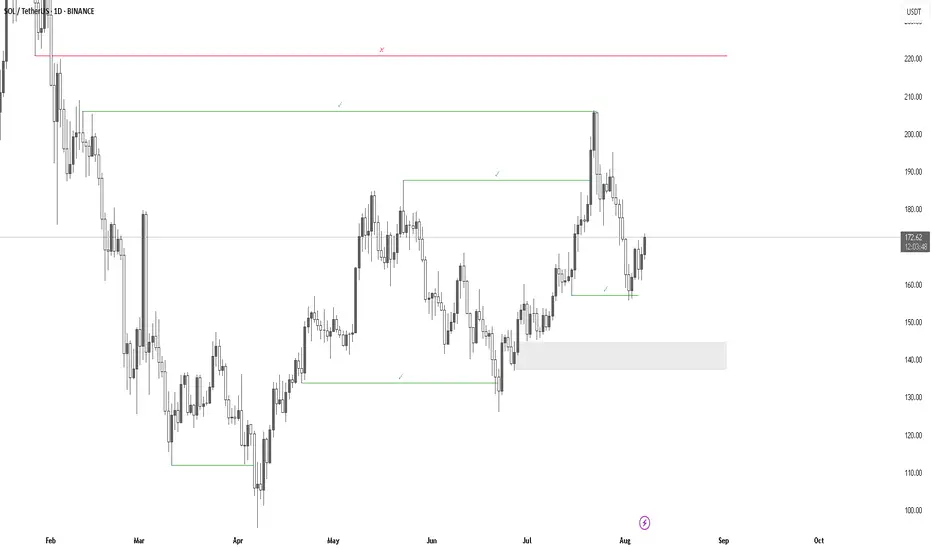
Weekly trading plan for SolanaPrice is currently testing the weekly pivot point, but significant resistance remains overhead. We could see a fake breakout of the descending channel before a true downside move materializes.
Key Levels & Scenarios:
Primary Target: $136-146 range
Bullish Invalidation: A confirmed break & hold above $182 would shift bias, opening path to $200
Until we clear $182 decisively, the structure remains bearish. Trade the ranges carefully.

SOLUSDT📊 #SOLUSDT
⏱ TIME: 1D
⭕️risk: mid
📍The initial buying market: 168-169
📌TP1: 192$
📌TP2: 224$
⛔️SL: 144$
❌These analyzes are just to give a better perspective for you dear ones
Do not base on buying and selling❌

Solana Technical AnalysisBINANCE:SOLUSDT
Solana ( CRYPTOCAP:SOL ) Technical Analysis:
Last week, #Solana closed below its daily resistance level of $184.13 on Monday and subsequently declined by 13.44% over the next five days. The decline found support around the 200-day Exponential Moving Average (EMA) at $162.75 on Sunday. Notably, this EMA level aligns closely with the 61.8% Fibonacci retracement at $163.40, establishing a key support zone.
At the start of this week, SOL rebounded by 4.68% on Monday, and as of Tuesday, it is trading near $168.67.
If the 200-day EMA at $162.75 continues to hold as a support level, there is potential for SOL to extend its rally toward the daily resistance at $184.13.
