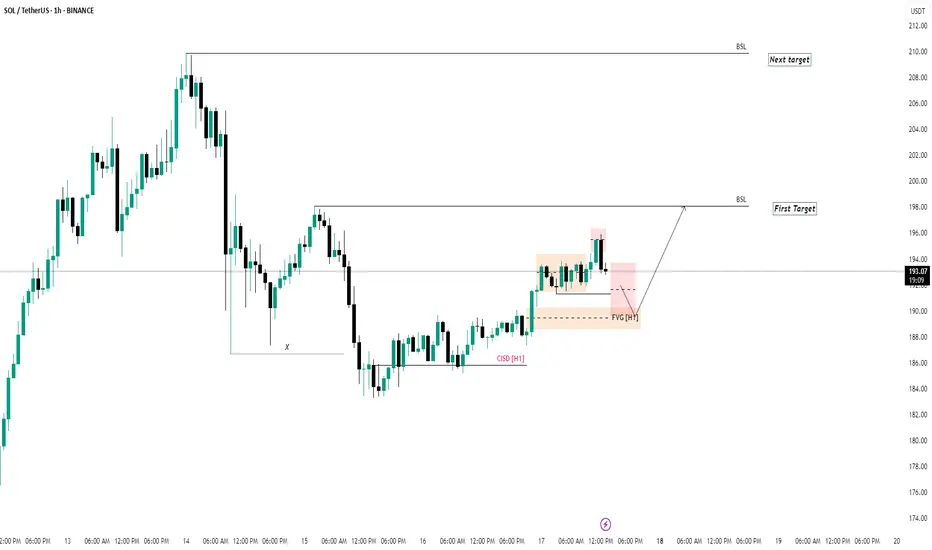
SOL — High Confluence Buy ZoneFrom 12th–14th August, SOL spiked into the 0.618/0.786 pitchfork resistance zone, where the best short entry presented itself. This rejection also marked the completion of wave 5 of the 5th Elliott Wave, confirming exhaustion in the $205–$210 zone.
After this sharp move, an imbalance has formed tha
Related pairs

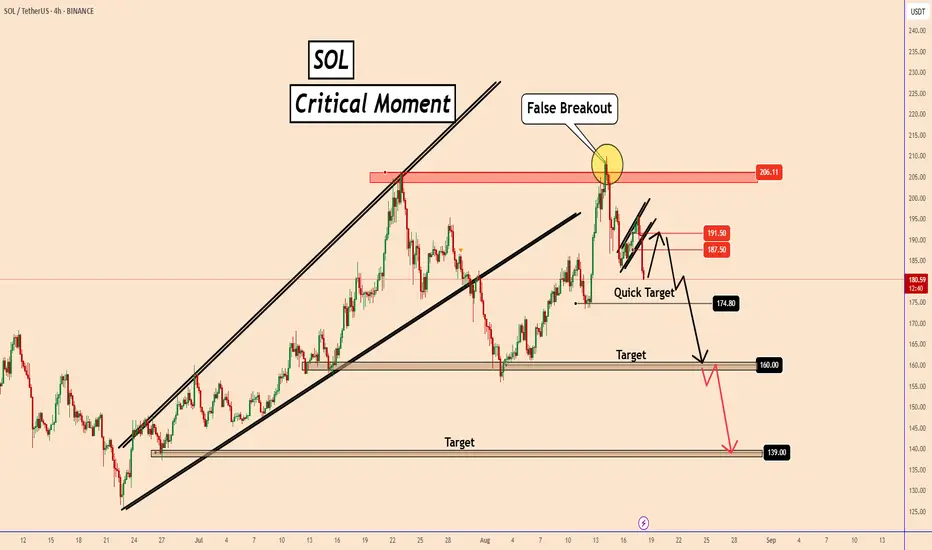
Solana’s False Breakout: Is the Rally Over?Solana’s False Breakout: Is the Rally Over?
On August 14, Solana tried to break above its previous high, but the move turned out to be a false breakout. The price quickly dropped to 180.80 within just three days.
It seems the bullish momentum is fading for now.
I believe the most Solana might do
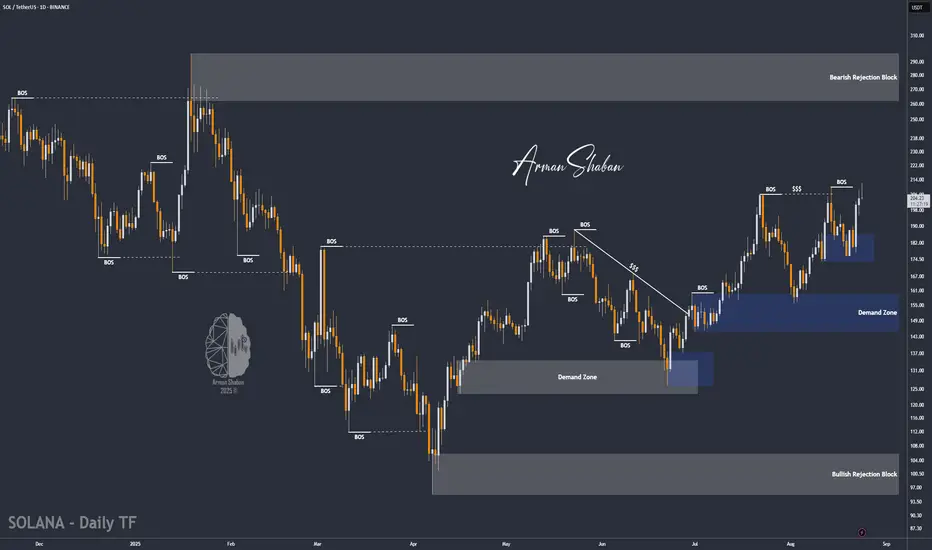
SOL/USDT | Solana Surges 43% – Is a 25% Bullish MoveStill Ahead?By analyzing the Solana (SOL) chart on the daily timeframe, we can see that the price held strongly above $171 as expected in our previous analysis and has already hit two major targets at $195 and $206, even spiking up to $212 — securing an impressive 43% rally so far! 🚀
After reaching this critic
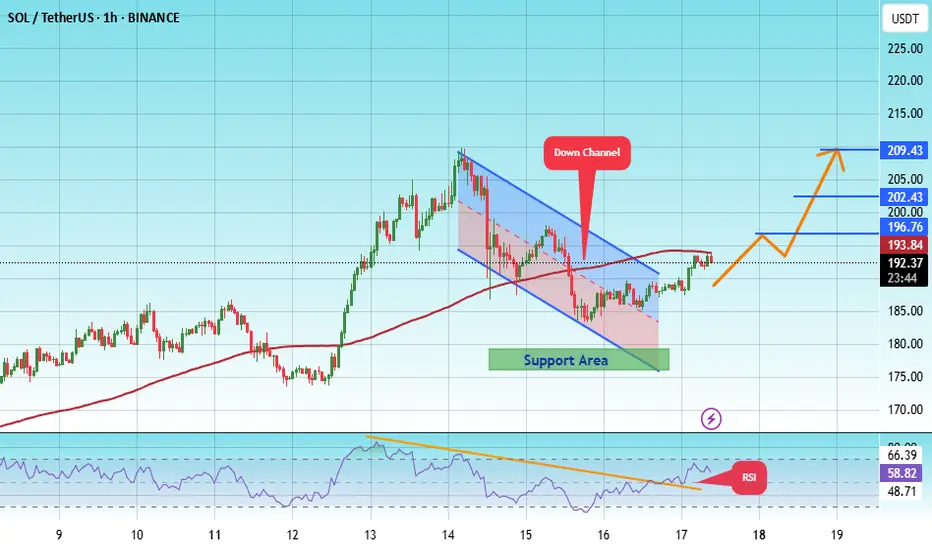
Lingrid | SOLUSDT Pullback Trading Opportunity To BuyThe price perfectly fulfilled my previous idea . BINANCE:SOLUSDT is rebounding from the support level and consolidating near the upward channel, showing strong bullish potential. Price structure highlights an upward channel with higher highs and higher lows while testing both a triangle pattern a

SOl BullishSolana (SOL) is showing strong bullish momentum against USDT, with price action forming higher highs and higher lows. Increased trading volume and positive sentiment around Solana's ecosystem upgrades and DeFi growth are supporting the uptrend. Key resistance levels are being tested, and a breakout
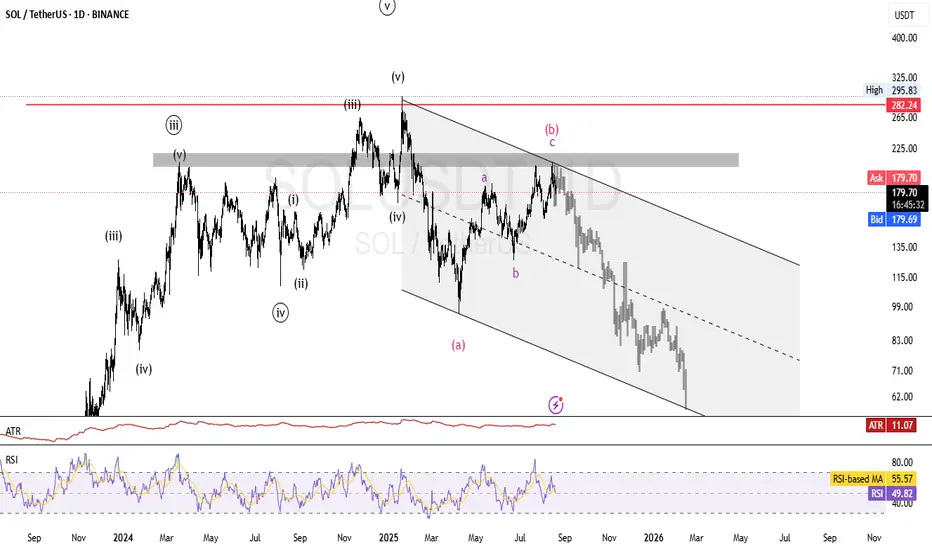
SOLUSDT: Elliot waves Analysis Hello. As you can see in the Solana chart, the analysis is based on Elliott waves in the long term. This is only a perspective and cannot be the basis for trading, but it seems that after reaching the deadline area, we can expect a continuation of the correction for wave C. So keep this perspective
#solana scalp long to $210timesensitive. Still can get 1r from it at least.
sl: 203.29
tp: 210
Roughly 2 RR from my entry area.

Solana full targets and realisticDear Traders,
here the realistic targets where solana can go lets see how this play out

#SOL/USDT Is This the Perfect Time for a Solana Bullish Heist?#SOL
The price is moving within an ascending channel on the 1-hour frame, adhering well to it, and is on track to break it strongly upwards and retest it.
We have support from the lower boundary of the ascending channel, at 180.
We have a downtrend on the RSI indicator that is about to break and
SOL/USDT, dailyFibonacci zones
Current price is around 183.7, right above the 61.8% retracement (≈191.2) zone.
If SOL breaks and holds above 230–260, it strongly confirms a bullish wave (3) extension toward 368–490.
Bullish vs Bearish Scenarios
✅ Bullish case:
If SOL sustains above 190–200, this wedge breaks

See all ideas
Summarizing what the indicators are suggesting.
Oscillators
Neutral
SellBuy
Strong sellStrong buy
Strong sellSellNeutralBuyStrong buy
Oscillators
Neutral
SellBuy
Strong sellStrong buy
Strong sellSellNeutralBuyStrong buy
Summary
Neutral
SellBuy
Strong sellStrong buy
Strong sellSellNeutralBuyStrong buy
Summary
Neutral
SellBuy
Strong sellStrong buy
Strong sellSellNeutralBuyStrong buy
Summary
Neutral
SellBuy
Strong sellStrong buy
Strong sellSellNeutralBuyStrong buy
Moving Averages
Neutral
SellBuy
Strong sellStrong buy
Strong sellSellNeutralBuyStrong buy
Moving Averages
Neutral
SellBuy
Strong sellStrong buy
Strong sellSellNeutralBuyStrong buy
Displays a symbol's price movements over previous years to identify recurring trends.
Frequently Asked Questions
The current price of SOLANA/TETHER USDT (SOL) is 203.72 USDT — it has risen 0.48% in the past 24 hours. Try placing this info into the context by checking out what coins are also gaining and losing at the moment and seeing SOL price chart.
SOLANA/TETHER USDT price has risen by 7.82% over the last week, its month performance shows a 7.87% increase, and as for the last year, SOLANA/TETHER USDT has increased by 27.76%. See more dynamics on SOL price chart.
Keep track of coins' changes with our Crypto Coins Heatmap.
Keep track of coins' changes with our Crypto Coins Heatmap.
SOLANA/TETHER USDT (SOL) reached its highest price on Jan 19, 2025 — it amounted to 295.02 USDT. Find more insights on the SOL price chart.
See the list of crypto gainers and choose what best fits your strategy.
See the list of crypto gainers and choose what best fits your strategy.
SOLANA/TETHER USDT (SOL) reached the lowest price of 8.07 USDT on Dec 30, 2022. View more SOLANA/TETHER USDT dynamics on the price chart.
See the list of crypto losers to find unexpected opportunities.
See the list of crypto losers to find unexpected opportunities.
The safest choice when buying SOL is to go to a well-known crypto exchange. Some of the popular names are Binance, Coinbase, Kraken. But you'll have to find a reliable broker and create an account first. You can trade SOL right from TradingView charts — just choose a broker and connect to your account.
Crypto markets are famous for their volatility, so one should study all the available stats before adding crypto assets to their portfolio. Very often it's technical analysis that comes in handy. We prepared technical ratings for SOLANA/TETHER USDT (SOL): today its technical analysis shows the buy signal, and according to the 1 week rating SOL shows the buy signal. And you'd better dig deeper and study 1 month rating too — it's strong buy. Find inspiration in SOLANA/TETHER USDT trading ideas and keep track of what's moving crypto markets with our crypto news feed.
SOLANA/TETHER USDT (SOL) is just as reliable as any other crypto asset — this corner of the world market is highly volatile. Today, for instance, SOLANA/TETHER USDT is estimated as 5.10% volatile. The only thing it means is that you must prepare and examine all available information before making a decision. And if you're not sure about SOLANA/TETHER USDT, you can find more inspiration in our curated watchlists.
You can discuss SOLANA/TETHER USDT (SOL) with other users in our public chats, Minds or in the comments to Ideas.