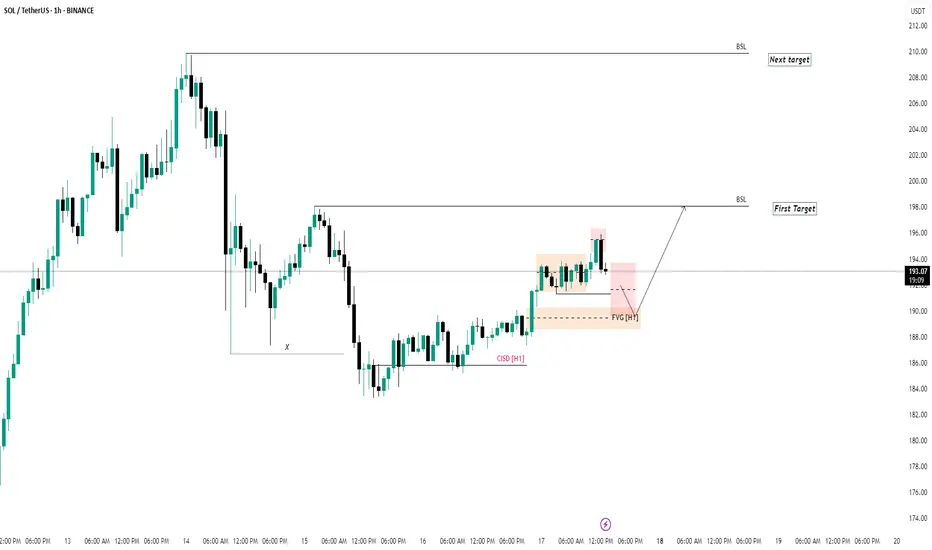
SOL/USDT | Solana Surges 43% – Is a 25% Bullish MoveStill Ahead?By analyzing the Solana (SOL) chart on the daily timeframe, we can see that the price held strongly above $171 as expected in our previous analysis and has already hit two major targets at $195 and $206, even spiking up to $212 — securing an impressive 43% rally so far! 🚀
After reaching this critical resistance zone, we’ve seen a wave of selling pressure, and SOL is currently consolidating around $204. As long as the price remains above $193 and doesn’t break below it, the bullish momentum is likely to continue, with renewed demand driving the next leg up.
The upcoming bullish targets are positioned at $220, $245, and $260, offering a potential short-term upside of over 25%.
Please support me with your likes and comments to motivate me to share more analysis with you and share your opinion about the possible trend of this chart with me !
Best Regards , Arman Shaban
SOLUSDT trade ideas
SOL — High Confluence Buy ZoneFrom 12th–14th August, SOL spiked into the 0.618/0.786 pitchfork resistance zone, where the best short entry presented itself. This rejection also marked the completion of wave 5 of the 5th Elliott Wave, confirming exhaustion in the $205–$210 zone.
After this sharp move, an imbalance has formed that typically gets retraced. When price spikes that quickly into resistance, it often gives the entire move back → meaning a return to the origin of the move. As price approaches this region, it becomes the prime zone for long re-entries.
🧩 Confluence Factors: 9
0.618 Retracement of the 5-wave impulse: $176.47
Daily level: $174.84
nPOC: $175.00
0.786 Trend-Based Fib Extension: $175.00
Anchored VWAP: ~$173.30
Sell-Side Liquidity (SSL): ~$173.50
Pitchfork 0.618 support: Aligning with this zone
Monthly Open (mOpen): $172.22 (major support)
0.786 Fib Speed Fan: Adding further structural support
🟢 Long Trade Setup
Entry Zone: $176.5 – $172
Best Entry: Around $175 (ideal ~ $173, confluence with liquidity + mOpen)
Stop-Loss: Below $167
Target: $219.21 (0.618 retracement of full move)
Potential Gain: +25%
R:R: 1:5+
Technical Insight
The 0.786 pitchfork rejection into wave 5 completion marked exhaustion at $205–$210.
Fast moves into resistance often retrace back to origin, opening the door for imbalances to be filled.
The $176.5–$172 zone clusters multiple technical supports, making it a high-probability long entry.
The mOpen at $172.22 and surrounding liquidity pocket stand out as the most ideal entry point.
With targets up to $219, the setup offers a strong +25% potential move with excellent risk-to-reward.
Key Levels to Watch
Support Zone: $176.5 – $172 (ideal entry ~$173)
Final Target: $219.21
🔍 Indicators used
DriftLine — Pivot Open Zones → For identifying key yearly/monthly/weekly/daily opens that act as major S/R reference points
➡️ Available for free. You can find it on my profile under “Scripts” and apply it directly to your charts for extra confluence when planning your trades.
_________________________________
💬 If you found this helpful, drop a like and comment!

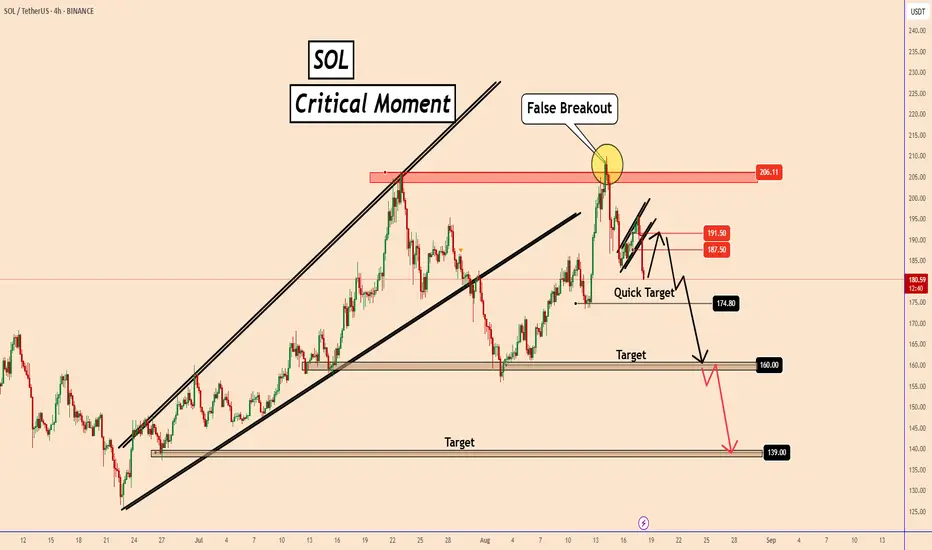
Solana’s False Breakout: Is the Rally Over?Solana’s False Breakout: Is the Rally Over?
On August 14, Solana tried to break above its previous high, but the move turned out to be a false breakout. The price quickly dropped to 180.80 within just three days.
It seems the bullish momentum is fading for now.
I believe the most Solana might do is retest the 187.50–191.50 zone before heading lower.
Based on the chart, the next support levels are around 174.80 and 160.
There's a chance it could fall even further, but that third target is more of a long-term scenario and will need to be reassessed in the coming days.
You may find more details in the chart!
Thank you and Good Luck!
PS: Please support with a like or comment if you find this analysis useful for your trading day
Lingrid | SOLUSDT Pullback Trading Opportunity To BuyThe price perfectly fulfilled my previous idea . BINANCE:SOLUSDT is rebounding from the support level and consolidating near the upward channel, showing strong bullish potential. Price structure highlights an upward channel with higher highs and higher lows while testing both a triangle pattern and downward trendline resistance. If the price holds above the $175.00 support zone and breaks the downward trendline, a push toward $206 is expected. The broader context shows bullish momentum, with the structure favoring continuation toward the $220 resistance area if momentum sustains.
📉 Key Levels:
Buy trigger: Break above the downward trendline near $190
Buy zone: $175.00 support retest and upward channel base
Target: $206 and potentially $220 resistance zone
Invalidation: A breakdown below $170.00 support
💡 Risks:
Failure to hold above $175.00 support could extend downside pressure.
Broader macro risks (USD strength, Fed policy shifts) may weigh on crypto sentiment.
Potential false breakout of the downward trendline could trap late buyers.
If this idea resonates with you or you have your own opinion, traders, hit the comments. I’m excited to read your thoughts!

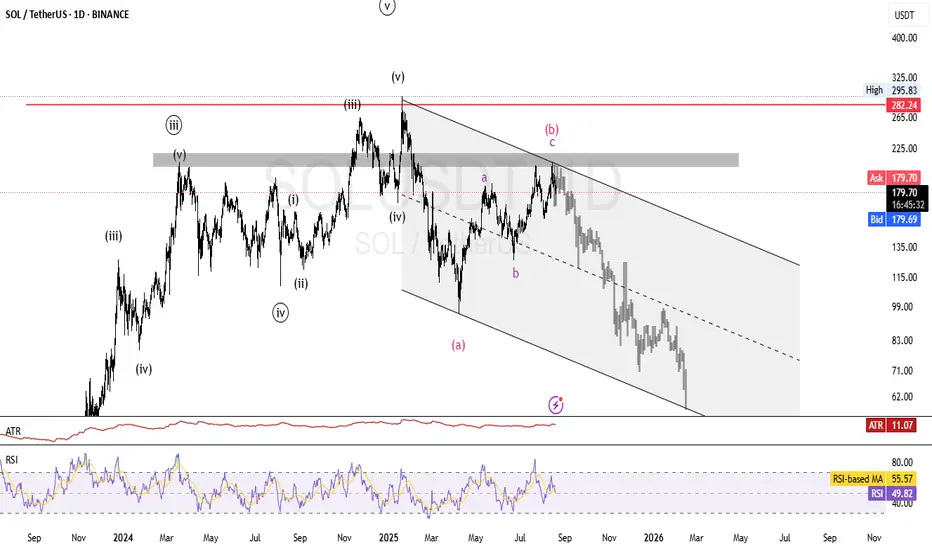
SOLUSDT: Elliot waves Analysis Hello. As you can see in the Solana chart, the analysis is based on Elliott waves in the long term. This is only a perspective and cannot be the basis for trading, but it seems that after reaching the deadline area, we can expect a continuation of the correction for wave C. So keep this perspective in mind, as it is possible.
#solana scalp long to $210timesensitive. Still can get 1r from it at least.
sl: 203.29
tp: 210
Roughly 2 RR from my entry area.

Solana full targets and realisticDear Traders,
here the realistic targets where solana can go lets see how this play out

SOL/USDT, dailyFibonacci zones
Current price is around 183.7, right above the 61.8% retracement (≈191.2) zone.
If SOL breaks and holds above 230–260, it strongly confirms a bullish wave (3) extension toward 368–490.
Bullish vs Bearish Scenarios
✅ Bullish case:
If SOL sustains above 190–200, this wedge breaks upward.
Next major targets = 230 → 260 → 368+.
❌ Bearish case:
If price fails to hold 190–183 support and breaks below 170, then wedge resolves bearish.
Downside retracements = 133 → 123 → 110

SOL/USDTFibonacci zones
Current price is around 180, right above the 61.8% retracement (≈191.2) zone.
If SOL breaks and holds above 230–260, it strongly confirms a bullish wave (3) extension toward 368–490.
Bullish vs Bearish Scenarios
✅ Bullish case:
If SOL sustains above 190–200, this wedge breaks upward.
Next major targets = 230 → 260 → 368+.
❌ Bearish case:
If price fails to hold 190–183 support and breaks below 170, then wedge resolves bearish.
Downside retracements = 133 → 123 → 110

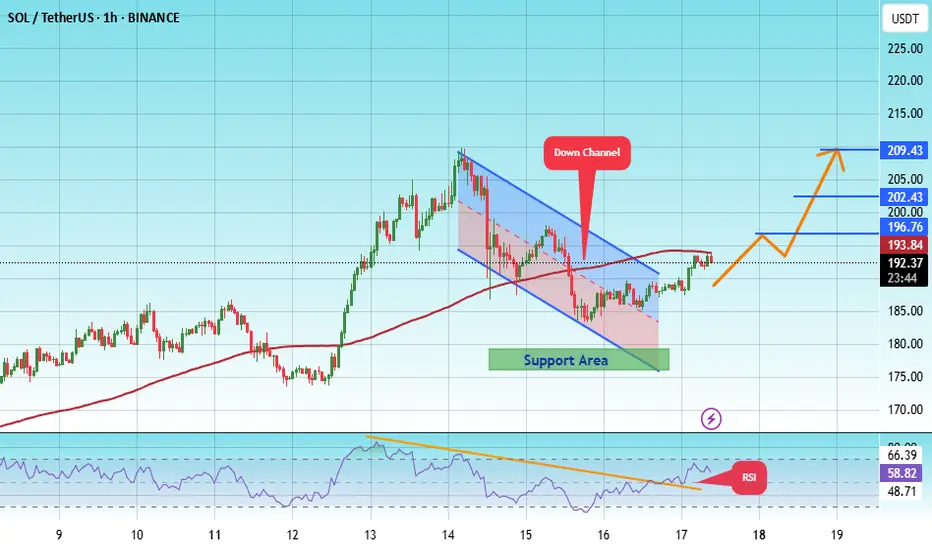
#SOL/USDT Is This the Perfect Time for a Solana Bullish Heist?#SOL
The price is moving within an ascending channel on the 1-hour frame, adhering well to it, and is on track to break it strongly upwards and retest it.
We have support from the lower boundary of the ascending channel, at 180.
We have a downtrend on the RSI indicator that is about to break and retest, supporting the upside.
There is a major support area in green at 178, which represents a strong basis for the upside.
Don't forget a simple thing: ease and capital.
When you reach the first target, save some money and then change your stop-loss order to an entry order.
For inquiries, please leave a comment.
We have a trend to hold above the moving average of 100.
Entry price: 192.
First target: 196.
Second target: 202.
Third target: 209.
Don't forget a simple thing: ease and capital.
When you reach the first target, save some money and then change your stop-loss order to an entry order.
For inquiries, please leave a comment.
Thank you.
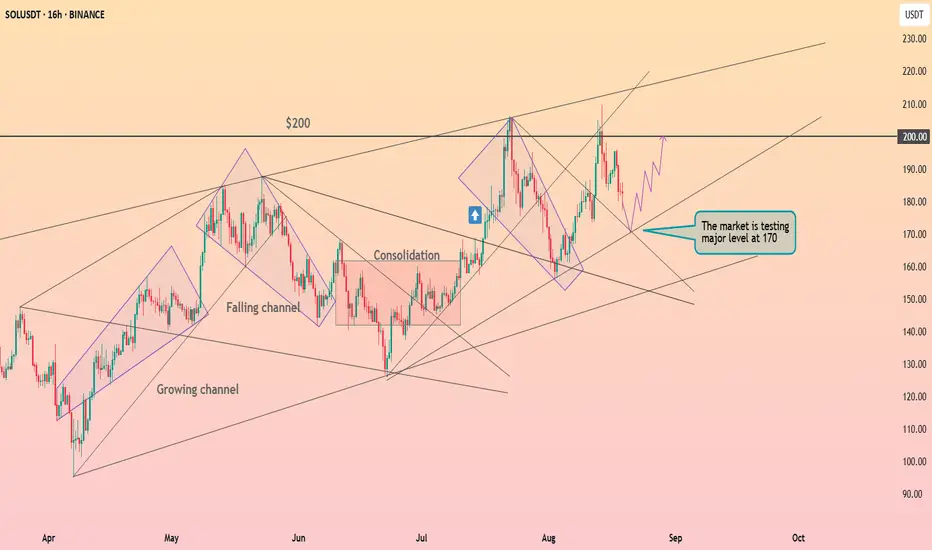
Solana above the strong support ┆ HolderStatBINANCE:SOLUSDT is currently testing $170, just beneath major resistance at $200. Breakout confirmation could open path to new highs, while rejection risks pullback to $150 support. Consolidations suggest momentum is building for another significant move.
Solana Reclaims $162 Support as Bulls Eye $252Solana has reclaimed the $162 support level with multiple weekly candle closes above it, signaling market acceptance. The next target lies at $252, with the broader structure remaining firmly bullish.
Solana has shown renewed strength in recent weeks after reclaiming the $162 level, a major high-time frame support zone. Price has now confirmed multiple weekly closes above this level, a strong sign of market acceptance and structural integrity. This reclaim not only validates $162 as a pivotal area but also sets the stage for further continuation in the broader bullish cycle.
The weekly chart for Solana highlights consistent higher highs and higher lows, a textbook signal of bullish momentum. Each pullback has been met with demand, and as long as $162 holds on future retests, the broader structure remains intact. Even if the market consolidates or dips into this region again, the level is expected to act as a strong base for the next wave higher.
Key Technical Points:
- $162 Support: Reclaimed with multiple weekly closes, confirming structural strength.
- Value Area High Resistance: Currently capping price; a breakout opens the door to higher levels.
- Upside Target at $252: Major resistance zone and the next key projection for bulls.
From a technical perspective, Solana is already demonstrating clear signs of demand. The value area high, which is being respected with precision, stands as the next barrier for price. Once this resistance is reclaimed, the probability of a rotation toward $252 becomes high. Such a move would not only represent significant upside but also further confirm Solana’s bullish standing among major altcoins.
The importance of the $162 support lies in its history as a strong pivot point. Previously a contested zone, the successful reclaim and acceptance above it transforms this level into a launchpad for further growth. This is a common characteristic of high-time frame supports, where a prior barrier turns into a foundation once retaken.
Volume analysis also supports the bullish bias. Increased participation has accompanied Solana’s defense of $162, with accumulation showing up in recent weeks. Sustained buying interest at higher levels often signals market confidence, providing a strong backdrop for potential expansions.
What to Expect in the Coming Price Action
Solana remains structurally bullish as long as $162 continues to hold on weekly closes. Consolidation above this level may extend in the short term, but each higher low builds pressure for the next breakout. If the value area high is breached, $252 becomes the immediate target, representing the next stage of the bullish projection. For now, Solana’s reclaim of $162 marks a critical technical win that positions the asset for further upside in the weeks and months ahead.

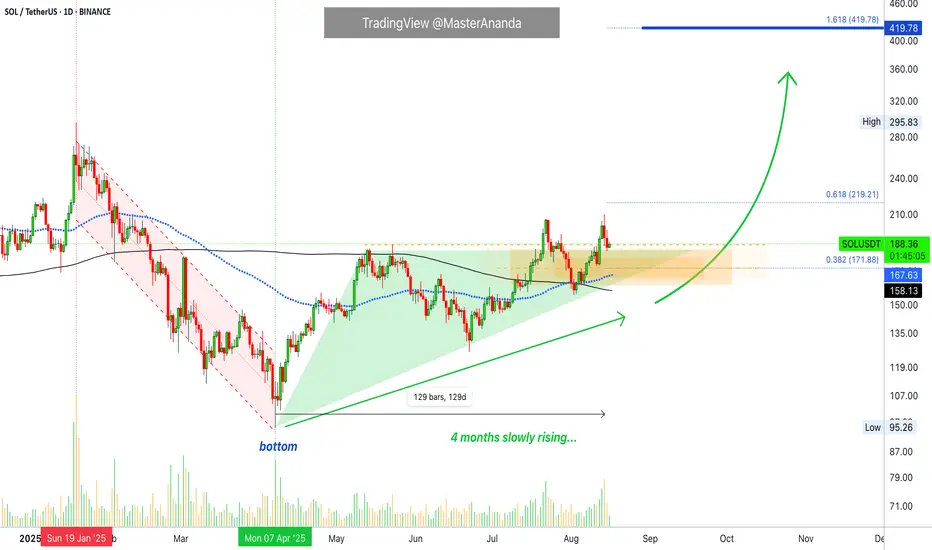
Solana Bullish · Long-Term Growth ConfirmedAfter the market bottom in April Solana has been rising slowly for four months.
Look at this chart here. I am keeping it very simple because I believe simple is best. Where is Solana at now? What happens next?
Solana is trading safely above EMA89 and MA200, notice the dynamics on the chart. These levels were first conquered as resistance back in July and by the 2nd of August these levels were being tested as support, they both held.
SOLUSDT is trading safely above these levels and also a price of $172 which is the 0.382 Fib. extension of the current wave. This is an important zone and the action is happening safely above it.
Solana has room to move around, wiggle around. This is what happens as prices grow. There can be stops and retraces but this does not mean that the rise is over, there is always more.
Solana just conquered the EMA89/MA200 duo-resistance recently, we have not yet seen what is possible now that the trading is happening on the bullish zone. We are due a major advance... The market is consolidating, building up strength to be able to grow long-term.
Namaste.
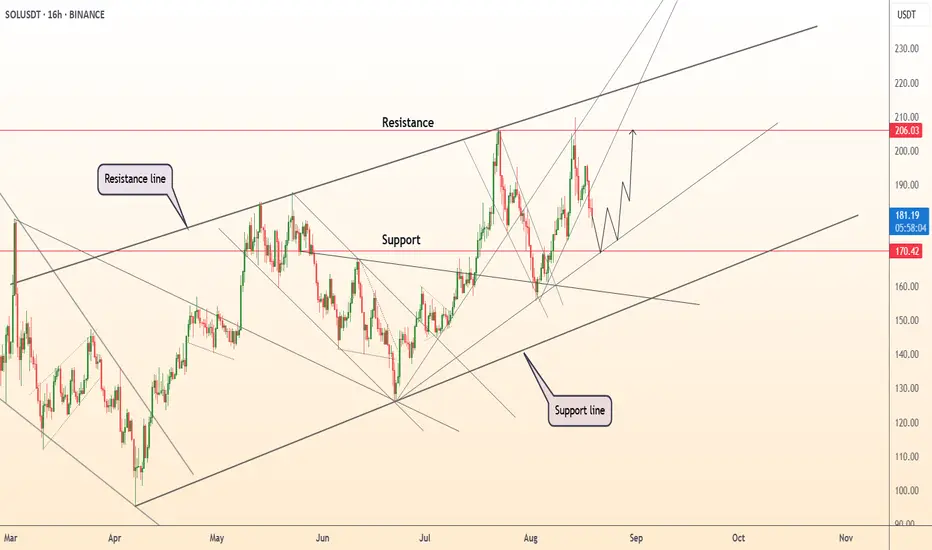
DeGRAM | SOLUSD repeated pullback from $205📊 Technical Analysis
● SOLUSD is consolidating near the rising support zone of 170–172 within a broad ascending channel, preparing for another attempt toward the 206 resistance level.
● A breakout above 206 would confirm bullish continuation, opening the path to challenge the channel top around 220–230, supported by higher lows and strong structural momentum.
💡 Fundamental Analysis
● Analysts now assign a 95% probability to spot Solana ETF approvals, boosting institutional interest, while Solana’s mainnet reached 100,000 TPS in stress tests, reinforcing scalability.
● Corporates like BIT Mining and Upexi are making direct multi-million-dollar allocations into Solana, underscoring growing confidence in its long-term adoption.
✨ Summary
Bullish above 170; breakout trigger at 206. Targets 220 → 230. Invalidation on a close below 170.
-------------------
Share your opinion in the comments and support the idea with a like. Thanks for your support!
SOL - Buy it before it's too late!As simple as the chart looks, everything on it is clear with strong targets expected in a short time.
The blue line: a close above it means BOS (Break Of Structure), signaling continuation of the upward move.
🔸Notice: this is the third attempt to break it.
In trading, resistance that the price tests multiple times weakens over time, and when it finally breaks, it usually does so with a huge green candle.
The price has also broken the daily 0.618 Fibonacci level, crossed above the 25 EMA, and made a retest of it.
Your minimum target from here is $400.
It’s a beautiful chart, strong project, and a leading coin in the market with big targets ahead… all that’s left is for you to buy it.
Best Regards:
Ceciliones🎯

SOl BullishSolana (SOL) is showing strong bullish momentum against USDT, with price action forming higher highs and higher lows. Increased trading volume and positive sentiment around Solana's ecosystem upgrades and DeFi growth are supporting the uptrend. Key resistance levels are being tested, and a breakout above recent highs could signal continuation toward higher targets. Technical indicators like RSI and MACD show upward momentum, confirming bullish strength.
sol short positionas the divergence confirmed short term i see a very good opportunity on shorting sol if also the trend line is broken thats gonna be where you will open your position and set you tp as it is shown on the chart

SOL to 128$ before new highs?lets see if have the last dip on SOL which fits with btc going under 98k$

Solana at Make-or-Break: Can $213 Unlock the Rally to $270?Solana (SOL/USDT) has been recovering strongly since bouncing from the $110 area and is now testing the critical resistance zone around $205–213. This level has acted as a major barrier multiple times in the past, making it a true “make-or-break” point.
📌 Bullish Scenario (more likely if $213 holds):
• A confirmed breakout and daily/3D close above $213 could trigger a rally toward the next major resistance at $270.
• A successful move beyond $270 may even open the path toward the long-term resistance trendline near $320–340.
📌 Bearish / Alternative Scenario:
• If Solana fails to hold above $213, a pullback toward $180–175 is possible.
• Stronger support lies around $100, which remains the key level to defend for bulls.
⚡ Conclusion:
As long as SOL stays above $200, the structure remains bullish. A breakout above $213 would confirm momentum and unlock a potential move toward $270, while rejection could mean another corrective dip before the next attempt.
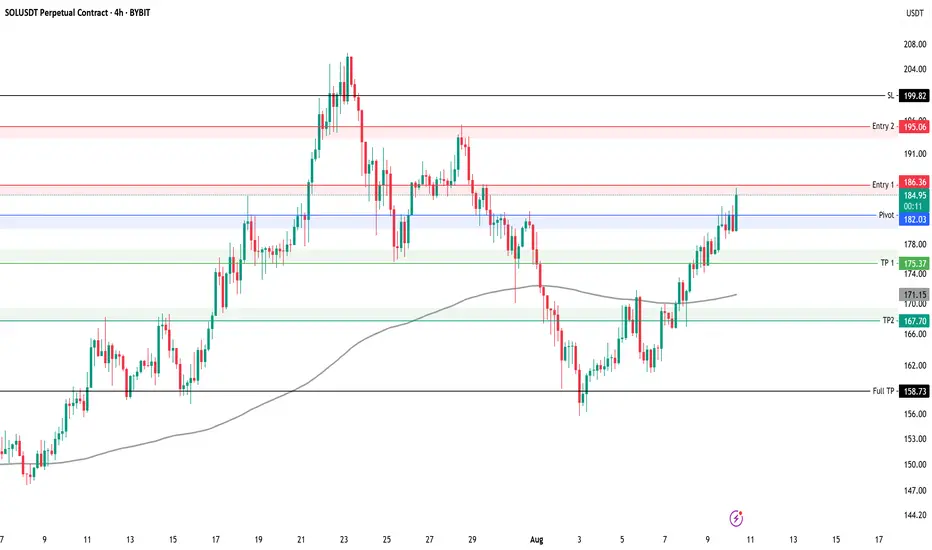
SOLUSDT Short Key levels to watch for SOLUSDT 4H
We have taken first entry on this setup using 0.5% risk
Risk per entry 0.5%
Entry 1: 186
Entry 2: 195
TP 1: 175
TP 2: 167
Full TP: 158
SL: 199
Always manage your own risk. None of the above is financial advice.
$SOL Weekly Analysis – Big Decision AheadFor Solana I’m expecting a correction into the 160–167 range. Either the fifth wave isn’t finished yet, or buyers have already spent most of their strength on the third wave and the correction phase has started, or we might still see an impulse up into the 190–199 range. On the chart, I’ve marked two possible scenarios for how the price could move.
I’ve also highlighted the key levels:
Bullish scenario : from 168, the price moves toward 220 (resistance level), and from there we could see a local correction back to 160–165.
Bearish scenario : the price is already in a correction phase and heading toward 140–145.
RSI points toward the bearish scenario, but if buyers show strength things can change.
Disclaimer: The author’s opinion may not align with yours.
BYBIT:SOLUSDT.P
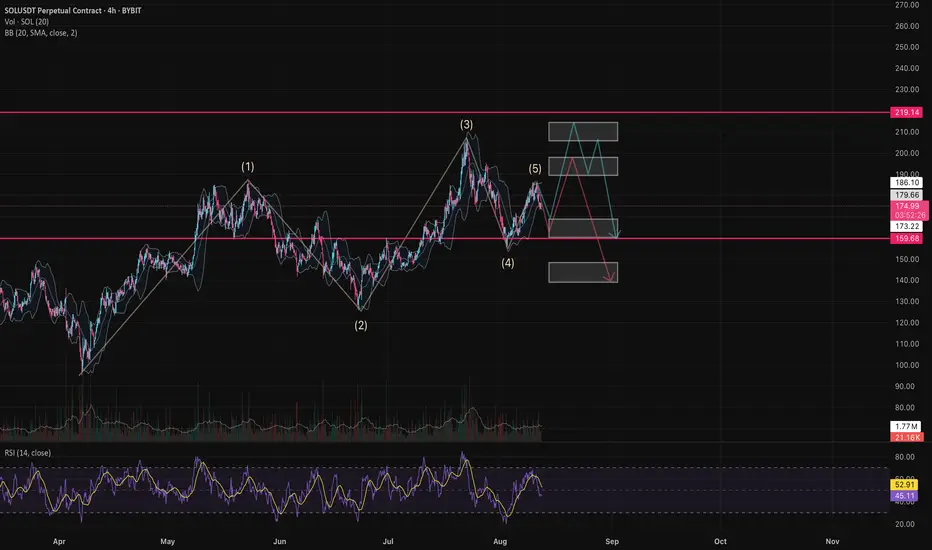
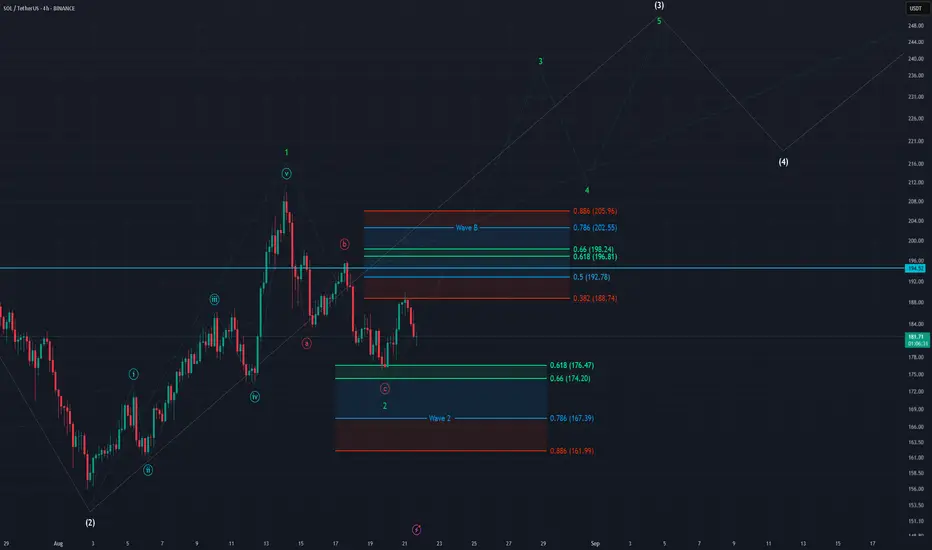
SOL - 4H Elliott Wave Analysis - 21.08.25Greetings, Solana is still holding strong and looking strong.
We assume the move up from the 3rd of August was an impulse displayed as green 5 wave move of which we finished Wave 1 and potentially Wave 2 as a red ABC.
We have two scenarios moving forward as the price action on the lower timeframes doesn't give us enough clarity to say which one is preferred. In either case we want to hold the Wave 2 support area which goes down to the 0.886 FIB At 161.99 USD.
Case 1:
Green Wave 2 is already finished in the red ABC and we are looking for an impulsive move to the upside in the 3rd Wave which should take us above 230 USD. Be aware that this 3rd Wave should happen quiet fast and aggressively.
Case 2:
The move down in the red ABC was only the Wave A of an extended correction.
The Wave B resistance area is between the 0.382 FIB at 188.74 USD and the 0.886 FIB at 205.96 USD. Be aware that we touched the 0.382 FIB which means the B wave could be in but we think the B wave isn't in yet because it would be a very shallow B which doesn't fit Solana's recent strong performance. We think a higher B wave is more likely.
As said we can't distinguish well between the two scenarios due missing price action on the lower timeframe. We hope to get more clarity soon. We also want to communicate a back up scenario in case we break the support area in which we would assume that we get a reset of the white Wave 2 in expanding flat meaning the green Wave 1 was an overshooting B Wave.
Thanks for reading.
NO FINANCIAL ADVICE.