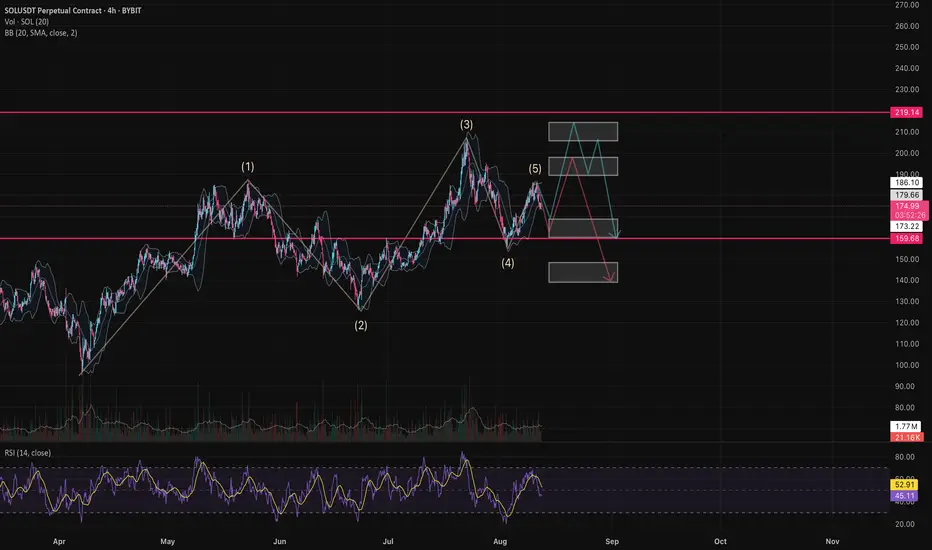
$SOL Weekly Analysis – Big Decision AheadFor Solana I’m expecting a correction into the 160–167 range. Either the fifth wave isn’t finished yet, or buyers have already spent most of their strength on the third wave and the correction phase has started, or we might still see an impulse up into the 190–199 range. On the chart, I’ve marked two possible scenarios for how the price could move.
I’ve also highlighted the key levels:
Bullish scenario : from 168, the price moves toward 220 (resistance level), and from there we could see a local correction back to 160–165.
Bearish scenario : the price is already in a correction phase and heading toward 140–145.
RSI points toward the bearish scenario, but if buyers show strength things can change.
Disclaimer: The author’s opinion may not align with yours.
BYBIT:SOLUSDT.P
SOLUSDT trade ideas
SOL Price targetOL PriceSOL Price Projection: 180 → 365 USD
Price
365 ┤ 🎯 Long-term Target 365
350 ┤
330 ┤
310 ┤
290 ┤
270 ┤ ⚡ Strong Resistance Zone
250 ┤
230 ┤
218 ┤ 🎯 Short-term Target 218
210 ┤
200 ┤
190 ┤
🔹 Key Levels & Analysis
Level (USD) Description
180 Strong support, accumulation zone
185–190 Initial resistance, possible short-term pullbacks
200–210 Psychological resistance, confirm trend continuation
218 Short-term target, take partial profits
230–270 Mid-term resistance, volume confirmation needed
290–330 Long-term bullish zone, major investors may enter
365 Long-term target, high potential reward but higher risk
🔹 Strategy Notes
1. Short-term trading: Entry at 180–185, target 218, stop-loss below 178.
2. Mid-term: Monitor 230–270, consider scaling in/out based on volume and breakout strength.
3. Long-term: Aim for 365, but manage risk with staggered positions.
4. Indicators to watch: RSI, EMA9/21, VWAP, and trading volume for

SOl BullishSolana (SOL) is showing strong bullish momentum against USDT, with price action forming higher highs and higher lows. Increased trading volume and positive sentiment around Solana's ecosystem upgrades and DeFi growth are supporting the uptrend. Key resistance levels are being tested, and a breakout above recent highs could signal continuation toward higher targets. Technical indicators like RSI and MACD show upward momentum, confirming bullish strength.
Solana's Bullish Signals Face a Critical TestAn analysis of Solana's price action shows it trading within an established upward channel. The price has reached a significant resistance confluence, defined by both the top of the channel and a strong weekly and monthly resistance level. Despite bullish signals from the MACD and RSI, a price retracement to the golden Fibonacci zone remains a possibility before a potential breakout to a new all-time high.

SOLANATRADERS SHOULD ALLOW FED SET RATE ,RATHER THAN SPECULATING IT.THE CHANCES THEY WILL APPLY TYLOR RULE IS ON THE DESK.
The Taylor Rule is a monetary policy guideline developed by economist John B. Taylor in 1992. It provides a formula to help central banks, like the Federal Reserve, determine the optimal short-term interest rate based on economic conditions.
What is the Taylor Rule?
It links the central bank's target interest rate (the federal funds rate in the U.S.) to two key economic factors:
The difference between actual inflation and the central bank's target inflation rate (usually around 2%).
The output gap—the difference between actual economic output (GDP) and the economy's potential output.
The rule suggests that the central bank should raise interest rates when inflation is above target or when the economy is producing above its potential, to cool down inflation and avoid overheating.
Conversely, it advises lowering interest rates when inflation is below target or the economy is underperforming, to stimulate growth.
Why Does It Matter to the Fed in Rate Decisions?
The Taylor Rule provides a systematic, rules-based framework for setting interest rates, enhancing policy predictability and transparency.
It serves as a benchmark for policymakers to assess whether current rates are appropriate, balancing inflation control and economic growth.
The Fed often considers the Taylor Rule when making decisions but does not follow it mechanically, as real-world factors like financial stability and global economic conditions also influence policy.
During periods of deviation from the rule’s recommendation, the Fed may explain why it chose a different path, reflecting discretion and judgment.
The Taylor Rule helps anchor market expectations by providing a reference point for where interest rates "should" be, reducing uncertainty in financial markets.
AM WAITING ON SELL FROM THE ROOF .
HUNTER WAY.
#SOLANA

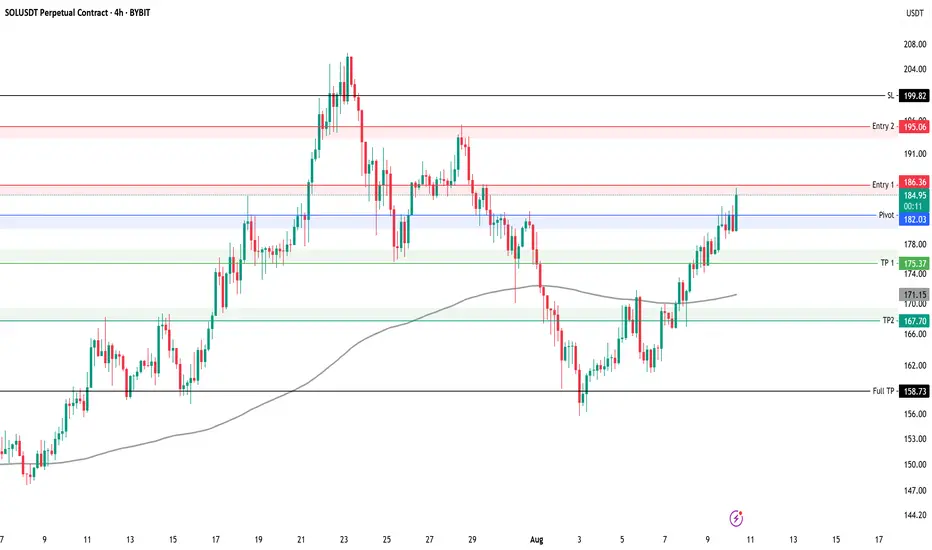
SOLUSDT Short Key levels to watch for SOLUSDT 4H
We have taken first entry on this setup using 0.5% risk
Risk per entry 0.5%
Entry 1: 186
Entry 2: 195
TP 1: 175
TP 2: 167
Full TP: 158
SL: 199
Always manage your own risk. None of the above is financial advice.
SOL 4H Golden Pocket Retest, Bounce or Breakdown?Solana is pulling back into a major confluence zone. Price sits at the 0.618 Fibonacci retracement ($176) while also testing a clean rising trendline. The Stoch RSI is oversold, giving buyers an opportunity to defend.
A bounce and reclaim of $182 would confirm bullish continuation toward $196–212.
A breakdown under $176 opens the door to a 0.786 retest near $167.
This zone is critical — holding here keeps structure intact, but failure could flip the trend short-term.

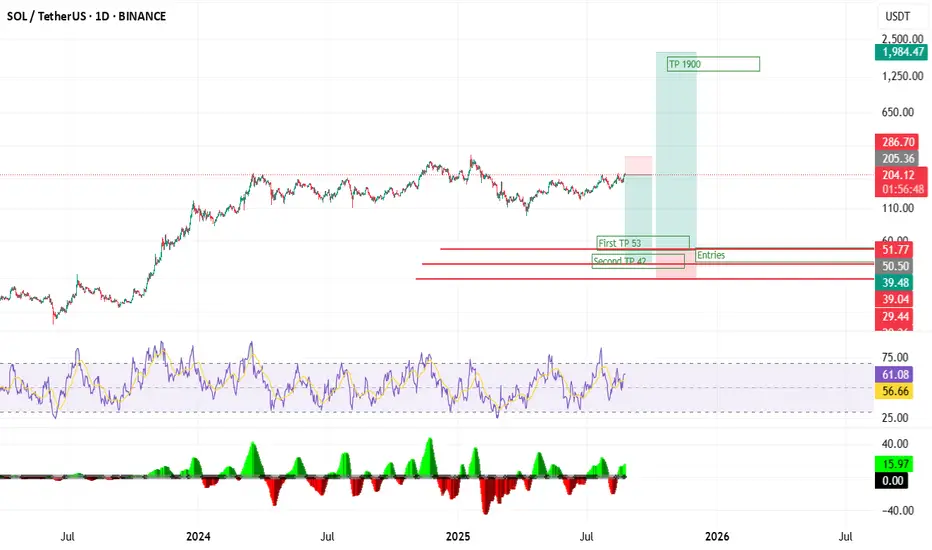
Sol/usdt, predicting deep consolidation!📉 Short Position (Bearish Setup)
🎯 Entry Zone: ~ $204.48
💰 Take Profit (TP): ~ $50
❌ Stop Loss (SL): ~ $286.7
📊 Risk/Reward Ratio: ≈ 1:2.5
📈 Long Position (Bullish Setup)
🎯 Entry Zone: ~ $30 – $50
💰 Take Profit (TP): ~ $1850+
❌ Stop Loss (SL): ~ $25
📊 Risk/Reward Ratio: ≈ 1:90
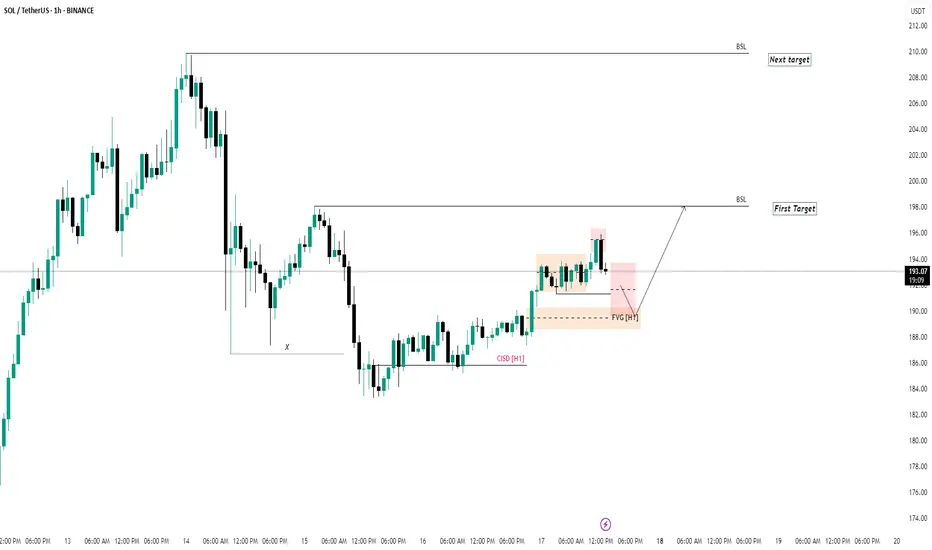
#SOL/USDT Golden Pocket Retest ?#SOL
The price is moving within an ascending channel on the 1-hour frame, adhering well to it, and is on its way to breaking strongly upwards and retesting it.
We have support from the lower boundary of the ascending channel, at 174.85.
We have a downtrend on the RSI indicator that is about to break and retest, supporting the upside.
There is a major support area in green at 173, which represents a strong basis for the upside.
Don't forget a simple thing: ease and capital.
When you reach the first target, save some money and then change your stop-loss order to an entry order.
For inquiries, please leave a comment.
We have a trend to hold above the 100 Moving Average.
Entry price: 181.
First target: 183.
Second target: 186.
Third target: 190.
Don't forget a simple thing: ease and capital.
When you reach the first target, save some money and then change your stop-loss order to an entry order.
For inquiries, please leave a comment.
Thank you.

SOL SHORTI see divergence on 30 min chart between price and MACD. Will $210 resistance finally break or will we see price move back down to fill fair value gap at $176 ?

#SOLUSDT_WSolana is likely to see targets of $322 and $618 on the weekly timeframe and in the continuation of the wave (V) movement.

Solana seeks to rebound ┆ HolderStatKUCOIN:SOLUSDT on the 6h chart broke through the $150 key level, then extended to 210 before correcting. The market is now testing 172.60 support. If buyers defend this level, upside targets at 190–200 remain valid.

SOLUSDTSOLUSDT | 4H | Bullish Bias
🔑 Key Structure Update:
Price tapped into demand zone + FVG, marking a strong POI for potential reversal. Previous bearish leg may shift if buyers defend this level.
📍 POI Level (Demand Zone + FVG):
$175 – $178 range.
Reason: Overlap of demand zone + fair value gap, acting as liquidity zone.
📊 Trade Plan:
Wait for bullish confirmation (reversal pattern or BOS on lower timeframe) before entry.
🎯 Targets:
TP1: $190
TP2: $205
TP3: $220 (extended target if momentum sustains)
❌ Invalidation (SL):
Below $170 (clear demand failure).

Long trade
30min TF
Pair: SOLUSDT (Perpetual Contract)
Direction: Buyside trade
Date: Sunday, 24th August 2025
Time: 4:00 AM (LND to NY Session AM Overlap)
Timeframe: 30m TF Entry
🔹 Trade Parameters
Entry: 182.672
Profit Target: 240.946 (+49.99%)
Stop Loss: 181.428 (−0.68%)
Risk-Reward Ratio (RR): 91.55
🔹 Trade Narrative
Trade initiated during the London–New York AM overlap, leveraging session liquidity expansion.
Entry taken after retracement into demand zone (confluence of Asian session low and higher TF order block).
Stop tightly placed beneath rejection wick at 181.428, securing minimal downside exposure.
Target set at macro resistance/liquidity cluster near 240–241, aligning with measured move projections.
🔹 Market Context
SOL has been in a macro bullish continuation after reclaiming key liquidity zones in July.
Asian session ranges acted as accumulation footprints leading into the NY expansion.
Higher timeframe trend confirmed bullish bias with EMA + VWAP support (208–209).
Volume expansion validates institutional accumulation and breakout structure.

SOLUSDT 4H✅ SOL/USDT — 4H (Binance) | Aug 20, 2025 — Professional Technical Read
🔎 Chart context
• Structure is broadly bullish since early Aug, but the last leg printed a lower high → pullback into a 4H demand/FVG block.
• Price now ~180.7 inside that block. Two paths are drawn on your chart: a reaccumulation → breakout to 210 or a loss of demand → sweep 158.
📍 Key levels (approx.)
• Supply / liquidity above: 200–210 (major liquidity line marked 210.00).
• Decision block (current): ~175–183 (4H demand/FVG; prior breakout origin).
• Pivot / CH reference: ~194–196 (CH 4H label — reclaim turns momentum cleanly bullish again).
• Support below: ~158 (tagged on chart), then 150–145 (deeper old base).
🧭 Market structure & liquidity map
• After the CH 4H and rally to the recent peak, price created a higher low around ~165–168, then a spike to ~205, and is now mitigating the 175–183 block.
• Wicks show responsive buyers at the upper edge of the block, but the midline is soft; a clean close below ~175 likely exposes the resting liquidity at 158.
• Above, buy‑side liquidity sits over 200 with a cluster around 209–210 (equal‑highs feel).
📈 Bullish continuation (probable if 175–183 holds)
Conditions:
• Hold 175–183 with a 4H HL and impulsive reclaim of ~188–190, then CH area ~195.
Path & targets:
1. Trigger reclaim: 188–190 → momentum confirmation above 195 (CH 4H).
2. TP1: 198–200 (partial).
3. TP2: 205–206 (prior swing).
4. TP3: 209–210 (liquidity sweep).
Invalidation: a 4H close below 175.
📉 Bearish continuation (activated on loss of demand)
Conditions:
• 4H close below 175 or failed bounce capped under 188–190.
Path & targets:
1. Pullback/failed retest into 182–186 (sell zone).
2. TP1: 168–166 (intermediate shelf).
3. TP2 (main): 158 sweep (your downside tag).
4. Extension (if momentum persists): 150–145 mitigation.
Invalidation: sustained reclaim >195.
🎯 Trade plans (system‑agnostic

SOL Game Plan - Solana AltcoinSOL Game Plan
📊 Market Sentiment
Overall sentiment remains bullish, supported by expectations of a 0.25% rate cut in the upcoming FOMC meeting. A weakening USD and increasing global risk appetite are creating favorable conditions for further upside in crypto assets.
📈 Technical Analysis
Price has aggressively broken the HTF bearish downtrend and closed above it on the daily chart, indicating potential continuation to the upside.
In addition, price broke through the HTF resistance level, which is now acting as HTF support.
📌 Game Plan
I expect price to retrace back to the HTF support level at $194 and bounce from there, potentially retesting the broken HTF trendline as well.
🎯 Setup Trigger
I will monitor the 4H market structure for confirmation before initiating a position.
📋 Trade Management
Stoploss: Daily close below HTF support zone
Target: $296 (all-time high)
💬 Like, follow, and comment if you find this setup valuable!
⚠️ Disclaimer: This content is for informational and educational purposes only and does not constitute financial, investment, or trading advice. Always do your own research before making any financial decisions.

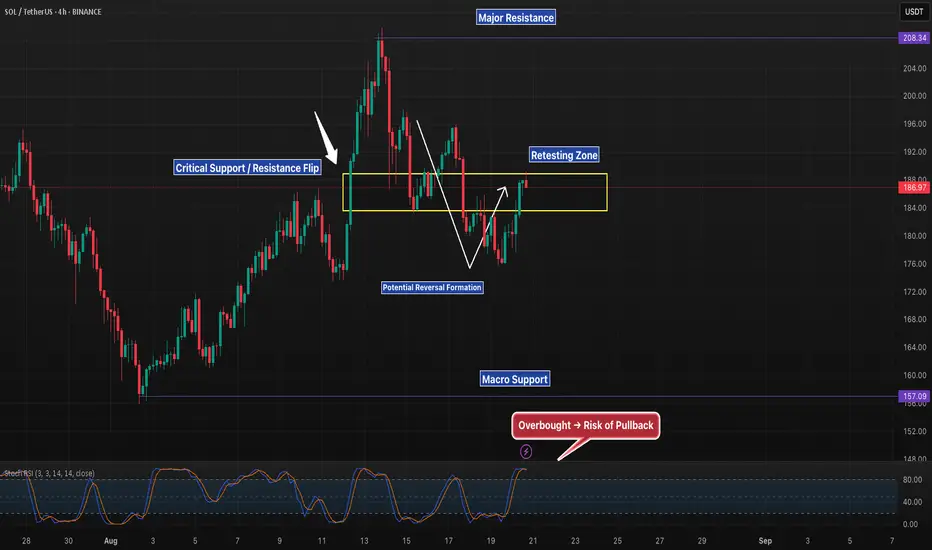
SOL 4H – Support Flip or Fakeout, What’s Next?Solana has rebounded strongly from the 178–185 support zone, reclaiming the level that previously acted as resistance. Price is now retesting the zone, making this a key decision point.
Support / Resistance Flip: Holding above 185–178 could confirm a bullish reversal.
Upside Target: If bulls hold, next test is the 208 resistance.
Downside Risk: Rejection here could trap buyers and send price back toward 157 support.
Momentum: Stoch RSI is heavily overbought, suggesting caution on chasing upside.
The next sessions will reveal whether SOL can confirm this support flip, or if it’s just a fakeout before deeper downside.
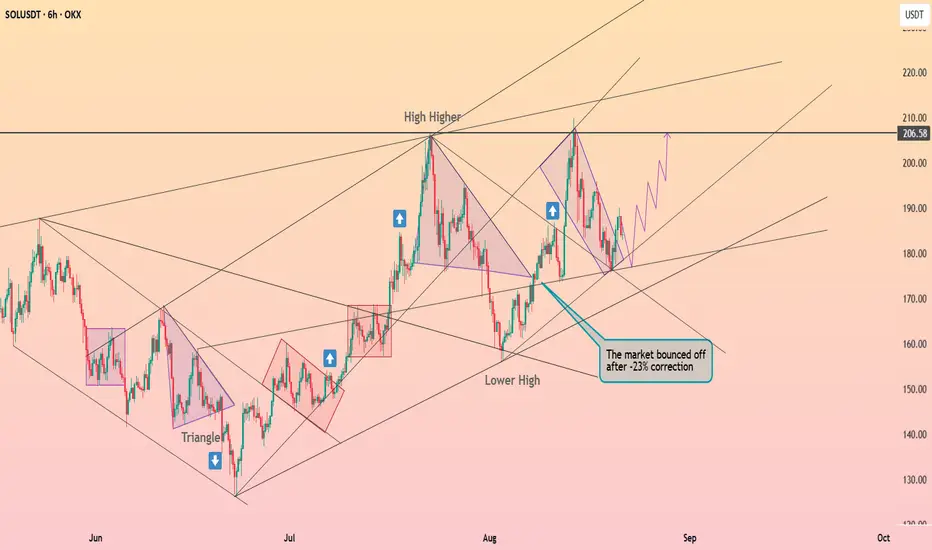
Solana exited the descending wedge ┆ HolderStatOKX:SOLUSDT has recovered quickly from a -23% correction, holding structure with higher highs and resilient rebounds. The market is now preparing for a retest of $206.58 resistance, and a breakout could fuel another push higher toward $220+.
Market CorrectionThere would be a crypto market correction starting 24-25 August and continuing until 2-3 September.
You would see a 10-15% drop for middle and large-cap Altcoin, and Bitcoin might retest the 108-109k level.
Let's see if my prediction comes true!
#crypto
#cryptomarket
#cryptomarketprediction

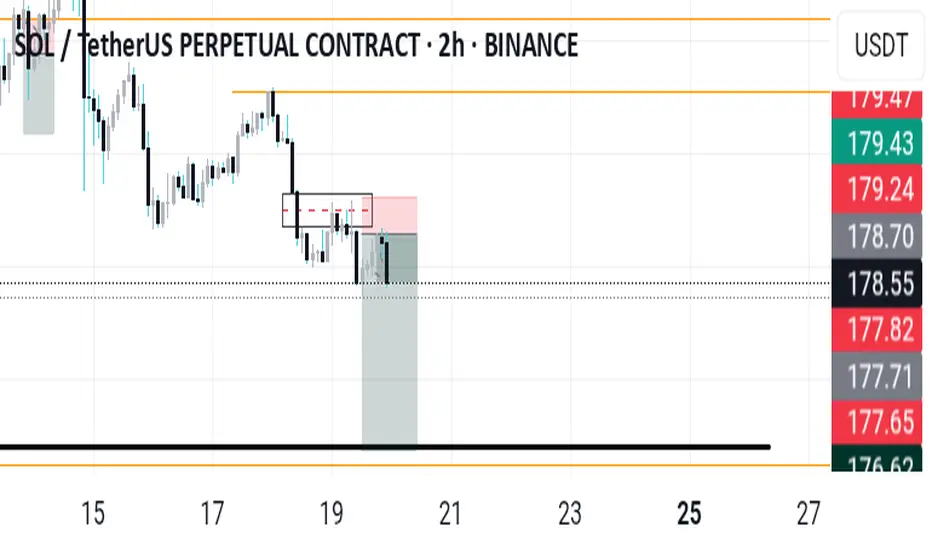
About the short position Now it seems that our sL is gonna get hit
Now we wait if its gonna go out of divergence or if its gonna stay in where we will open one more position.

Sol breakout/breakdownSOL is consolidating in a broad range between roughly $160 and $218.
The strategy is to buy on a decisive breakout above $218 with strong volume confirmation, aiming for continuation toward higher targets. Failure to break out could trigger a retest of lower support levels in the $160 region.

