Weekly trading plan for SolanaA clear bullish divergence is visible on the 1H RSI. The price has already reacted from the first support level and is attempting a reversal. The key level for this week is 191 .
If the weekly pivot point is successfully broken, we could see growth with a new high and a target at 227 . If the price fails to hold above 191 , there’s a high probability of a drop back to the monthly pivot point.
It’s also important not to break below 171 , otherwise the price could set a new local low and reach 155 .
SOLUSDT trade ideas

SOL/ETHSOL/ETH
ETH has ran - SOL is consolidating under 200$ for a while now.
Guide for us to monitor.

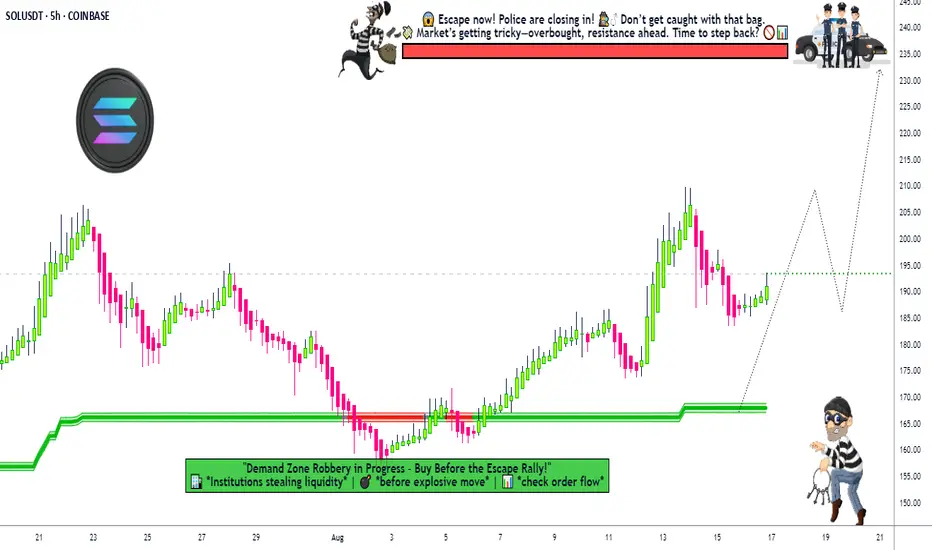
Is This the Perfect Time for a Solana Bullish Heist?🔥🚨 THIEF TRADER’S SOL/USDT HEIST PLAN! 🚨🔥
Asset: SOL/USDT "Solana vs Tether" | Plan: BULLISH HEIST MODE! 💰🎯
🎯 ENTRY: THIEF LAYER STRATEGY (MULTI-LIMIT ORDERS!)
"STEAL AT EVERY LEVEL!" 🏴☠️
📍 Layer 1: 190.00
📍 Layer 2: 185.00
📍 Layer 3: 180.00 (Add more layers if you’re a greedy thief!)
🚨 Thief Pro Tip: The more layers, the bigger the loot! Adjust based on your risk appetite.
🛑 STOP LOSS: THIEF ESCAPE ROUTE!
"DON’T GET CAUGHT!" 👮♂️
🔻 SL @ 173.00 (OG Thieves adjust SL based on risk!)
⚠️ Warning: Bears might set traps—stay sharp!
🎯 TARGET: POLICE BARRICADE AHEAD!
"CASH OUT BEFORE THEY CATCH YOU!" 🚔💨
🎯 Main Target: 240.00 (But escape early at 235.00 to be safe!)
💰 Thief Rule: Take profits like a ghost—disappear before the cops arrive! 👻
⚡ THIEF TRADING RULES:
✅ Scalpers: Only LONG side heists! Use trailing SL to lock profits!
✅ Swing Thieves: Stack layers & hold for the big score!
✅ Risk Management: Never risk more than you can steal!
📢 THIEF ALERTS!
🚨 News = Trap Zone! Avoid new trades during high-impact news!
🚨 Trailing SL = Your Getaway Car! Protect your stolen cash!
💥 BOOST THIS IDEA TO SUPPORT THE THIEF SQUAD!
"More boosts = Bigger heists next time!" 🚀💸
❤️ **Like, Share, & Follow for more CRYPTO HEIST PLANS!
⚠️ DISCLAIMER: This is NOT financial advice—just a Thief’s Master Plan! Trade at your own risk! 🎭
🚀 NEXT HEIST COMING SOON… STAY TUNED, THIEVES! 🏴☠️🔥
SOL 1H – Lower-High Supply at 190; Trendline Retest or BreakdownSOL printed a lower high beneath 192 and is coiling in a tight 186.5–190 intraday range under supply. With Stoch RSI overbought, risk favors a fade into the rising 1H trendline (~185–186).
Bull case: Hold the trendline and reclaim 190–192 → opens a run at the prior wick highs; intraday momentum likely rotates back up.
Bear case: Clean break and 1H close below the trendline turns the micro-structure lower and exposes the 173–176 demand for a deeper test.
Key triggers I’m watching:
Acceptance above 192 = squeeze toward 196–200.
Loss of 185.5 with momentum = continuation into 175 demand.

SOL – Road to $435
Current Price: $187.80
T1: $302.14
T2: $369.36
T3: $435.05
📊 Price has completed a bullish cup & handle formation and is now preparing for a strong breakout. Weekly structure remains intact, with higher highs and higher lows.

$SOLANA LONGHow amazing it is when you’re able to spot a move and watch it out.
This BYBIT:SOLUSDT.P trade is on 1:7RR.
This is the system that helps you recover as a trader.
Imagine after one or two losses and you hit this kind of move, it’s a complete blessing!!!

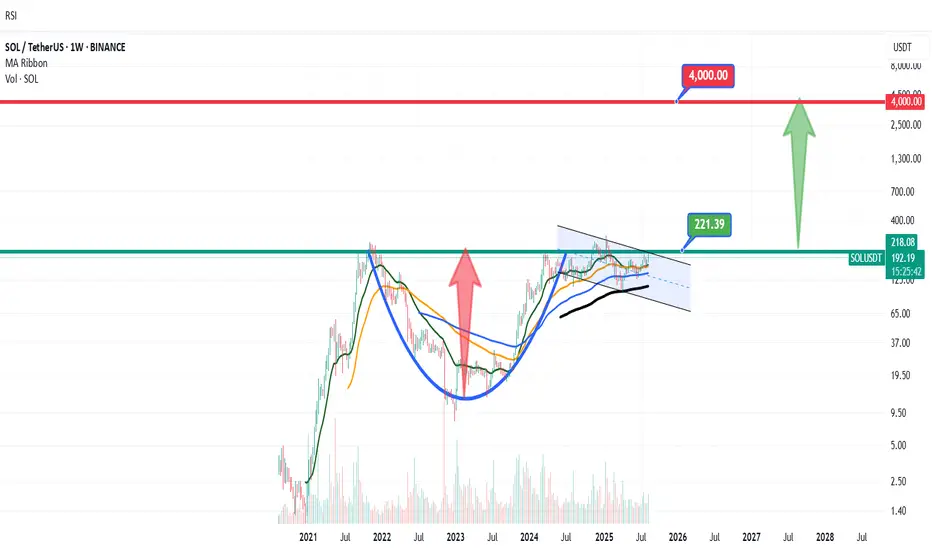
Solana Trades Above $200: New ATH Revealed, Next Target & MoreSolana has been consolidating within a very wide range since February 2024. Solana ended its bear market December 2022. The market bottom was followed by a quick bounce and accumulation phase at low prices.
A 280 days long consolidation (Dec 2022 - Oct 2023) produced a rise from $20 to $210 ending March 2024. From this point forward we have a new long consolidation period but this time instead of 280 days SOLUSDT has been ranging for 525 days. Imagine how strong the next advance will be.
280 days of consolidation was enough to produce 10X growth.
Solana produced a low recently in April and has been recovering since. Prices from late February 2024 through present day form part of a sideways consolidation channel. This period is reaching its end.
The last low marked the end of this period and the start of the next bullish wave. This bullish wave is ongoing now and soon Solana will break local resistance and hit a new all-time high.
Right after the all-time high the first resistance zone of importance is $415 ($420 in some cases). Next we have $667 ($620 in some cases) and these are the levels to watch.
Current market conditions support a rise on SOLUSDT reaching $900 - $1,100.
Soon we will know if the market can continue even higher. For now these are the targets for this 2025 bull market. We are only weeks away from a major frenzy.
Namaste.


SOLUSDT Holding Long Term Trendline SupportSOLUSDT continues to show strong bullish structure, with price consistently holding above a multi-year ascending trendline a key structural element that has defined its uptrend. This dynamic support has anchored price action within a broader ascending formation, reflecting steady long-term accumulation.
Additionally, the chart reveals a well defined Cup and Handle formation, further reinforcing the bullish outlook. As long as price respects the immediate demand zone, this area remains a prime region for re-accumulation, with expectations for it to hold as a firm support level.
The projected target for this setup is clearly illustrated on the chart, aligning with the broader bullish continuation narrative.
Share your view, do you see SOLUSDT pushing higher from here, or is a deeper retest likely before the breakout?

SOLANA: THE ULTIMATE TECHNICAL CONVERGENCE..📊 THE TRADING PLAYBOOK
🛡️ CONSERVATIVE SUPPORT PLAY
Setup: Buy at Fibonacci support levels🚨
Entry: $158-$165 (0.618-0.5 zone) 🌟
Stop: $140 (Below all major support) ❌
Target:
Tp1 : $200(25% gain) 💰
Tp2 : $232 (40% gain) 💰
⚡ Position Size: 3-5% of portfolio ⚡
Time Horizon: 3-6 weeks 🎯
______ NOTE _______
DYOR ⚠️ Not financial advice. This analysis is for educational purposes only. Always do your own research and never risk more than you can afford to lose.
#SOLANA #SOL #SymmetricalTriangle #Fibonacci #Breakout #Crypto #TechnicalAnalysis #AltSeason #DeFi #MemeCoins #TradingSetup
SOLUSDT Breaks Resistance – Targeting 230–240 RangeSOLUSDT has broken above a key resistance zone after a strong bullish impulse from the demand zone around 170. Price action has confirmed a BOS (Break of Structure) and is retesting near the weak high area. If bullish momentum continues, the next potential targets lie near 230 and 240, aligning with the upper trendline of the upward channel.
Key levels to watch:
Support: 170–180 (Demand zone)
Resistance: 210, 230, 240
A sustained move above 210 could open the path for further upside. Failure to hold above 200 may lead to a retest of the demand zone.
This is an educational idea, not financial advice.

SOLANA Potential Bullish Continuation OpportunitySolana seems to exhibit signs of potential Bullish Momentum on the shorter timeframes as the price action may form a credible Higher Low with multiple confluences through key Fibonacci and Support levels which presents us with a potential long opportunity.
Trade Plan:
Entry : CMP
Stop Loss : 172
TP 0.9 - 1 : 207 - 209

SOL Volatility Period: Around August 18
Hello, traders!
Follow us to get the latest information quickly.
Have a great day!
-------------------------------------
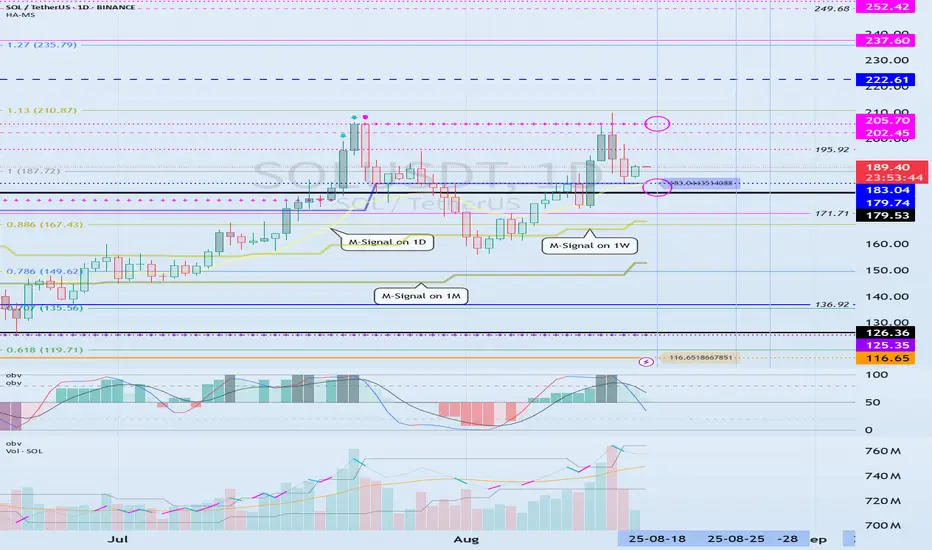
(SOLUSDT 1M Chart)
If the price stays above the M-Signal indicator on the 1M chart, the uptrend is expected to continue.
If it falls below 126.36, you should stop trading and observe the movement.
Since the HA-High indicator is forming at 179.74, the key question is whether it can find support near this level and rise.
The start of a stepwise uptrend is likely to begin with a rise above 237.60, the DOM (60) indicator level.
Therefore, the key point to watch is whether it can find support in the 179.74-237.60 range.
The DOM (60) indicator indicates the end of a high, while the HA-High indicator indicates a decline from a high.
Therefore, the 179.74-237.60 range can be considered a high boundary zone.
When the DOM (60) or HA-High indicator first forms, a decline is likely.
If the decline is followed by a rise near the HA-High or DOM (60) indicator, the likelihood of an upward breakout increases.
Therefore, if support is found around 179.74 this time, it is highly likely to lead to an attempt to rise above 237.60.
-
(1W chart)
The key area to watch on the 1W chart is whether the price can break above the 202.45-222.61 level.
If the price breaks above the 202.45-222.61 level and maintains its upward momentum, a stepwise uptrend is likely to begin.
-
(1D chart)
The key area to watch on the 1D chart is whether the price can find support around 179.53-183.04 and rise above 205.70.
The 183.04 point is the HA-High indicator level, and the 205.70 point is the DOM (60) level.
If it falls below 183.04, it is expected to meet the M-Signal indicator on the 1W chart and re-establish the trend.
Ultimately, the price must remain above the M-Signal indicator on the 1M chart to maintain a strong uptrend.
Therefore, looking at the bigger picture, we need to determine whether the 126.36-179.53 range provides support and allows for an upward movement.
SOL's current volatility period is around August 18th (August 17th-19th).
At this time, we should look for a direction in which it deviates from the 183.04-205.70 range.
-------------------------------------------------
Only the concept of price moving averages, which I learned while studying chart analysis, is applied to the M-Signal indicator on the 1M, 1W, and 1D charts.
The rest of the explanation cannot be interpreted using existing chart analysis techniques.
This is because the HA-Low and HA-High indicators were developed for trading on Heikin-Ashi charts, while the DOM(60) and DOM(-60) indicators are a comprehensive evaluation of the DMI, OBV, and MOMENTUM indicators.
Therefore, to interpret my charts, you must apply the concepts of support and resistance points.
It's not that my chart explanations lack logic; they simply seem illogical because they can't be interpreted using existing interpretation methods.
Chart analysis should be as simple and concise as possible.
If you spend too much time analyzing charts or trying to apply complex theories, you will lack time to develop a trading strategy, increasing the likelihood of your trades going in the wrong direction.
To interpret my chart, all you need is a basic understanding of price moving averages and support and resistance.
Support and resistance points are determined by the horizontal lines of the DOM(60), HA-High, HA-Low, and DOM(-60) indicators.
The DOM(60) and HA-High indicators mark highs, while the HA-Low and DOM(-60) indicators mark lows.
Therefore, a basic trading strategy can be used: buy when the price rises from the DOM(-60) to HA-Low range, and sell when it reaches the HA-High to DOM(60) range.
However, if the price rises above the HA-High to DOM(60) range, a stepwise uptrend is likely, while if the price falls below the DOM(-60) to HA-Low range, a stepwise downtrend is likely.
Therefore, a segmented trading strategy should be adopted.
-
The basic chart for chart analysis is the 1D chart.
Therefore, it's best to trade in line with the trend of the 1D chart.
Therefore, the position that matches the trend of the 1D chart becomes the main position.
So, since the current trend of SOL's 1D chart is up, the LONG position becomes the main position.
To trade based on the trend of the 1D chart when trading futures, you need to set low leverage.
Therefore, when trading based on the timeframe chart you're viewing, increase your investment proportion when trading in line with the trend of the 1D chart. Conversely, when trading in the opposite direction, reduce your investment proportion and execute short, quick trades.
-
Thank you for reading to the end.
I wish you successful trading.
--------------------------------------------------
- This is an explanation of the big picture.
(3-year bull market, 1-year bear market pattern)
I will explain in more detail when the bear market begins.
------------------------------------------------------
SOL - 1H Elliott Wave Analysis - 15.08.25Greetings! We hit 100 Followers, welcome to all the new joiners :) Happy to have you here with us, thank you! ^-^
We assume the recent high on the 14th of August was the Wave 1 of an impulse to the upside.
We are looking for a Wave 2 retracement as ABC now of which presumably finished Wave A and started Wave B. The standard resistance for Wave B is between the 0.382 FIB at 198.32 USD and the 0.886 FIB at 207.23 USD. The Wave 2 support area is between the 0.382 FIB at 189.22 USD and the 0.786 FIB at 167.39 USD.
Thanks for reading.
NO FINANCIAL ADVICE.

SOL LONG Stop loss hunt was severe . Bulls stepped back in at 186 to defend demand zone. RIP rookies.
Time for the next leg up. Target $235

SolusdtIt’s time to be careful about SOLUSDT .
A double top at 210.
With a strong weekly liquidity at around 170.
However, we should be careful of the levels of fibbo which targets lower numbers.

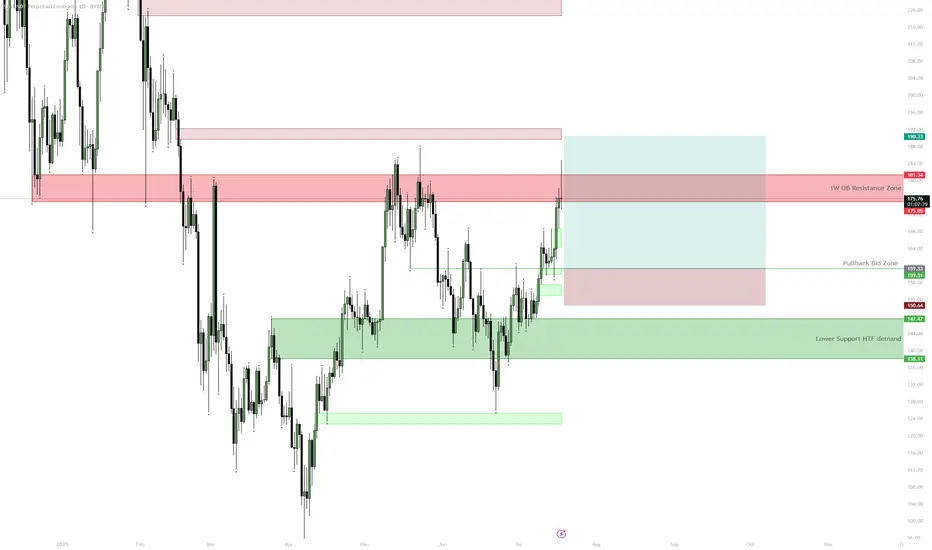
SOL — $180 HTF Resistance | Consolidation ExpectedSOL is approaching a key HTF resistance zone at $175–$181 with 1D RSI close to overbought. Unless price cleanly breaks above this area, a pullback to $160 or even the $138–$147 demand zone is likely before further upside. The setup provides a better risk/reward for longs on pullbacks after consolidation rather than chasing at resistance.
SOL - 1H Elliott Wave Analysis - 11.08.25Welcome to our updated Elliott Wave Count for Solana.
We hit the in our last analysis projected target for the white Wave 3 and it seems that we started the white Wave 4 correction in the red ABC. It seems that we are still in the red Wave C but we're looking for it to finish soon.
The white Wave 4 support area which we already entered lies between the 0.236 FIB at 180.27 USD and the 0.5 FIB at 173.66 USD. We have just tested the 0.382 FIB at 176.61 USD which is the most common target for a 4th wave. The next downside targets for the red Wave C would be the 1.382 FIB at 175.03 USD and the 1.618 FIB at 173.01 USD which is in confluence with the 0.5 FIB of the white Wave 4 support area. In this impulse count we do not want to break below the 0.618 FIB at 170'70 USD.
Thanks for reading.
NO FINANCIAL ADVICE.

SOL/USDT Price Prediction - 1W (Updated)**** Yousef Sharafi ****
In the weekly time frame, an Cup and Handle pattern is visible on the chart.
Follow me here for more analysis
SolUSDT breakoutSolana breakout the downtrend line. Possible to see good move on 1H timeframe.
This not Financial advice you buy or sell its your responsibility.

SMC Breakdown: Liquidity, Inducement & Trap Playbook📈Sell-Side Liquidity (SSL) Grab:
Price sweeps equal lows (EQL), triggering retail stop-losses and fueling institutional entries.
📈CHoCH (Change of Character):
A bullish shift in structure confirms the reversal after SSL is cleared.
📈Fair Value Gap (FVG) Fill:
Price retraces to rebalance inefficiency left by the impulsive bullish move.
📈Inducement:
A lower high tempts breakout sellers just before price reclaims the zone—classic trap formation.
📈Buy Entry Confirmation:
Entry is triggered at the FVG zone, in confluence with CHoCH, SSL grab, and inducement.
📈Buy-Side Liquidity Target:
Price aggressively rallies to sweep buy-side liquidity resting above previous highs.
📈Trap Above Highs:
A final liquidity grab above highs where late buyers enter, only for price to reject—marking smart money’s exit.


SOLANA SEASON - PUMP TO 600$This analysis shows that Solana is pumping to it's ALL-TIME HIGH in this ALTCOIN SEASON!
SUBSCRIBE, BOOST AND COMMENT IN ORDER TO GET HIGH QUALITY TECHNICAL ANALYSIS.
Firstly, our Algo-based indicators are used to create this analysis.
