SOLUSDT: Get Ready For 300 Mark, This Time Reversal BigSOLUSDT has the potential to reach the 300 price range once it falls to our buying zone, defined by two horizontal white lines. Upon reaching this area we can target the 300 price level. Please exercise accurate risk management when trading cryptocurrencies.
For further analysis please like and comment.
Team Setupsfx_
Trade ideas

Solana using TrenVantage LITEGood news is Solana was able to wick and grab a new high in this move.
Bad news is this looks like distribution of its move and the near support levels have already been tested.
Expecting a retrace back to the move which took us to the previous high, or previous accumulation levels.
If crypto market sees a bear market would expect below $50 for sol, probably below $20
Trends plotted by the TrenVantage LITE indicator,

SOL Short 1D Rebalancing the bearish inefficiency is likely to lead to further development of the downward movement.

SOL long-term TASolana is in heavy distribution, currently the weekly downtrend is engaged, it needs more time to bottom out, there's a good support at this area of $130ish and if it's broken we can see the lows of $100ish again.

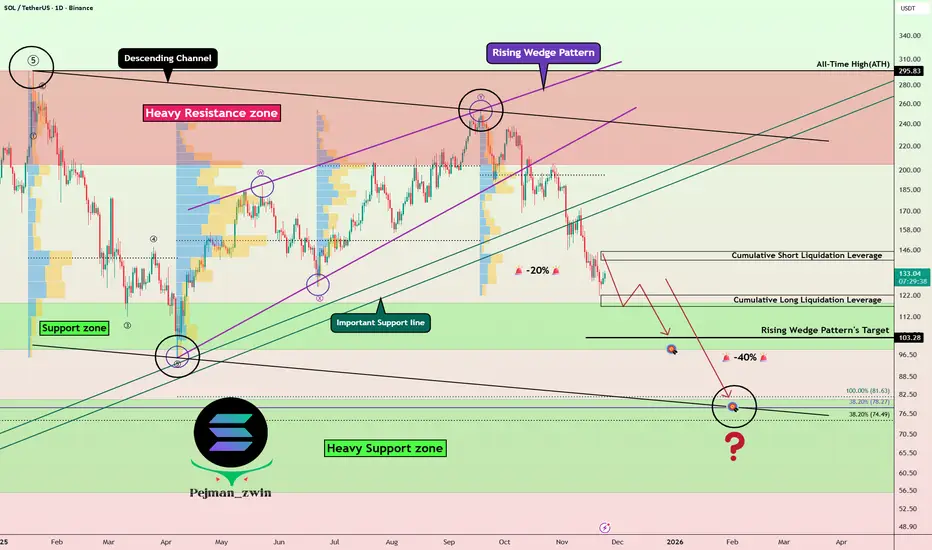
Solana Breakdown Roadmap—Is the Correction Just Getting Started?Today, I analyze the Solana( BINANCE:SOLUSDT ) project and explore its roadmap for the coming days and weeks, so stay tuned!
Solana, with the help of the Rising Wedge Pattern, has successfully broken through its important support lines and is currently moving near the Support zone($118-$98).
From an Elliott Wave perspective, it seems that Solana has completed its five main waves and is now in a corrective phase.
Given the current cryptocurrency market conditions, I expect Solana to break through the Support zone($118-$98) and at least reach the target of the rising wedge pattern, potentially dropping down to $80.
Additionally, it’s worth noting that the SOLBTC( BINANCE:SOLBTC ) pair is also showing a bearish trend, which means that if the broader crypto market declines, Solana could face even greater losses.
First Target: $107
Second Target: $83
Stop Los(SL): $174
Cumulative Long Liquidation Leverage: $122-$119
Cumulative Short Liquidation Leverage: $150-$145
💡 Please respect each other's opinions and express agreement or disagreement politely.
📌Solana Analyze (SOLUSDT), Daily time frame.
🛑 Always set a Stop Loss(SL) for every position you open.
✅ This is just my idea; I’d love to see your thoughts too!
🔥 If you find it helpful, please BOOST this post and share it with your friends.
SOL USDT LONG SIGNAL---
📢 Official Trade Signal – SOL/USDT
📈 Position Type: LONG
💰 Entry Price: 131.34
---
🎯 Take-Profit Targets (Partial Exits):
TP1 = 133.70
TP2 = 136.87
TP3 = 140.35
TP4 = 143.90
TP5 = —
---
🛑 Stop-Loss: 128.00
📊 Timeframe: 15m
⚖️ Risk/Reward Ratio: 4.47
💥 Suggested Leverage: 5× – 10×
---
🧠 Technical Analysis Summary
SOL is currently showing strong bullish momentum after holding the 131.00 support zone and forming a clean higher-low structure on the 15m timeframe.
Buyers are stepping back in as price pushes above short-term EMAs, creating a favorable long opportunity.
Liquidity pools sit above 133.70 and 136.87, making TP1 and TP2 highly probable targets.
A breakout through 136.87 may fuel continuation toward 140.35 and higher liquidity at 143.90.
Market structure remains bullish unless price closes below the 128.00 invalidation zone.
---
⚙️ Trade Management Rules
✔️ Take partial profit at TP1
✔️ Move SL to Break-Even once TP1 is hit
✔️ Trail SL as price approaches upper targets
✔️ Avoid re-entry if SL gets hit
✔️ Always confirm short-term market structure before entering
---
⚠️ Risk-Management Note
Once TP1 is reached, moving SL to Break-Even is essential.
If price reverses and tags BE, the trade ends with zero loss, fully protecting capital.
🔐 Capital protection is priority #1.
---
📌 TradingView Hashtags
#SOLUSDT #SOL #CryptoSignal #LongSetup #TradingView
#TechnicalAnalysis #FuturesTrading #Altcoins
--

SOL-USDT
Solana has managed to break its downward channel and reach its first target at $136. This level now acts as Solana's first support 🔼✔️
Now, if this level holds, it could continue rising to $143. However, if this support breaks 📊📉
It could pull back to the broken trend line and then resume the upward move. These are the two current scenario possibilities.
I'll update you if there are any changes 🙂✌️💰💲

$SOL weekly structure shows a possible liquidity sweep toward CRYPTOCAP:SOL weekly structure shows a possible liquidity sweep toward the green demand zone before trend reversal. Current move looks corrective, not a trend change. If buyers defend the zone, market can enter an accumulation phase leading to a strong bullish expansion toward 2026-27. Long term outlook remains positive as long as the demand zone holds. Patience over panic.
SOLUSDT — Move Down? (NY Session Shenanigans Edition)Alright, here we go — one more short idea for today… and then I promise I’ll touch grass. 🌿
SOL hit us with some premium NY session manipulation right out of the gate — classic “let’s stop out everyone before choosing a direction” behaviour.
Now it looks like price wants to slide down, so I’m taking the setup and calling it my final boss trade of the day.
Will it work?
Maybe.
Will it ruin my mood?
Also maybe. 😅
Let’s see how it plays out — trade safe, stay disciplined, and protect your sanity.
GL legends! ⚡️📉🔥

SOL: Very clear Head & Shoulders pattern visibility📊If we compare the D1 charts on BTC and Solana, we can see that on Solana's chart, we have a MUCH MORE clear image of the Head and Shoulders formation - that is why it is always worth spending extra time to compare the correlating charts to get the full picture if some evidence is missing or hidden under the market noise.
⚠️This might be an indication of a strong drop even further if the BTC major 75k support line were to collapse. Be cautious!

SOL-USDT
It is inside the same channel I told you about yesterday 💲💲
If it doesn't break above the top of the channel and the descending channel isn't broken 📊
The first support level is at $127, and if the correction continues, it might even go down to $121 🚨🔽

Inverse Head and Shoulders PatternThe inverse head and shoulders pattern is a technical analysis tool used to signal a potential trend reversal from a downtrend to an uptrend.
The inverse head and shoulders pattern is characterized by three consecutive troughs, with the middle trough (head) being the lowest and the two outer troughs (shoulders) being higher and nearly equal. This formation indicates that the downtrend is nearing its end, and a reversal to an uptrend may occur soon. Identifying this pattern can provide traders with a valuable signal to enter a new long position or exit a bearish trade, making it an essential part of technical analysis.
The inverse head and shoulders pattern is the opposite of the head and shoulders pattern. Technical traders widely follow both formations due to their distinct shapes and clear signals as trend reversal patterns.
Solana is forming a bullish flagSOL has formed a bullish flag, with movement in a local uptrend being established. The high in the purple areas is highly likely to be broken
Two 4H imbalances are located above. This is where sellers are most likely to react

My plan to next mov of SOLMy outlook for SOL’s next move is that it will bounce hard, but heavy selling will likely come in during that move. In other words, a sudden sell-off might hit in the middle of the upward move; something that may look like a normal correction at first but turns out deeper than expected. After that, the price might climb a bit again, but we should wait and stay cautious until things become clearer.

SOLUSDT: Liquidity Tightens – Every Pullback Drops Even Deeper!When talking about Solana right now, the clearest feeling is that the market is losing strength day by day . Recent news shows that SOL has dropped sharply in November, and large capital keeps exiting the market — turning every bounce into an excuse for holders to sell rather than a sign of reversal.
On the H4 chart, SOL is trapped inside a descending wedge , repeatedly rejected by the Ichimoku cloud — an area that has consistently blocked every recovery attempt. Each previous bounce has only led to an even stronger downward leg.
The $130 level is the nearest immediate resistance and also aligns with the descending trendline. If price pulls back to this zone, there is a high probability of fresh selling pressure emerging. When that happens, SOL could continue dropping toward the psychological support at $100 — the key target in the current bearish outlook.
In summary, with both negative news and a weak technical structure, the most reasonable strategy now is to follow the downtrend , wait for price to pull back into resistance to find cleaner entries, and avoid catching bottoms when the market shows no clear reversal signals.

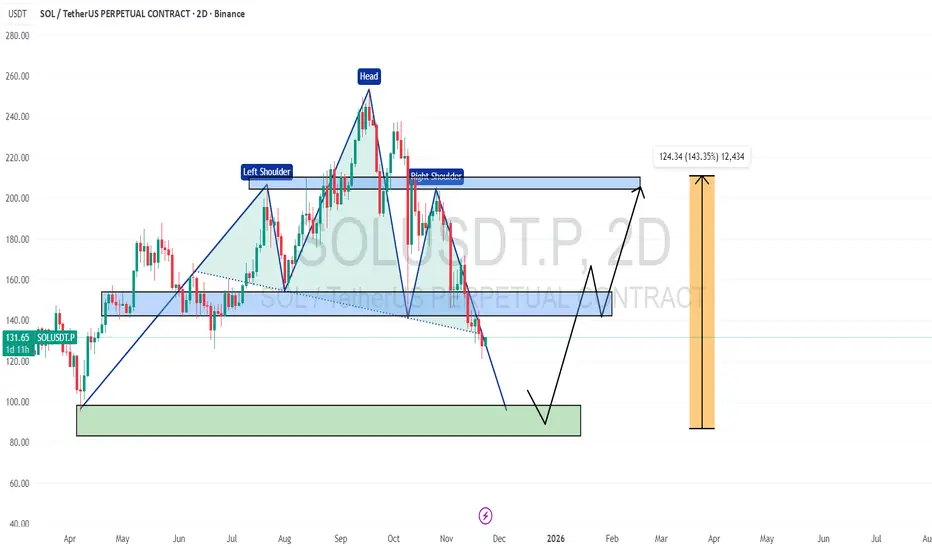
SOL USDT 2D CHART UPDATE 📌 CRYPTOCAP:SOL 2D Chart shows a head & shoulder pattern✅
📌 If this continues, the price may continue to decline ✅
📌 However, a bullish reversal is expected from the support zone below ✅
If this happens, the price may go back to the $150, $200+ range 🔥🚀
Head and Shoulders forming for SOLHead and Shoulders forming for SOL
Possible bounce from here to 195$

SOL-USDT🔤🔤🔤
Solana is in a downtrend channel 💰💰
which has shown a good reaction at the channel's bottom.
Two important support levels for Solana are the $127 range and then $121 🔽📊
On the other hand, the first resistance is the top of this channel at $137, and if this is broken, the next target will be $143 📣🔼

#SOLUSDT – Harmonic C-Leg Hit | Bullish Expansion Zone
SOL has finally tapped the 0.844–0.886 retracement, completing the harmonic C-leg exactly as projected in the previous analysis.
This zone acts as a strong structural support, and holding above it keeps the bullish scenario intact.
🔹 Targets
• $230–$260
• $345 (Harmonic D)
• $410+ (Major Resistance Zone)
🔹 Invalidation
Weekly close below $100.
✨ Clean reaction. Harmonic structure still valid.

SOL USDT SHORT SIGNAL---
📢 Official Trade Signal – SOL/USDT
📉 Position Type: SHORT
💰 Entry Price: 127.28
---
🎯 Take-Profit Targets (Partial Exits)
TP1 = 121.53
TP2 = 116.85
TP3 = 111.66
TP4 = 106.28
TP5 = —
TP6 = —
---
🛑 Stop-Loss: 131.00
📊 Timeframe: —
⚖️ Risk/Reward Ratio: 5.79
💥 Suggested Leverage: 5× – 10×
---
🧠 Technical Analysis Summary
SOL has entered a strong supply zone around 127–129, showing clear signs of weakness and rejection.
Bearish wicks on lower timeframes indicate exhaustion of buyers and a likely downward retracement toward liquidity zones below.
TP levels align with major support levels and liquidity pockets from previous structure breaks.
Momentum indicators are showing bearish divergence, supporting a short setup.
---
⚙️ Trade Management Rules
Take partial profit at TP1
Move Stop-Loss to Break-Even once TP1 is hit
Trail SL gradually as price approaches deeper targets
Avoid re-entry if price hits SL at 131
---
⚠️ Important Risk-Management Note
✔️ When TP1 is hit, the Stop-Loss is moved to the Entry Price (Break-Even).
This is a standard professional risk-management rule.
❗ If the price hits TP1 and later reverses to break-even, this is NOT a loss.
It simply means the trade closed with zero risk after securing progress.
🔐 Our priority is always capital protection before big profits.
---
📌 TradingView Hashtags
#SOLUSDT #SOL #TradingView #CryptoSignal #ShortSetup #TechnicalAnalysis #FuturesTrading #Altcoins
---

The SOL Fractal That Called the April Bottom Is BackSOL – 63-Day Fractal Breakdown, Macro Liquidity Compression, and a Projected Structural Low at 109 (Dec 8)
Advanced Technical Analysis • Liquidity Cycle Modeling • HTF Structural Projection
This analysis examines Solana’s repeating 63-day distribution and decline cycle, visible across all major swing tops in 2024–2025. The current cycle aligns with the time and structural rhythm of the March–April decline, despite originating from different catalyst categories. A deeper extension is now projected, with a structurally valid new low at 109 around December 8, based on cycle symmetry and volume profile displacement.
1. Macro Structure: 63-Day M-Top → 63-Day Decline → Liquidity Exhaustion
Solana has produced three consecutive cycles with nearly identical structural components:
1. Distribution Phase (63 days)
A pronounced M-top forms with weakening momentum, lower-timeframe volatility expansion, and diminishing trend strength. Across all three cycles, this distribution top lasted approximately 63 days before breakdown.
2. Decline Phase (63 days)
Following the M-top, each cycle transitions into a multi-week decline of similar duration:
Lower highs on weekly structure
Gradual liquidity withdrawal
Volume profile thinning
Mean reversion into prior accumulation regions
These two phases together form a repeating HTF liquidity cycle, not random noise.
Cycles:
Dec 2024 → Mar/Apr 2025
May 2025 → Jul/Aug 2025
Sept 2025 → Current decline (ending projected Dec 2025)
The timing and structure of the current decline match the earlier two cycles.
2. Catalyst Comparison: Different Causes, Same Liquidity Behavior
Even though the bearish catalysts differ, the market reaction is identical.
March/April Decline (Internal SOL Catalysts)
Large exploit events
Validation congestion
Finality delays
On-chain liquidations
Current Decline (Macro-Driven Catalysts)
Inflation uncertainty
Government shutdown risk
Liquidity compression across risk assets
Declining altcoin participation
Buyer hesitation despite strong fundamentals
In both cases, liquidity exits the market at the same rate and in the same structural pattern. Price responds to liquidity, not narrative, validating the use of Fractal Structure Analysis.
3. Revised Support Projection: Structural Low at 109 by December 8
While previous cycles bottomed at 128–132, the current cycle shows:
Deeper volume displacement
Increased macro drag
Long-wicked bearish weekly closes
A more aggressive liquidity unwind
A declining mid-range reclaim rate
These factors support an extended deviation beneath the standard fractal floor.
**Projected Bottom: 109 ± 2
Projected Date: December 8**
This 109 target aligns with:
HTF liquidity sweep logic
The lower boundary of the volume imbalance left from the prior bullish expansion
Completion of the 63-day decline window
Equal-range extension from the M-top measured move
The long-term ascending trendline from the November 2023 breakout
This deeper retracement does not break the bullish macro structure—it simply represents a more aggressive liquidity purge due to macro pressure rather than internal network issues.
4. Forward Outlook: Accumulation (Dec) → Reversal (Jan) → Trend Expansion (Feb)
If Solana completes the projected liquidation down to the 109 level:
December
HTF accumulation
Seller exhaustion
Low-volatility compression
Volume profile stabilization
January
First structural higher low
Demand reentry
Reclaim attempts toward the 150–155 micro-structure band
February
Break in HTF market structure
Trend continuation
Full momentum expansion targeting prior resistance levels
Upside targets once the reversal begins:
240 (HTF breaker and mid-range)
280 (HTF supply region)
300+ (cycle extension if macro improves)
This trajectory mirrors the post-April recovery phase, with a shifted timeline due to extended macro drag.
5. Invalidation Criteria
The bullish fractal thesis is invalid under the following conditions:
Sustained weekly close below 105
BTC losing key support with high-volume follow-through
Breakdown of the long-term ascending structure from Q4 2023
Failure to reclaim 150–155 during the January recovery attempt
A breakdown beneath these thresholds would indicate deviation from the multi-cycle rhythm.
6. Conclusion
Solana remains in a well-defined 63-day distribution and decline cycle, consistent across all major tops in 2024–2025. Liquidity behavior remains identical to prior cycles, even though catalyst categories differ.
The cycle now projects a deeper structural low at 109 around December 8, driven by macroeconomic headwinds rather than Solana-specific issues.
A January–February recovery remains the highest-probability outcome, provided structural levels hold and macro conditions stabilize.

Solana and ab=cd Solana has been performing very well and has started to decline after reaching the price ceiling it had repeated. After breaking the dynamic trend line on the daily timeframe, it is currently in a bearish trend. The probability of completing the ab=cd pattern at the drawn support area is high.

SOLI do not think we will go lower then this, the support is huge and the setup is too clean. This is one of the best accumulation zones you will ever get.
