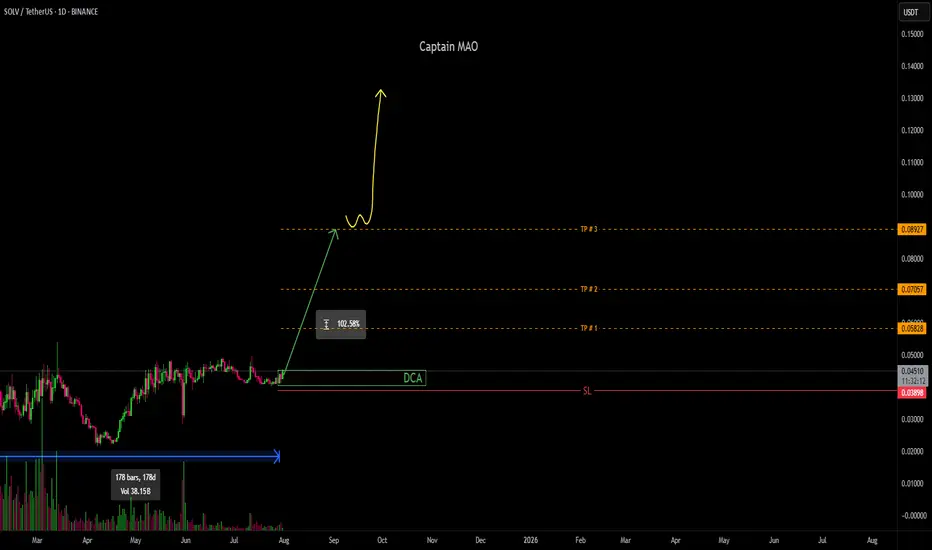
SOLV/USDT +100%has been consolidating in a tight accumulation range for an extended period (~6 months), consistently defending the $0.04 support zone. Price action suggests a potential base-building phase, with buyers repeatedly absorbing dips below $0.04 and establishing a clear floor.
A breakout scenario is dev
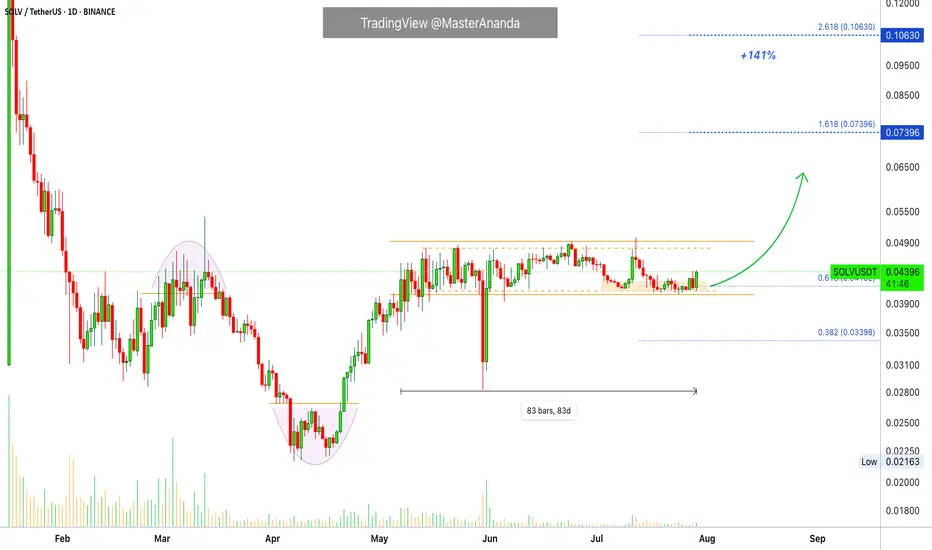
Solv Protocol · Bitcoin Staking · 140% Profits PotentialSolv Protocol has been sideways for 83 days, and it looks ready to rise. The market bottomed in April and afterward has been bullish ever since. It is nice to see how tight the trading range is.
This chart pattern is not very common. When a pair has a chart drawing that is not seen often, it means
Solv Protocol Conquers Resistance, Easy 120%SOLVUSDT has been creeping higher slowly. It has been challenging resistance for weeks and finally, just today, the major resistance level on this chart breaks. It has been conquered.
SOLVUSDT is now in bullish territory and moving higher. The way I see it goes something like this: There will be a

SOLVUSDTBullish Trend continuation expectation as there is no bearish divergence till now.
buying instantly
sl last ll
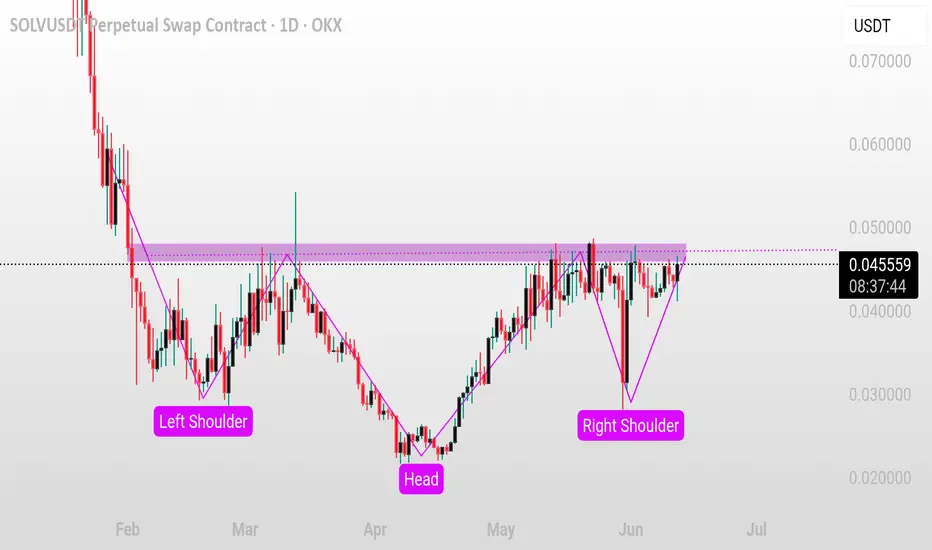
SOLV/USDT – Inverse Head & Shoulders Breakout Setup
Pair: SOLV/USDT 💱
Timeframe: 1D 📅
Pattern: Inverse Head & Shoulders 👕 (Reversal Setup)
SOLV is forming a clean inverse head & shoulders pattern on the daily chart, with the neckline resistance sitting near 0.046–0.047. Price is currently retesting this area, signaling a potential breakout attempt
SOLVUSDT Forming a Bullish waveSOLVUSDT is showing a strong bullish wave pattern after an extended downtrend, suggesting that it may have completed its accumulation phase. The chart clearly illustrates a double-wave reversal formation with higher lows, pointing toward a bullish continuation. The recent breakout candle combined wi

Study SOLV strength!Study SOLV strength! Fully recovered
Once it flips trendline, then no one will be able to stop it.

SOLV/USDT – Coiled and Ready to Launch?
Good morning!!
SOLV is quietly building strength under the radar. After weeks of compression, price action is forming a clean ascending channel with increasing volume and RSI momentum. It just broke above the 4EMA and is now pressing into the $0.0388 level — potentially prepping for a breakout.
📈

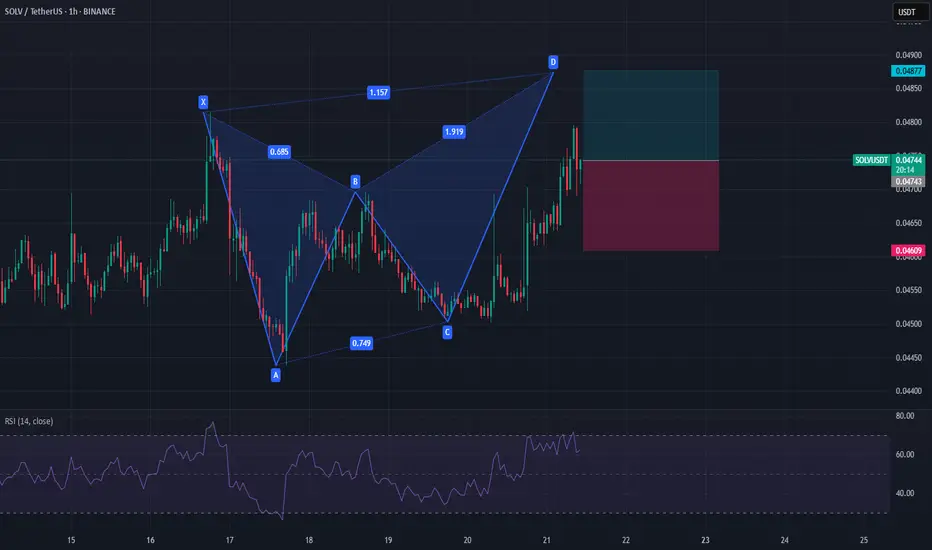
SOLV/USDT – Ready for TakeoffSOLV has been building under the surface and now everything’s aligning. The blue box down below is where buyers will likely step in. Volume’s been creeping up, CDV is showing a bullish divergence, and on the one- and five-minute charts you can already spot the structure you want to see before a move

SOLV Looks Bearish (8H)SOLV appears to be completing an ABC or WXY pattern.
Recently, it lost a trendline, which is a significant bearish signal.
If it loses the white box, it could enter a heavy drop phase.
A daily candle closing above the invalidation level will invalidate this analysis.
For risk management, please

See all ideas
Summarizing what the indicators are suggesting.
Oscillators
Neutral
SellBuy
Strong sellStrong buy
Strong sellSellNeutralBuyStrong buy
Oscillators
Neutral
SellBuy
Strong sellStrong buy
Strong sellSellNeutralBuyStrong buy
Summary
Neutral
SellBuy
Strong sellStrong buy
Strong sellSellNeutralBuyStrong buy
Summary
Neutral
SellBuy
Strong sellStrong buy
Strong sellSellNeutralBuyStrong buy
Summary
Neutral
SellBuy
Strong sellStrong buy
Strong sellSellNeutralBuyStrong buy
Moving Averages
Neutral
SellBuy
Strong sellStrong buy
Strong sellSellNeutralBuyStrong buy
Moving Averages
Neutral
SellBuy
Strong sellStrong buy
Strong sellSellNeutralBuyStrong buy