SPX500 Child of Nas100, Looking Short for the dayProbability: High
Position: Short
Context/Boundary: Daily
SP500 trade ideas

S&P 500 Testing SupportAs shown on the weekly chart of the S&P 500, the stock market index is on track to record a fourth consecutive week underwater. However, with price action welcoming support around 5,577, a rebound higher could be on the table. This support zone includes local descending support, extended from the high of 5,669, and a channel resistance-turned-support line, taken from the high of 4,119.

US500 Is Bullish! Buy!
Here is our detailed technical review for US500.
Time Frame: 1D
Current Trend: Bullish
Sentiment: Oversold (based on 7-period RSI)
Forecast: Bullish
The market is approaching a significant support area 5,568.9.
The underlined horizontal cluster clearly indicates a highly probable bullish movement with target 5,791.3 level.
P.S
Overbought describes a period of time where there has been a significant and consistent upward move in price over a period of time without much pullback.
Disclosure: I am part of Trade Nation's Influencer program and receive a monthly fee for using their TradingView charts in my analysis.
Like and subscribe and comment my ideas if you enjoy them!

Bullish S&P500I expect another rally after a correction in stock market for the last month of the year as Santa rally!

Trading Psychology or Technical Analysis—When Mind Meets MatterThere’s an age-old battle in trading that makes the bull vs. bear debate look like a game of pickleball (no offense, finance bros). It’s the clash between the traders who swear by their charts and the ones who insist it’s all about mindset.
The technicals versus the psychologicals. Fibonacci retracements versus fear and greed. RSI versus your racing heart.
TLDR? Both matter—a lot. But knowing when to trust your indicators, when to trust yourself, and when to blend both is the fine line that separates those who thrive from those who rage-quit.
⚔️ The Cold, Hard Numbers vs. the Soft, Messy Brain
Think of technical analysis as your sometimes inaccurate GPS in trading. It’s structured, predictable, and gives you clear entry and exit points—until it doesn’t. Because markets, much like a GPS in a tunnel, don’t always cooperate.
That’s where psychology creeps in. Your mind is the ultimate trading algorithm, but it’s often running outdated software. Fear of missing out? That’s just your brain throwing a tantrum. Revenge trading? A glitch in emotional processing. Overconfidence after three wins in a row? Well done, you genius.
Technical analysis gives you signals, but trading psychology determines how you act on them.
🤷♂️ When the Chart Says One Thing, and Your Brain Says Another
Picture this: You’ve mapped out the perfect setup. The moving averages align, volume confirms the breakout, and everything screams BUY .
But then your brain whispers, What if it reverses? What if this is a trap? What if I’m about to donate my account balance to the market gods?
You hesitate. The price moves without you. Now, frustration kicks in, and suddenly, you’re clicking BUY at the worst possible moment—just in time for a pullback.
Sometimes, the best trade is the one you don’t take. And sometimes, trusting the chart over your overthinking brain is the only way forward.
🔥 The Big Guys and Their Choices
Legendary investors have picked their sides in this debate. Howard Marks, the co-founder of Oaktree Capital, has long been a big believer in market psychology. He argues that understanding investor sentiment is more valuable than any chart pattern because markets are driven by cycles of greed and fear.
On the other hand, Paul Tudor Jones—one of the greatest traders of all time—leans on technicals, famously saying, “The whole trick in investing is: ‘How do I keep from losing everything?’ If you use the 200-day moving average rule, you get out. You play defense.”
Both approaches work. The question is: Are you the type who deciphers market mood swings, or do you trust that a well-placed moving average will tell you when to cut and run?
🌀 Overtrading: The Technical Trap and the Psychological Spiral
Overtrading usually starts with a good trade, a small win, and a rush of dopamine that convinces you you’ve cracked the code. So, you take another trade. Then another. And before you know it, you’re firing off entries like a caffeinated gamer, except your PnL is the one taking the damage.
Technical traders fall into this trap because they see too many setups. Every candlestick pattern, every little bounce, every “potential” breakout becomes a reason to trade.
Psychological traders, on the other hand, may overtrade out of boredom, frustration, or the need to “make back” losses.
The result? An emotional rollercoaster that ends with an account balance you don’t want to check the next morning.
The fix? Trade selectively. The best setups don’t come every five minutes, and forcing trades is like forcing a bad joke—it just doesn’t land.
💪 Fear, Greed, and the Art of Holding Your Ground
Every trader knows the feeling: You’re in profit, but instead of letting the trade play out, you close early because profit is profit, right?
Wrong.
Fear of losing profits is what keeps traders from maximizing their wins. And greed—the evil twin of fear—is what makes traders hold losing trades, hoping for a miracle. It’s the classic “let winners run, cut losers short” rule in reverse.
Technical traders know where their stops and targets are. The problem? They often ignore them when emotions take over. Psychological traders “feel” the market but get crushed when that gut feeling betrays them.
The best traders find the balance—using technicals to set logical targets and psychology to actually stick to the plan.
🤝 The Solution? A System That Checks Both Boxes
So, what’s the verdict? Do you put matter over mind or mind over matter?
The truth is, great traders do both. They develop strategies based on technicals but manage execution with discipline. They respect risk management rules not just because the chart says so, but because they know how destructive emotions can be.
Here’s what the best do differently:
✅ They journal trades —not just the setups but how they felt during the trade.
✅ They stick to a trading plan so they can trust their system over impulse.
✅ They set rules that help them to properly bounce back from losses .
✅ They know the value of knowledge and never stop learning. (We’ve got you covered here, too. Go check the Top Trading Books if you’re a trader and stop by the Top Books on Investing if you’re an investor).
💚 Final Thoughts: Mind and Market in Harmony
In the end, trading is never just one or the other. It’s not pure math, and it’s not pure mindset. It’s a dance between structure and instinct, strategy and psychology. The ones who get it right aren’t just great at reading charts—they’re great at reading themselves.
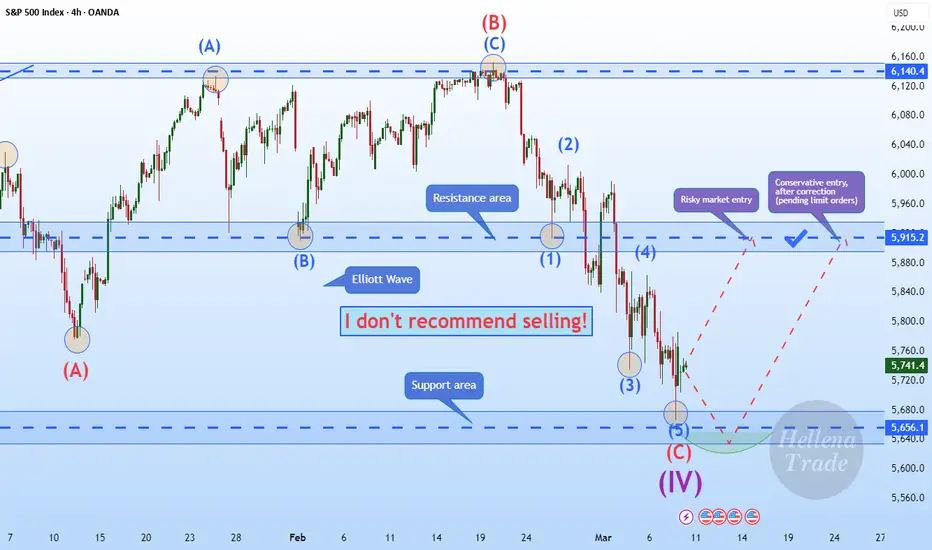
Hellena | SPX500 (4H): LONG to resistance area of 5915.Colleagues, I was waiting for the price to reach the support area of 5656, because the big corrective wave “IV” should end soon.
I am still looking for a long entry point. I expect that wave “IV” has either ended or will soon end its downward movement in the 5656 area and we will see the beginning of an upward wave.
I expect that the first target is the resistance area of 5915.
Manage your capital correctly and competently! Only enter trades based on reliable patterns!
S&P 500 SPX 500Introduction
The S&P 500 is a stock market index that tracks the performance of 500 of the largest publicly traded companies in the United States, serving as a broad gauge of the U.S. stock markert.
Current atmosphere
There is alot of noise in the market about tarrifs and vengeful tarrifs, thats the fundamental part of it, technically i have analysised and put the 2-3 zones that are potential to trade.

Understanding Trump: chapter 3 - WAR and Waste of Defense BudgetWAR and Waste of Defense Budget
The United States operates more than 750 military bases worldwide and spends $886 billion annually on defense. It is the world's largest military spender.
Over the past 50 years, the U.S. has engaged in numerous wars around the world, pouring an enormous amount of money into conflicts. War is not just a military operation; it requires an overwhelming amount of financial resources.
Looking at history, the biggest reason for the downfall of past empires was territorial expansion, endless wars, and the increasing cost of warfare.
The Roman Empire, Spain, and Britain all followed the same pattern. They continuously fought wars, drained their national resources, and eventually collapsed.
When looking at America's recent wars, it seems to be heading in a similar direction.
U.S. War Spending Over the Last 50 Years
Gulf War (1990–1991): $61 billion
Somalia Civil War Intervention (1992–1994): $1.4 billion
Bosnian War Intervention (1995): $3 billion
Kosovo War Intervention (1999): $5 billion
Afghanistan War (2001–2021): $2.3 trillion
Iraq War (2003–2011): $1.9 trillion
Libya Military Intervention (2011): $1 billion
Syria Civil War Intervention (2014–present): $54 billion
Yemen Civil War Support (2015–present): $5 billion
Ukraine War Support (2022–present): $113 billion (as of 2024)
This is all the money the U.S. has spent on wars in recent years.
Considering that the Soviet Union collapsed after just one war in Afghanistan, it's quite remarkable that the U.S. has been able to engage in multiple wars and still sustain itself.
In the past, the U.S. was considered the world's police force. However, when looking at the wars listed above, not many of them resulted in positive outcomes.
Of course, if the U.S. had not actively intervened, there would have been far more ethnic conflicts, ideological wars, and massacres around the world.
In fact, the free trade system that emerged after World War II was only possible because of U.S. naval dominance.
Just like how we take the air we breathe for granted, if the U.S. had not been a dominant global power, international trade would have faced numerous problems and economic inefficiencies.
However, over the past 50 years, has the U.S's war campaigns wasn't successfully
Looking at wars like Vietnam, Afghanistan, and Iraq, the U.S. spent enormous amounts of money, but the results were far from satisfactory.
They justified these wars by claiming to spread democracy and overthrow dictatorships, yet despite the sacrifices of many American soldiers, the post-war situations in these countries remained chaotic.
What’s Next for the U.S.?
Trump’s main goal seems to be reducing war spending.
This is an unfortunate news for Ukraine, but for the U.S., it is a strategic move to prevent itself from collapsing like Britain or the Roman Empire due to excessive military spending.
From my perspective, Trump is not aiming to not really reduce U.S. military presence around the world, but rather to maintain influence while making other countries pay more.
And eventually, the U.S. may choose not to engage in future wars.
His push for increased defense spending from NATO and Asian allies is part of this strategy.

SPX to dump 30% - 50% for Inflated Expectations in 2026I like to say the narrative follows the price . This was bound to happen after such an overheated year, couple years. Blame whomever you want, in the end its your wallet if you aren't ready to have your expectations met.
Best case scenario, the breakout of macro is confirmed after the retest (blue arrows). Worst, more likely case, it smashes down to confirm a double bottom with a strong foundation to form a macro support. The sawtooth can provide opportunities for volatile scalps, but its gonna get gnarly I can already tell.

Post market wrap after a strange dayThoughts about what might be next. We could have one more down, let's see how it plays out. Today's upmove was weak and couldn't confirm a rally.

S&P500 I see a retracement happening due to Trump's political influence, but in the long run, the S&P 500 is set to perform well. We’re in an expansion market, and the momentum is still strong. 🚀

Is 5,400 Points the Bottom for the S&P 500? Key Levels You Need The S&P 500 Index has been experiencing a sharp downturn, heavily influenced by broader macroeconomic factors such as President Trump’s tariff policies. This has had a ripple effect across risk assets, including the cryptocurrency market, which has been closely correlated with traditional markets. In this update, we analyze whether 5400 points could serve as a key bottoming level for the S&P 500 and what that means for broader market conditions.
Technical Points to Consider:
5400 as a Key Support Zone – The index is approaching a major technical confluence zone, which includes a 0.618 Fibonacci retracement, a VWAP SR level from the October 2023 lows, and an open swing low. These factors suggest an oversold bounce may be imminent.
Market Structure Breakdown – The S&P 500 has shifted from higher highs and higher lows to now potentially forming a lower low. A relief rally could lead to a lower high before continuation downward.
Impact on Crypto Markets – If a short-term bottom forms in equities, we could see a correlated bounce in the cryptocurrency market, offering long trade opportunities in altcoins.
The extreme oversold conditions in the market suggest that a relief bounce is highly probable. Markets often react to key technical levels, and the presence of multiple confluence factors at 5400 makes it a critical zone to watch. While a temporary bounce is expected, it is essential to consider whether this move will lead to a sustained recovery or merely a short-lived retracement before further downside. The structure of the bounce, volume inflows, and broader market sentiment will be key factors in determining the next trend.
For cryptocurrency traders, the correlation between the S&P 500 and Bitcoin means that any shift in equities could impact crypto price action. If the S&P 500 finds support and initiates a bounce, risk-on assets like altcoins may also experience relief rallies. However, these moves must be evaluated carefully—altcoins are often more volatile than equities, and chasing a bounce without confirmation could lead to unnecessary risk exposure. Identifying the right setups in this environment requires patience and a strategic approach.
Ultimately, market timing and discipline will be crucial in navigating this potential bottoming process. If 5400 holds as support and a bullish structure begins forming, traders may find strong long opportunities in both traditional markets and crypto. However, if price fails to hold, a continuation lower could present an entirely new set of trading conditions. Waiting for market alignment, confirmed reversals, and volume support will be key before taking decisive action.

BUY SIGNAL into spiral turn 3/10 to 3/13 panic cycle see dec 8thThe Market has fallen right into the cycle the Panic cycle see dec 8th forecast for 2025 . put/call and most every model is set for a min 3 week sharp rally that rally if it is a 3 wave rally then the cycle degree wave 5 of 3 is ended .. BUT I see the decline into the dates and near the call for 9.8 to 11.3 % decline and worst case as stated in the forecast is 16.3 But the cycles is VERY BULLISH from this week On . I am 125 % longs in dec 2026 in the money and at the money calls . best of trades WAVETIMER

Clear Elliot Wave on SPX - Currently retracing in Wave 3Here you can see we are currently in subwave 2 of wave 3. After this retracement of either 0.236 or 0.50, we will see some of the highest volumes and buying pressure's in recent history.

Don't Miss Out We Predicted S&P 500 Drop to 5740 It Happened📉 Don't Miss Out – We Predicted S&P 500 Drop to 5740 , and It Happened! 🔥
In our previous recommendation, we clearly stated that S&P 500 would drop to 5740 , and it happened exactly as predicted, reaching the 61% Fibonacci level! ✅
🚨 Will You Wait Until You Fall with Losing Stocks? 🚨
The market doesn’t wait, and opportunities don’t last forever! If you’ve been following our recommendations, you’ve avoided the collapsing stocks we warned about.
⚠️ Don’t let the market get ahead of you – Follow our recommendations to stay on the winning side! 🔥💰
#SPX500 #Trading #TechnicalAnalysis #InvestmentOpportunities

US500 long setupBear move seems to be exhausted, downside move limited, looks like ready for a bounce and retest of 200MA from other side.
