Bitcoin is correlated to the stock market.Bitcoin is correlated to the stock market.
What do you think is most likely gonna happen once we get a Dotcom or GFC type of bust?
Narratives and storylines change, the chart analysis remains the same.
SP500 trade ideas

S&P 500: The Indicator to Watch Right NowWith US stocks bouncing on Trump’s backtracking over tariffs — just weeks after a 20% correction — it’s fair to say caution is the name of the game. Even though the headline risk has eased slightly, markets are still navigating through a fog of geopolitical noise and economic uncertainty.
In moments like these, where the fundamental picture feels muddy at best, objective technical analysis can offer clarity — not crystal-ball predictions, but structure and focus.
The Traditional Technical Backdrop
Traditional technical analysis isn’t about magic lines on a chart — it’s about mapping out price behaviour with tools that help us stay grounded. Structural levels, trendlines, and a couple of moving averages might seem basic, but they’ve stood the test of time because they do something incredibly useful: they make sense of chaos.
In the case of the S&P 500, several key structural levels should anchor any serious analysis. We’ve got the pre-sell-off highs from February, the April lows, and two interim levels — broken support levels that flipped to resistance during retracement rallies between February and April. These levels now act like milestones in the market’s memory.
Drawing a downward-sloping trendline through the swing highs during the correction gives us a good sense of the broader downtrend. More recently, we’ve also started to see a modest uptrend emerge from the April lows. That creates something of a wedge formation — a narrowing range that’s coiling tighter as buyers and sellers battle it out.
Simple moving averages like the 50-day and 200-day are useful additions here. While they’re lagging by nature, they give us immediate context for where price sits in relation to recent momentum and long-term sentiment.
US500 Daily Candle Chart
Past performance is not a reliable indicator of future results
The Indicator to Watch
There’s a good argument to be made that the most important indicator to watch right now, with the S&P 500 trying to claw back ground, isn’t a moving average or RSI — it’s Anchored VWAP.
Anchored Volume-Weighted Average Price (VWAP) is one of the most effective ways to cut through the noise and see who’s really in control — buyers or sellers. It tells you the average price that traders have paid for the index, weighted by volume, since a specific event or turning point. And unlike regular VWAP that resets daily, Anchored VWAP lets us choose a significant date and track how price interacts with that “anchor.”
If we anchor the VWAP to the February highs, we’re essentially tracking how the market has performed relative to that peak. This anchored VWAP line becomes a kind of gravity — it reflects the average cost basis of those who bought just before the sell-off. If price remains below it, it tells us those buyers are still underwater, and therefore less likely to add risk. Sellers, in that case, still hold the advantage.
On the flip side, if we anchor VWAP to the April lows, we get the average cost basis of the recent bounce. This line reflects where more optimistic, bottom-fishing buyers stepped in. If price holds above this level, it suggests those participants remain in profit — and potentially willing to buy dips.
Right now, the S&P 500 is stuck in a battle between these two anchored VWAP levels. One tracks the pain, the other tracks the hope. It’s a VWAP funnel, and it won’t last forever. Eventually, price will break above one and leave the other behind — and when it does, we’ll have an objective answer as to which side is winning.
Will it be the late bears holding on from February’s highs, or the early bulls from the April lows? The answer is coming. Keep your eyes on the anchored VWAPs — they’re telling the real story.
US500 Daily Candle Chart
Past performance is not a reliable indicator of future results
Disclaimer: This is for information and learning purposes only. The information provided does not constitute investment advice nor take into account the individual financial circumstances or objectives of any investor. Any information that may be provided relating to past performance is not a reliable indicator of future results or performance. Social media channels are not relevant for UK residents.
Spread bets and CFDs are complex instruments and come with a high risk of losing money rapidly due to leverage. 83% of retail investor accounts lose money when trading spread bets and CFDs with this provider. You should consider whether you understand how spread bets and CFDs work and whether you can afford to take the high risk of losing your money.

SPX500: Short Setup Brewing!SPX500 is currently consolidating above the key volume node at 5,480.85, showing resilience after a sharp pullback last week. Price action remains inside a rising channel, but the steeper trendline has been broken, hinting at possible loss of momentum.
🔹 Key Observations:
Price is testing the lower trendline support—a breakdown here could trigger a move toward 5,400.
Volume profile shows heavy interest at 5,480, with a potential volume gap below that could accelerate downside.
VWAP support is intact for now, supporting a neutral-to-bullish bias.
A breakout above 5,530 would confirm bullish continuation and likely test 5,560+.
📈 Bias: Neutral to Bullish
📉 Breakdown Trigger: Below 5,480
📊 Probability Estimates:
Bullish breakout: 55%
Bearish breakdown: 45%
Watching closely for resolution at this inflection point. Patience until direction confirms.
💬 What’s your bias—bulls or bears?
#SPX500 #ES1 #S&P500 #VolumeProfile #TechnicalAnalysis #FOMC #VWAP #TrendlineBreak

US500 - Will the stock market go up?!The index is located between the EMA200 and EMA50 on the four-hour timeframe and is trading in its descending channel. If the index moves down towards the specified demand zone, we can look for the next Nasdaq buying positions with an appropriate risk-reward ratio. The channel breakdown and the index entering the supply zone will provide us with its next selling position.
The chief economist at Citigroup has stated that the imposition of tariffs in the United States constitutes a stagflationary shock to the economy. According to his estimates, there is a 40% to 45% chance of a recession. It is expected that GDP will increase in the second quarter, as consumers rush to make purchases ahead of the new tariffs. However, the most significant negative impact on U.S. economic growth is projected to unfold in the second half of the year.
You may have noticed that recent economic statistics are no longer moving markets. The reason is simple: markets are forward-looking and trade on expectations rather than past data. Economic figures reflect what has already occurred, while market pricing focuses on what lies ahead.
At this stage, current data has yet to fully reflect the impact of tariffs and trade tensions. Even if weaker numbers emerge, markets may have already priced in the potential resolution of the trade war and an eventual recovery.
Experienced traders understand that today’s developments are already factored into prices. What matters now is the outlook for the coming months—the real driver of market direction.
Ryan Petersen of Flexport noted yesterday that, three weeks after the U.S.imposed heavy tariffs on Chinese imports, bookings for ocean freight containers have dropped more than 60% industry-wide. He explained that the U.S. imports around $600 billion worth of goods annually from China, with those items valued at approximately $2 trillion at the retail level.
He stated that the first ships carrying goods fully subject to the new tariffs arrived on Monday, and shipping volumes are expected to decline in the coming weeks. However, due to high inventory levels, the impact on the retail sector may be delayed.
Petersen also expressed concern that a potential rollback of tariffs could introduce a new set of challenges. With ships currently being repositioned globally, a sudden wave of new orders could disrupt logistics networks—especially if markets perceive the suspension of tariffs as only temporary.
In my view, no one really knows how this situation will evolve, as a large portion of imports consists of intermediate goods and components used in final products. My guess is that this could lead to a surge in transshipment and even smuggling, though it could just as easily echo the unexpected consequences seen during the COVID era. We are truly venturing into uncharted territory.
Petersen concludes: “This is a strange era for global logistics, as we must simultaneously prepare for the unimaginable—like full U.S. self-sufficiency—while also planning for a return to something closer to normal trade relations.”

sp500A strong entry of buyers into the area. We will wait for it to return to the area we specified. Therefore, we are waiting for the price to come to an area, but if it does not come, we are not surprised because we expected a rise without a correction.

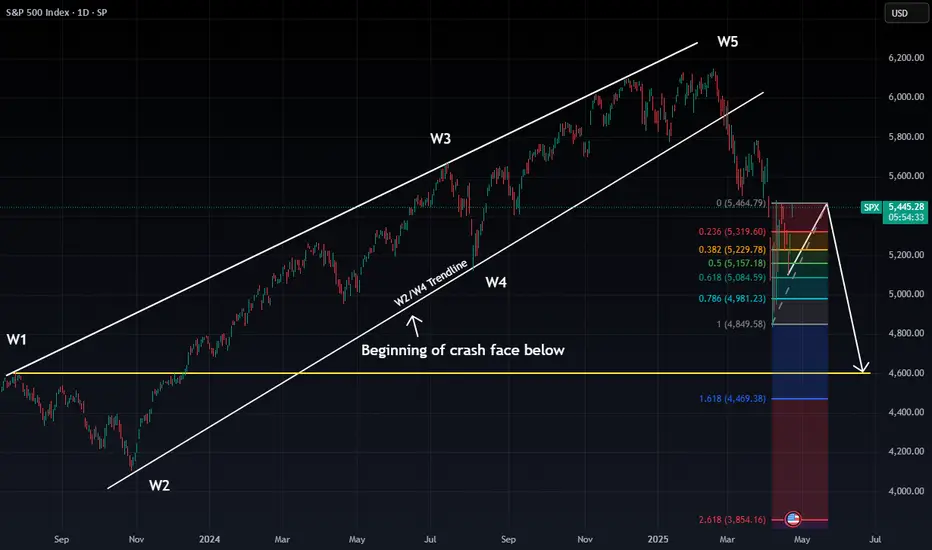
PIVOTAL DAY AHEAD FOR $SPX: Will We Reclaim the Highs or Begin tTechnical Breakdown: We’re at a critical junction for the S&P 500. After completing a 5-wave structure, SP:SPX is teetering near a decision point. Two potential paths are now unfolding:
Bullish Scenario (🟢):
A daily close above 5386 would invalidate the current bear thesis.
This opens the door to a push toward the 90–100% Fib retracement zone (5685–5750).
Short-term traders may look to ride the momentum if 5485 is broken cleanly.
Bearish Scenario (🔴):
A rejection at current levels, coupled with a close below 5386 and a gap-fill back down, confirms the bearish triangle setup.
If this plays out, we’re targeting a drop to the 4600–4400 range based on the 1.618 and 2.618 Fibonacci extensions and broken trendline dynamics.
This aligns with the Elliott Wave breakdown (W5 peak, now in corrective ABC structure).
🧩 Macro Context:
High inflows to safe havens like gold suggest rising fear.
Volatility is elevated, and liquidity is thinning post-earnings season.
💥 Conclusion: Tomorrow’s close is not just another candle – it’s a potential macro trigger. Either we confirm a final leg higher in this cycle, or the bearish wave unfolds in full.
⏳ Watch 5386 closely.
S&P 500 Rips Into Resistance- Bulls on NoticeThe S&P 500 has rallied more than 15.6% off the lows with the bull now testing confluent resistance at 5531/43 - a region defined by the 78.6% retracement of the monthly range and the April high-day close. Note that a three-point resistance slope converges on this threshold and the immediate advance may be vulnerable while below.
Initial support rests with the 4/22 reversal close at 5285 - losses below this threshold would threaten another bout of selling towards the yearly low-day close (LDC) near 5061 .
A topside breach / close above this hurdle exposes the monthly open at 5600 and the 61.8% retracement of the decline off the record highs at 5634 - look for a larger reaction there IF reached.
Bottom line : The index is testing resistance here- losses would need to be limited to 5285 IF price is heading higher on this stretch with a close above 5434 needed to clear the way for the next leg of the advance.
-MB

US500 - Long-Term Long!Hello TradingView Family / Fellow Traders. This is Richard, also known as theSignalyst.
📈US500 has been overall bullish trading within the rising channel marked in blue.
Moreover, it is retesting its previous all-time high at $4,800 and round number $5,000.
🏹 Thus, the highlighted blue circle is a strong area to look for buy setups as it is the intersection of previous ATH and lower blue trendline acting as a non-horizontal support.
📚 As per my trading style:
As #US500 approaches the blue circle zone, I will be looking for bullish reversal setups (like a double bottom pattern, trendline break , and so on...)
📚 Always follow your trading plan regarding entry, risk management, and trade management.
Good luck!
All Strategies Are Good; If Managed Properly!
~Rich
Disclosure: I am part of Trade Nation's Influencer program and receive a monthly fee for using their TradingView charts in my analysis.

The SPX Sell Off at 5500Hi all,
It has been a while since we posted as we waited for a really good trade setup. The SPX is hovering at 5500 and we believe it is the right level to sell.
1) There is a shark pattern at this level
2) RSI is overbought on every time frame except H4 and D1
3) There are smaller patterns to sell
4) There is very strong structural resistance at 5510 to 5520
The first target will be 5306 which has a great risk to reward of 1:5.
We will wait for M15 divergence and a trend line break to enter.

SPX500 (4H) LONG POSITIONGreeting there traders this is my idea on SP500 and it is Long.
We can clearly see a recovery from the “Support Area” (yellow zone), after a wave formation (probably a completed Elliott Wave correction).
You are currently in a very impulsive uptrend.
Momentum looks strong, with no major retracements — meaning that buyers would currently be in a dominating position.
Key Levels
Support Level (red): 5.019 – 5.091
This is the “ultima ratio” zone where the price made a strong rebound.
Softer Support: 5.276 – 5.282 (where you are now)
This is the zone of possible correction, as you marked.
Resistance/Target: 6.150 – 6.156
If the current trend holds and there is no major retracement below 5,250, it is very likely that we will test the 6,000–6,150 level in the coming days.
The price is currently in a “blast-off” phase — if volume remains strong, you can hit the TP as early as late April or early May.
I predict that we have started an uptrend towards a new ATH. I believe that the market will start to "fly" already on Monday or Tuesday. Possible catalysts: Trump strikes a deal with China, announces a pause in the trade war, or Powell responds with an emergency rate cut.
My goal is mid $6,000 to low $7,000 by July 4th (maybe sooner). After that I expect a 60-70% drop.

SPX bullishI am now bullish in near term. For those following me, I have updated HILO EMA squeeze band with an option to plot more lines as seen this chart. I see a swing high of 5770, although a bit cautious about the month end. Market is tired of Trump tantrums and more focused on earnings which have been great so far. For near term month or two I would be looking for bye the dip

US500 Will Go Down From Resistance! Short!
Take a look at our analysis for US500.
Time Frame: 9h
Current Trend: Bearish
Sentiment: Overbought (based on 7-period RSI)
Forecast: Bearish
The market is on a crucial zone of supply 5,525.49.
The above-mentioned technicals clearly indicate the dominance of sellers on the market. I recommend shorting the instrument, aiming at 5,306.14 level.
P.S
We determine oversold/overbought condition with RSI indicator.
When it drops below 30 - the market is considered to be oversold.
When it bounces above 70 - the market is considered to be overbought.
Disclosure: I am part of Trade Nation's Influencer program and receive a monthly fee for using their TradingView charts in my analysis.
Like and subscribe and comment my ideas if you enjoy them!

S&P 500: Key Levels and Potential ScenariosThis analysis of S&P500 will explore both bullish and bearish scenarios, incorporating key levels and considering possible market and crowd psychology.
Bullish Scenario: Potential Uptrend Resumption
From a bullish perspective, if the S&P 500 maintains a position above the 5482 level, it could suggest a potential end to the current correction and a resumption of the major uptrend. A hold above 5482 might reinforce bullish sentiment, encouraging further buying activity, as traders may view this as confirmation of renewed strength. The index could then potentially retest the 5801 level, where it's possible that the index may encounter resistance on the first attempt. A successful break above 5801 would then open the path towards the 6135 zone, which represents a key upside target.
Bearish Scenario: Potential Retest of Support Zones
Conversely, if the S&P 500 fails to hold above the 5482 support level might trigger increased selling pressure, as traders liquidate positions. The index could then potentially retest the 5092 to 4833 support zone. This zone represents a critical area where buyers may step in, but a break below it would signal further weakness.
Concluding Remarks
In conclusion, the S&P 500's price action around the identified key levels will be crucial in determining its short- to medium-term direction. A sustained hold above 5482 could favor a bullish continuation towards 5801 and potentially 6135, while a break below 5482 might lead to a retest of the 5092 to 4833 support zone.

S&P 500 Daily Chart Analysis For Week of April 25, 2025Technical Analysis and Outlook:
In this week's trading session, the Index did steady to higher prices, distancing itself from the rendered obsolete Mean Resistance level of 5455 and targeting the next significant mark identified as Outer Index Rally 5550. This trend lays the groundwork for a continued upward movement; however, there is also a considerable risk of a sharp pullback to the Mean Support level of 5370 after reaching the Outer Index Rally at 5550.
Contrariwise, it is essential to acknowledge the possibility of upward momentum continuation resulting in meeting the primary target Outer Index Rally 5550 by challenging the Mean Resistance of 5672 and extending toward additional levels: Mean Resistance 5778 and Outer Index Rally 5945.

S&P500 INTRADAY resistance at 5510Earnings season heats up with major companies like Visa, Coca-Cola, Starbucks, UPS, and Pfizer reporting results. In Europe, HSBC announced a $3 billion share buyback, while BP shares dropped due to weaker cash flow.
In Canada, the Liberal Party is set to win a fourth term, but likely without a majority, which could lead to a coalition-style government.
Meanwhile, the Trump administration plans to ease auto tariffs on foreign parts used in U.S.-made vehicles, boosting Ford and GM shares in premarket trading.
Market Impact:
Watch for shifts in trade-sensitive sectors, supply chain plays (especially in tech), and defense stocks as geopolitical risk evolves.
Key Support and Resistance Levels
Resistance Level 1: 5670
Resistance Level 2: 5740
Resistance Level 3: 5820
Support Level 1: 5380
Support Level 2: 5310
Support Level 3: 5236
This communication is for informational purposes only and should not be viewed as any form of recommendation as to a particular course of action or as investment advice. It is not intended as an offer or solicitation for the purchase or sale of any financial instrument or as an official confirmation of any transaction. Opinions, estimates and assumptions expressed herein are made as of the date of this communication and are subject to change without notice. This communication has been prepared based upon information, including market prices, data and other information, believed to be reliable; however, Trade Nation does not warrant its completeness or accuracy. All market prices and market data contained in or attached to this communication are indicative and subject to change without notice.

SP500 H4 IdeaPotential for a bullish pullback on the SP500 H4 which could lead to a price movement towards the resistance level at 5620. BUY levels from 5500

S&P 500 Intra-day Analysis 25-Apr 2025The markets currently are showing some relief after China's decision to exempt certain U.S. goods from tariffs.
Potential scenarios for intra-day moves:
• Price recently touched the lower end of the range around $5,520 and then moved up. If this upward move continues, it could test the top of the range near $5,550. If that level is passed, the next area to keep an eye on might be around $5,660.
• If the price drops below $5,500, it could mean sellers are gaining strength, and the next level to watch could be around $5,360.
• If the price also goes below $5,320, then the $5,200 level might become the next important zone to monitor.
Disclaimer: easyMarkets Account on TradingView allows you to combine easyMarkets industry leading conditions, regulated trading and tight fixed spreads with TradingView's powerful social network for traders, advanced charting and analytics. Access no slippage on limit orders, tight fixed spreads, negative balance protection, no hidden fees or commission, and seamless integration.
Any opinions, news, research, analyses, prices, other information, or links to third-party sites contained on this website are provided on an "as-is" basis, are intended only to be informative, is not an advice nor a recommendation, nor research, or a record of our trading prices, or an offer of, or solicitation for a transaction in any financial instrument and thus should not be treated as such. The information provided does not involve any specific investment objectives, financial situation and needs of any specific person who may receive it. Please be aware, that past performance is not a reliable indicator of future performance and/or results. Past Performance or Forward-looking scenarios based upon the reasonable beliefs of the third-party provider are not a guarantee of future performance. Actual results may differ materially from those anticipated in forward-looking or past performance statements. easyMarkets makes no representation or warranty and assumes no liability as to the accuracy or completeness of the information provided, nor any loss arising from any investment based on a recommendation, forecast or any information supplied by any third-party.

Stromm | S&P 500 & NASDAQ a RESISTANCE is NearThe S&P 500 and the Nasdaq are basically moving in lockstep right now — their structures look almost identical.
Starting with the S&P 500:
We’re currently trading into a 4-hour Fair Value Gap between $5,546 and $5,634, Sitting just under a 4-hour Order Block that could trigger a short-term reaction.
At the moment, though, it doesn’t really look like we’re going to flush all the way back down toward the $5,000 level (2-hour Order Block sitting much lower).
More likely?
This 4h Order Block just gives us a brief pullback, a minor reaction — and then price pushes higher again.
This would line up perfectly with my original scenario of Wave A completing around $4,805.
Personally, I’m already positioned around $4,800, so obviously, I'd love to see that level hold and price continue moving higher — ideally heading toward $6,000.
That would be the perfect extension — but nothing is guaranteed yet.
Still, structure right now leans bullish unless we see a sudden breakdown.
Now, for the Nasdaq CME_MINI:NQ1! :
Almost the same setup —
We have a 2-hour Order Block just above the current price, acting as short-term resistance,
And another 2-hour Order Block way lower, which now seems less likely to be tested unless something drastic happens.
So for the Nasdaq, the most realistic short-term scenario:
Hit resistance at the current 2h Order Block,
Maybe a small pullback toward 18,900–19,000,
Then continuation higher toward 20,000 or even 21,000 over the next few weeks.

SPX500 I Bearish Drop Based on the H4 chart analysis, we can see that the price has just reacted off our sell entry at 5522,70, which is an overlap resistance.
Our take profit will be at 5371.29, an overlap support level.
The stop loss will be placed at 5685.38, which is an overlap resistance level.
High Risk Investment Warning
Trading Forex/CFDs on margin carries a high level of risk and may not be suitable for all investors. Leverage can work against you.
Stratos Markets Limited (tradu.com):
CFDs are complex instruments and come with a high risk of losing money rapidly due to leverage. 63% of retail investor accounts lose money when trading CFDs with this provider. You should consider whether you understand how CFDs work and whether you can afford to take the high risk of losing your money.
Stratos Europe Ltd (tradu.com):
CFDs are complex instruments and come with a high risk of losing money rapidly due to leverage. 63% of retail investor accounts lose money when trading CFDs with this provider. You should consider whether you understand how CFDs work and whether you can afford to take the high risk of losing your money.
Stratos Global LLC (tradu.com):
Losses can exceed deposits.
Please be advised that the information presented on TradingView is provided to Tradu (‘Company’, ‘we’) by a third-party provider (‘TFA Global Pte Ltd’). Please be reminded that you are solely responsible for the trading decisions on your account. There is a very high degree of risk involved in trading. Any information and/or content is intended entirely for research, educational and informational purposes only and does not constitute investment or consultation advice or investment strategy. The information is not tailored to the investment needs of any specific person and therefore does not involve a consideration of any of the investment objectives, financial situation or needs of any viewer that may receive it. Kindly also note that past performance is not a reliable indicator of future results. Actual results may differ materially from those anticipated in forward-looking or past performance statements. We assume no liability as to the accuracy or completeness of any of the information and/or content provided herein and the Company cannot be held responsible for any omission, mistake nor for any loss or damage including without limitation to any loss of profit which may arise from reliance on any information supplied by TFA Global Pte Ltd.
The speaker(s) is neither an employee, agent nor representative of Tradu and is therefore acting independently. The opinions given are their own, constitute general market commentary, and do not constitute the opinion or advice of Tradu or any form of personal or investment advice. Tradu neither endorses nor guarantees offerings of third-party speakers, nor is Tradu responsible for the content, veracity or opinions of third-party speakers, presenters or participants.

Was this the best buying opportunity since 2011?Sure, here's a rewritten version of your text in an engaging tone:
"Have you ever heard of the Zweig Breadth Thrust? Well, let me tell you, it’s an incredible metric that can really shed some light on the current market situation!
So, what would it take for me to believe that this bounce isn't just another bear market rally? My first step would be to dive into the breadth indicators and look for signs of that elusive breadth thrust.
Think of a breadth thrust like a rocket taking off. You need a strong initial boost to break free of gravity's grip. If the thrust is weak, the rocket can’t escape, and the same applies to stock market reversals. When we see a robust breadth thrust, that's a signal that a significant reversal is underway. Without it, we could be facing another false bounce.
Now, let’s talk numbers! As of Friday, April 25th, the SPX has surged an impressive 14.2% from its recent lows, and while that’s quite a leap, it’s essential to keep it in perspective. Just think back—this index was down 21.35% from its all-time high earlier in February during the panic sell-off. Now, with the recent strength, it’s only 10.75% off its peak.
The Zweig Breadth Thrust is calculated based on the 10-day EMA of NYSE Advances divided by the sum of Advances and Declines. A bullish signal pops up when the ZBT shifts from below 0.40 to above 0.615 within just ten days or less. Keep an eye on that—it might just help us navigate these choppy waters!"
On the monthly chart, it’s clear that what we’ve been seeing in the broader economy (you know, Main Street) is actually showing us some bearish divergence—a concept I've mentioned in my previous ideas.
Since 2009, we've had four notable instances on the Monthly chart where the ZBT dipped below 0.40, only to bounce back up past the 0.6 mark. Remember back in November 2011? That was when we got a significant signal with a low reading of 0.31, which climbed back to 0.62 by February 2013. That surge sparked a bull run that peaked in February 2020!
So, the takeaway here is that this breadth thrust is generating the positive momentum we need to reach new stock market highs this year. Exciting times ahead!

S&P500 INTRADAY resistance at 5510Global Trade & Geopolitics
China may suspend steep tariffs on some U.S. imports, like medical equipment and ethane, to ease pressure on key industries—hinting at a more pragmatic trade stance.
Apple plans to shift most U.S. iPhone production to India by late next year, while Walmart is helping Chinese exporters sell locally—both reflecting efforts to reduce reliance on China.
U.S.-Russia-Ukraine: The U.S. will push for Russia to recognize Ukraine’s right to its own military in any peace deal. However, Trump suggests Ukraine may have to cede some territory. Meanwhile, reduced U.S. aid is increasing Ukraine’s exposure to Russian cyberattacks.
Market Impact:
Watch for shifts in trade-sensitive sectors, supply chain plays (especially in tech), and defense stocks as geopolitical risk evolves.
Key Support and Resistance Levels
Resistance Level 1: 5510
Resistance Level 2: 5660
Resistance Level 3: 5790
Support Level 1: 5110
Support Level 2: 4950
Support Level 3: 4815
This communication is for informational purposes only and should not be viewed as any form of recommendation as to a particular course of action or as investment advice. It is not intended as an offer or solicitation for the purchase or sale of any financial instrument or as an official confirmation of any transaction. Opinions, estimates and assumptions expressed herein are made as of the date of this communication and are subject to change without notice. This communication has been prepared based upon information, including market prices, data and other information, believed to be reliable; however, Trade Nation does not warrant its completeness or accuracy. All market prices and market data contained in or attached to this communication are indicative and subject to change without notice.

"US500/SPX500" Index Market Money Heist Plan (Day / Swing Trade)🌟Hi! Hola! Ola! Bonjour! Hallo! Marhaba!🌟
Dear Money Makers & Robbers, 🤑💰✈️
Based on 🔥Thief Trading style technical and fundamental analysis🔥, here is our master plan to heist the "US500/SPX500" Index Market. Please adhere to the strategy I've outlined in the chart, which emphasizes short entry. Our aim is the high-risk Pink MA Zone. Risky level, oversold market, consolidation, trend reversal, trap at the level where traders and bullish robbers are stronger. 🏆💸"Take profit and treat yourself, traders. You deserve it!💪🏆🎉
Entry 📈 : "The vault is wide open! Swipe the Bearish loot at any price - the heist is on!
however I advise to Place sell limit orders within a 15 or 30 minute timeframe most nearest or swing, low or high level for Pullback Entries.
Stop Loss 🛑:
📌Thief SL placed at the nearest/swing High or Low level Using the 1D timeframe (5500) Day/Swing trade basis.
📌SL is based on your risk of the trade, lot size and how many multiple orders you have to take.
Target 🎯: 4750 (or) Escape Before the Target
💰💵💸"US500/SPX500" Index Market Heist Plan (Swing/Day Trade) is currently experiencing a Bearish trend.., driven by several key factors.👇👇👇
📰🗞️Get & Read the Fundamental, Macro, COT Report, Geopolitical and News Analysis, Sentimental Outlook, Intermarket Analysis, Index-Specific Analysis, Future trend targets with Overall outlook score... go ahead to check 👉👉👉🔗🔗
⚠️Trading Alert : News Releases and Position Management 📰 🗞️ 🚫🚏
As a reminder, news releases can have a significant impact on market prices and volatility. To minimize potential losses and protect your running positions,
we recommend the following:
Avoid taking new trades during news releases
Use trailing stop-loss orders to protect your running positions and lock in profits
💖Supporting our robbery plan 💥Hit the Boost Button💥 will enable us to effortlessly make and steal money 💰💵. Boost the strength of our robbery team. Every day in this market make money with ease by using the Thief Trading Style.🏆💪🤝❤️🎉🚀
I'll see you soon with another heist plan, so stay tuned 🤑🐱👤🤗🤩

Economy - Moving ForwardWhat's expected of the economy?
For 2025, the stock market started strong, the three major U.S. indexes soared to its all-time highs, putting confidence in retail investors.
End of Q1, we've seen a shift in the market due to tariffs and the start of a trade war. Why are the tariffs bad for the U.S. economy?
The biggest problem with tariffs is that it could drive higher prices in consumer goods through "taxes" in imported goods. It also causes disruption in supply chain, slower economic growth, retaliation from foreign countries, etc. The economic data also shows signs of a possible recession.
Not everything is lost.
Asian countries such as Japan, Korea, and Indian are taking in the lead in trade talks with Donald Trump. China has given exemptions to certain U.S. goods in order to ease the trade war, leading to a potential trade talks with the economy giants, the U.S. The 90 day reciprocal tariffs are also an opening for talks.
Let's see how it goes.
