What Is the Advance-Decline (A/D) Line, and How Can You Use ItWhat Is the Advance-Decline (A/D) Line, and How Can You Use It in Trading?
The Advance-Decline (A/D) Line is a widely used market breadth indicator that provides insights into the strength of trends by tracking advancing and declining stocks. Popular among traders analysing indices like the NASDAQ, it helps identify broad participation or hidden divergences. This article explores how this indicator works and its role in effective market analysis.
What Is the Advance-Decline Line?
The Advance-Decline (A/D) line, also known as the Advance-Decline Index, is a popular market breadth indicator used to gauge the overall health of a market's movement. Instead of focusing solely on price changes in an index, it analyses how many stocks are participating in the market's rise or fall. This makes it particularly useful for traders looking to understand whether a trend is supported by widespread participation or driven by just a handful of stocks.
The indicator can be set up based on stocks on different exchanges. For example, a NYSE Advance-Decline line provides insights into NYSE-listed stocks. However, it can be applied to any index or exchange, resulting in the Nasdaq Advance-Decline line or a line based on stocks listed in the UK, Australia, Europe, or Japan.
At its core, the A/D line is a cumulative measure of the net advances of stocks on a given day. The calculation is as follows:
1. Count the number of advancing stocks (those that closed higher than their previous close).
2. Count the number of declining stocks (those that closed lower than their previous close).
3. Subtract the number of declining stocks from the advancing stocks to get the net advance.
4. Add this net advance to the previous day’s A/D line value.
Formally, the Advance-Decline line formula is:
Net Advances = Advancing Stocks − Declining Stocks
Current A/D Line Value = Previous A/D Line Value + Net Advances
For example, if 500 stocks advanced and 300 declined on a given day, the net advance would be +200. If yesterday’s A/D Line value was 10,000, today’s value would be 10,200. Over time, these daily values form a line that tracks the cumulative net advances.
The indicator provides insights into sentiment. A rising line indicates more advancing stocks than declining ones, while a falling line suggests the opposite. Traders often use this data to determine whether a price trend in an index reflects broad strength or is being carried by a few heavyweights.
Understanding Market Breadth
Market breadth measures the extent to which individual assets are contributing to a market's overall movement, providing a clearer picture of the strength or weakness behind trends. Rather than relying solely on an index's price performance, breadth gives traders insights into how widespread participation is within a rally or decline. This information is crucial for understanding whether market moves are broad-based or concentrated in a few influential assets.
A market with a strong breadth typically sees most stocks or assets moving in the same direction as the overall trend. For example, during a rally, broad participation—where a large percentage of assets are advancing—signals a robust and healthy trend. Conversely, weak breadth occurs when only a small group of assets drives the movement, potentially indicating fragility in the trend. This is especially important in large indices where a few heavily weighted assets can mask underlying weaknesses.
How Traders Use the A/D Line
The A/D Line is more than just a market breadth indicator—it’s a practical tool traders use to gain insight into the strength and sustainability of trends. By analysing how the indicator behaves in relation to price movements, traders can uncover potential hidden opportunities and spot potential risks. Let’s consider how the Advance-Decline line behaves on a price chart.
Identifying Trend Strength
One of the A/D Line’s key uses is evaluating the strength of a market move by examining overall participation. When both the A/D Line and an index rise together, it suggests widespread buying activity, with most stocks contributing to the rally. Similarly, if both the index and the A/D Line decline, it often reflects broad-based selling, indicating that weakness is widespread across the market rather than concentrated in a few assets.
Spotting Divergences
Divergences between the A/D line and price are closely watched by traders. For instance, if an index continues to rise but the A/D line starts declining, it could signal that the trend is losing momentum. Conversely, when it begins rising ahead of a price recovery, it may suggest underlying strength before it becomes apparent in price action.
Complementing Other Indicators
Traders often pair the A/D line with other tools to refine their analysis. For example, combining it with moving averages or oscillators like RSI can help confirm signals or highlight discrepancies. A rising A/D line alongside RSI rising above 50 might reinforce the possibility of a price rise.
Strengths of the A/D Line
The A/D line is a widely respected tool for understanding market dynamics, offering insights that price-based analysis alone can’t provide. Its ability to measure participation across a broad range makes it especially valuable for traders looking to assess sentiment and trend reliability. Let’s explore some of its key strengths.
Broad Market Perspective
The A/D line captures the performance of all advancing and declining stocks within an index, offering a comprehensive view of how much support a trend has. Instead of focusing solely on a handful of large caps that often dominate indices, the indicator reveals whether the majority are moving in the same direction. This helps traders gauge the true strength of a rally or decline.
Early Warnings of Weakness or Strength
Divergences between the A/D line and the price can act as an early signal of potential changes in momentum. When the A/D Line deviates from the overall trend, it can highlight areas where market participation is inconsistent. This allows traders to assess whether a trend is gaining or losing support across a broad range of assets, offering clues about potential shifts before they fully materialise in price action.
Applicability Across Markets
Another strength is its versatility. The A/D line can be applied to indices, sectors, or even individual markets, making it useful across various trading strategies. Whether monitoring a broad index like the S&P 500 or a specific sector, the indicator can be adapted to provide valuable insights.
Limitations of the A/D Line
While the A/D line is a useful tool for analysing breadth, it isn’t without its limitations. Traders need to understand its drawbacks to use it effectively and avoid potential misinterpretations. Here are some of the key challenges to consider.
Ignores Stock Weighting
One major limitation is that the A/D index gives equal weight to every stock, regardless of size or market capitalisation. In indices like the S&P 500, where a small number of large-cap stocks often drive performance, this can create a disconnect. For example, a large-cap stock’s strong performance might lift an index while the indicator shows weakness due to low-caps underperforming.
Vulnerability to Noise
The index can produce misleading signals in certain conditions, such as during periods of low trading volume or heightened volatility. Market anomalies, such as large fluctuations in a small number of stocks, can skew the indicator and make it less reliable. This can be especially problematic in thinly traded assets or at times of high speculation.
Not a Standalone Indicator
The A/D line is combined with other tools. On its own, it doesn’t account for factors like momentum, valuation, or sentiment, which can provide critical context. Traders relying solely on it may miss out on key details or overemphasise its signals.
Comparing the A/D Line with Other Market Breadth Indicators
The A/D Line is a powerful tool, but it’s not the only market breadth indicator traders use. By understanding how it compares to other indicators, traders can select the one that suits their analysis needs or combine them for a more comprehensive view.
A/D Line vs Advance-Decline Ratio
The A/D Ratio measures the proportion of advancing to declining stocks. While the A/D line provides a cumulative value over time, the ratio offers a snapshot of market breadth for a single trading day. The A/D Ratio is often better for identifying short-term overbought or oversold conditions, whereas the A/D line excels at tracking long-term trends.
A/D Line vs McClellan Oscillator
The McClellan Oscillator uses the same advancing and declining stock data but applies exponential moving averages to calculate its value. This approach makes the McClellan Oscillator more sensitive to recent market changes, allowing it to highlight turning points more quickly than the A/D line. However, the A/D line’s simplicity and cumulative nature make it more straightforward to interpret for broader trend analysis.
A/D Line vs Percentage of Stocks Above Moving Averages
This indicator tracks the percentage of stocks trading above specific moving averages, such as the 50-day or 200-day. While the A/D line focuses on daily advances and declines, the moving average approach highlights whether stocks are maintaining longer-term momentum. The A/D line provides a broader perspective on participation, whereas this indicator zeros in on sustained trends.
The Bottom Line
The Advance-Decline line is a valuable tool for traders seeking deeper insights into market trends. By analysing market breadth, it helps identify potential opportunities and risks beyond price movements alone.
FAQ
What Is the Meaning of Advance-Decline?
Advance-decline refers to the difference between the number of advancing stocks (those that closed higher) and declining stocks (those that closed lower) on a specific trading day. It’s commonly used in market breadth indicators like the NYSE Advance-Decline line to measure the overall strength or weakness of the market.
How to Find Advance-Decline Ratio?
The Advance-Decline ratio compares advancing stocks to declining stocks in an index. It is calculated by dividing the number of advancing stocks by the number of declining stocks.
How to Use an Advance-Decline Line Indicator?
The A/D line indicator tracks the cumulative difference between advancing and declining stocks. Traders analyse its movement alongside price trends to assess market participation. For example, divergence between the A/D line and an index price direction can signal potential changes in momentum.
What Is the Advance-Decline Indicator Strategy?
Traders use the Advance-Decline indicator to analyse market breadth, identify divergences, and confirm trends. For example, a rising A/D line with an index suggests broad participation, while divergence may signal weakening trends.
This article represents the opinion of the Companies operating under the FXOpen brand only. It is not to be construed as an offer, solicitation, or recommendation with respect to products and services provided by the Companies operating under the FXOpen brand, nor is it to be considered financial advice.
SP500 trade ideas

Potential bearish drop?S&P500 (US500) has reacted off the pivot and could drop to the 1st support.
Pivot: 5,480.90
1st Support: 5,099.50
1st Resistance: 5,778.60
Risk Warning:
Trading Forex and CFDs carries a high level of risk to your capital and you should only trade with money you can afford to lose. Trading Forex and CFDs may not be suitable for all investors, so please ensure that you fully understand the risks involved and seek independent advice if necessary.
Disclaimer:
The above opinions given constitute general market commentary, and do not constitute the opinion or advice of IC Markets or any form of personal or investment advice.
Any opinions, news, research, analyses, prices, other information, or links to third-party sites contained on this website are provided on an "as-is" basis, are intended only to be informative, is not an advice nor a recommendation, nor research, or a record of our trading prices, or an offer of, or solicitation for a transaction in any financial instrument and thus should not be treated as such. The information provided does not involve any specific investment objectives, financial situation and needs of any specific person who may receive it. Please be aware, that past performance is not a reliable indicator of future performance and/or results. Past Performance or Forward-looking scenarios based upon the reasonable beliefs of the third-party provider are not a guarantee of future performance. Actual results may differ materially from those anticipated in forward-looking or past performance statements. IC Markets makes no representation or warranty and assumes no liability as to the accuracy or completeness of the information provided, nor any loss arising from any investment based on a recommendation, forecast or any information supplied by any third-party.

S&P500 Index Intraday Trend Analysis for April 23, 2025Market Timing tool signals Bearish Trend for the day and the Sell Signal got confirmed with Stop Loss @ 5471. Trailing Stop Loss for running sell is at 5394. First Target for the bearish trend is at 5318 and if the market moves down further, it may take support at 5173.
It's my view. Traders are suggested to follow technical analysis for trade entries with proper risk management rules.

S&P 500 | SPX500USD: Bulls Find Support — But Is It Enough?SPX500USD 12H TECHNICAL ANALYSIS 🔍
OVERALL TREND
📈 UPTREND (Tentative) — Market structure appears to be attempting a reversal from a recent pivot low. However, the macro trend remains under pressure unless price clears the key resistance range above 5,950.
📉RESISTANCE
🔴 6,152.5000 — PIVOT HIGH | Dynamic Resistance Level
🔴 6,086.2943 — SELL ORDER II
🔴 5,952.1652 — SELL ORDER I
📊ENTRIES & TARGETS
🎯 5,884.4400 — EXIT BUY | TP 4
🎯 5,640.5683 — BUY ORDER | TP 3
🎯 5,482.3500 — BUY ORDER | TP 2 | Mid-Pivot
🎯 5,254.5432 — BUY ORDER | TP 1
📈SUPPORT
🟢 5,021.6218 — BUY ORDER
🟢 4,879.2150 — BUY ORDER II
🟢 4,812.2000 — PIVOT LOW | Dynamic Support Level
📊OSCILLATOR SUMMARY
🧭 RSI (14): 51.98 — Neutral
📉 MACD Level: -41.34 — Buy Bias Forming
🚀 Momentum (10): -36.21 — Positive Divergence Developing
📊 ADX (14): 21.08 — Early Trend Formation
📉 Awesome Oscillator: -87.21 — Bearish but Flattening
🧮MOVING AVERAGE SUMMARY
✅ 10/20/30 EMA & SMA — All Showing Buy Signals
❌ 50/100/200 EMA & SMA — Still Bearish, Suggesting Long-Term Pressure
📊 VWMA (20): 5,289.90 — Bullish Price Reaction Above VWMA
📏 Ichimoku Base Line: 5,158.19 — Neutral, Needs Further Validation
🤓STRUCTURAL NOTES
Current price is battling between 5,300–5,400 resistance range — a break and close above 5,482 could trigger further upside
Significant bullish reversal candle formed near the last pivot low at 4,812
Volume profile suggests re-accumulation; price attempting to reclaim 5,300 structure
Momentum indicators show signs of shifting bullish, but not yet in strong confirmation territory
TRADE OUTLOOK 🔎
📈 Bullish bias above 5,254 with targets at 5,482 / 5,640 / 5,884
📉 Bearish pressure reactivates if price rejects 5,482 and closes below 5,021
👀 Monitor ADX for trend confirmation — under 25 = caution; above 25 = trend validation
🧪STRATEGY RECOMMENDATION
CONSERVATIVE APPROACH (Reversal Play):
— Entry: 5,254.54
— Targets: 5,482.35 / 5,640.56 / 5,884.44
— SL: Below 5,021.62
HIGH-RISK SCALP (Resistance Fade):
— Sell Order near 5,952.16 or 6,086.29
— Targets: 5,640 / 5,482
— SL: Above 6,152.50
“Discipline | Consistency | PAY-tience™”

Bias is now bullishThe Bias is up but I also discuss the alternative bearish count. Vix is at support here, but it's bias is currently down.

U.S. Bulls Take Charge: S&P 500 Set to Break OutHello,
📊 S&P 500 Market Outlook – Pro-Bullish Perspective
🔥 Market Recap: The S&P 500 recently saw a significant dip, marking a 1-year low at 4805.92, largely attributed to the shockwaves caused by President Trump’s sweeping tariff announcement on April 2. This move sent markets into a tailspin, creating heightened volatility levels not seen since the early pandemic days.
However, savvy traders recognized opportunity amidst the panic and entered strategic buy zones around those lows. Since then, the index has managed to stabilize above key technical levels, signaling potential bullish momentum building from the ground up.
🧭 Current Key Technical Levels to Watch:
1W Pivot Point (PP): ✅ Holding above 5224.13
1D Pivot Point (PP): ⚠️ Testing resistance at 5297.05
1M Strong Support/Resistance: ⛔ Acting as resistance at 5329.31
🚀 Bullish Confirmation Pathway:
To fully confirm a bottom-up bullish reversal, we’re looking for:
✅ Sustained close above the 1D PP @ 5297.05
✅ Break and hold above the 1M Resistance @ 5329.31
✅ Momentum toward the 1Y PP @ 5550.97
If these levels are conquered with conviction, it opens the door for an extended upside move toward 5878.58, aligning with a broader bullish sentiment.
🛑 Cautionary Downside Scenario:
Although currently less likely, a failure to maintain support above the 1W PP @ 5224.13 could reopen downside risk in the short term. We remain watchful of that level as a bull-bear pivot.
🌐 Macro Overview – Tariff Shock & Earnings Spotlight:
Trump’s abrupt tariff move has reshuffled the global economic deck, and investors are still processing its implications.
The S&P 500 is currently down ~14% from its February highs, but showing resilience.
Earnings season is now center stage, with major players like Tesla, Alphabet, IBM, and Boeing under the microscope.
⚠️ Volatility Index (VIX) is down from post-tariff highs (~60) to ~30, still elevated from the long-term median of 17.6, signaling cautious optimism.
💬 CEO Sentiment Matters:
As JJ Kinahan from IG North America noted:
“The view of CEOs going forward has never been more important.”
With traditional guidance uncertain, investors are leaning on transparent, scenario-based outlooks like United Airlines’ “dual roadmap” approach.
🔋 Magnificent Seven on Watch:
Alphabet: -20% YTD
Tesla: -40% YTD
These leaders are key sentiment barometers. If they bounce, the broader market is likely to follow.
🏛️ Fed & Trump Tensions:
Trump recently stated that Fed Chair Jerome Powell’s termination “cannot come fast enough,” pushing for rate cuts.
Powell, however, remains cautious, citing the need for more economic data before acting.
✍️ Final Note – A Cooling Tariff War?
💬 According to Trump’s latest statement, the tone around tariffs is beginning to cool, hinting at possible de-escalation.
This development adds further bullish tailwinds to the broader market outlook.
✅ Summary:
We are leaning bullish here with the base-building process in motion. Key levels are aligning, volatility is easing, and clarity from corporate earnings could be the catalyst to propel markets upward.
Watch for a clean breakout above 5329 — that’s where the real confirmation begins. Eyes on the prize: 5878.58 👀📈
The Support and Resistance outlined in green and red are the respective support/resistance for this pair currently for 1M-1Y timeframes!
No Nonsense. Just Really Good Market Insights. Leave a Boost
TradeWithTheTrend3344

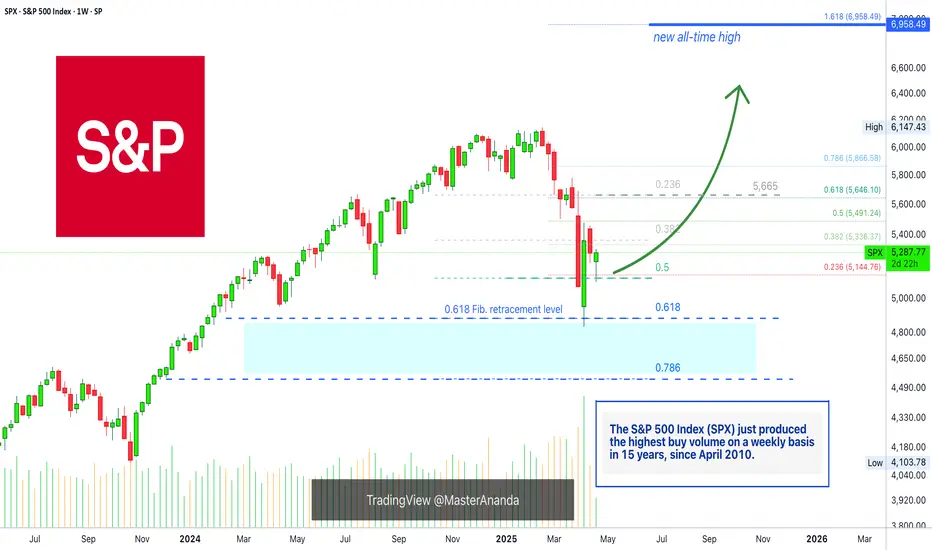
The SPX On Track To A New All-Time High In 2025 (6,958— Soon!)Do not let anybody distract you, do not allow yourself to be deceived. Know that the market is very resilient and this has been true for the longest time ever. The catastrophe that everybody is always expecting and is always due is never true. Ok, there was a correction, but that's it, from now on the market grows. That's just how it works.
Very, very strong bull markets, and the bear markets weak and short.
The S&P 500 Index (SPX) looks great right now and nothing can surpass the wisdom that comes from a chart. A chart cannot lie nor can mislead you in any way.
The charts have pure raw data, you can make your own interpretation of this data but there are no mistakes.
Here the chart shows a very strong higher low. The 0.5 Fib. retracement level was tested and it holds. Now, saying a "new All-Time High" might be speculation, but saying that prices will rise is simply how technical analysis works.
A low first pierced 0.5 and challenged 0.618 fib. The candle closed above and full green, the highest volume since 2010 and that is a clear signal that the correction reached its end.
The SPX is bullish now of course.
The next week we get a red week and this led to the present day, a higher low. A higher low is bullish and notice, the 0.618 level is no longer relevant. The correction that happened was really strong, there is absolutely no need for more.
So a strong correction developed and what comes next?
Prepare for a major rise, a new impulsive bullish wave.
The minimum target starts at 5,665. This is the resistance where the drop got started, this level needs to be tested based on TA. Depending on how this level is handled, we can extract how the market will continue to behave.
» I will make a prediction, the SPX will hit a new All-Time High in the coming months.
Thank you for reading.
Namaste.

US500 + Macro Radar Update | Mongoose Capital Macro DeskThe S&P 500 remains in a structurally elevated range around 5,612 following a technical bounce from recent lows. However, the broader macro environment continues to apply pressure beneath the surface.
The Macro Conditions Score prints 5/7 (71.4%), signaling a moderately restrictive backdrop. Meanwhile, the market-implied probability of a Fed Funds Rate cut sits at 52.25%, reflecting policy indecision rather than a definitive pivot.
Recession risk is cooling: the Recession Score has declined from 4/5 to 2/5 over recent months, indicating subsiding risk but not a full reset to expansionary conditions.
Yield curve signals remain inverted, though stabilization is emerging in key spreads (3M10Y, 2s10s). Fed policy sentiment remains neutral-to-hawkish, suggesting no immediate move toward accommodative policy.
📝 Institutional View:
This remains a macro-neutral market, not decisively risk-on. While equities have rebounded, the fundamental backdrop points toward a constrained upside without further improvement in liquidity or policy stance.
The rally is technical and positioning-driven, not yet macro-validated. The reduction in recession odds is positive but still within a tight policy leash.
“The market wants to believe. The data needs to confirm.”
Key Takeaways:
Tactical opportunities remain in place, but strategic positioning should remain selective.
Recession probability is declining but not eliminated.
The macro ceiling remains intact absent further loosening in financial conditions.
Published by Mongoose Capital | Macro Research Desk
(Chart: Mongoose Recession Radar Pro v1.6)

SPX Update: broken out of rising wedge. What Im seeing for now. Looking for a gap fill into tomorrow. My puts though are red, planning to swing my SPX puts. FOMC tomorrow, de-risk SP:SPX

Scalping ideasThis layout is specifically optimized for high-precision scalping on the SPX500 index. It features a clean, minimalistic design focused on speed, clarity, and efficiency. Key components include multiple timeframes (1-minute, 5-minute, and 15-minute charts) to monitor short-term price action and trend shifts. High-volume zones, VWAP, and dynamic support/resistance levels are plotted to capture key intraday reactions. Integrated order flow tools and real-time momentum indicators allow for quick decision-making during volatile moves. Perfect for active scalpers looking to catch micro-movements and capitalize on rapid price fluctuations with tight risk control.

SPY/QQQ ES/NQ 6 Mayo 2025Overall Market Context:
This image shows a multi-index SpotGamma-style Liquidity Map for:
SPY/SPX (top-left)
QQQ/NQ (top-right)
SPX Futures (bottom-left)
IWM (Russell 2000, bottom-right)
Each panel displays Gamma levels, Call/Put Walls, Zero Gamma zones, and Volatility Triggers to interpret potential support/resistance zones and expected market behavior.
🔹 Top-Left (SPY / SPX500USD Liquidity Map)
Resistance Zone: Around 558–560 (multiple “Target Corto” or Short Targets noted).
Support Zone: 553.58–555.00 (green zone marked as "Possible Buying Zone").
Call Wall at 575, Put Wall at 555 — this tightens the range.
Vol Trigger: 561 — above this could imply strength.
📌 Implication: Strong overhead resistance from 558–560. Breakdown below 555 may open downside targets to 553.58. Support expected around 555. Zone 553.58 is the last strong line of defense.

Algo Macro ResultsNot bad. Shows the amount of accuracy the algo has on picking trend. Pretty accurate imho.

S&P500 buy setup
1>Monthly ERL>IRL (hunted) so now the target is ERL
2>clear MMBM
3>all bullish OBs are being respected
4>DOL seems quite achievable
(i ll be looking for 1h cisd and building positions on each BOS)
Disclaimer:
this is my personal approach to the market not an investment idea/advice, do your own analysis before jumping on the trade.

S&P500 INTRADAY resistance at 5510US stock futures are signaling a second straight day of losses. Palantir shares dropped 9% pre-market after its earnings disappointed high expectations. Ford also fell, withdrawing its financial guidance and warning that new tariffs would hurt profitability.
In Europe, political uncertainty hit German markets as Friedrich Merz failed to secure a majority vote to become Germany’s next chancellor, delaying his swearing-in and shaking investor confidence. The DAX index slid 1.4% on the news.
Meanwhile, EU-US trade tensions are intensifying. The European Union expects new US trade probes could expose up to €549 billion ($622 billion) worth of EU exports to American tariffs, adding pressure to already strained transatlantic negotiations.
Key Support and Resistance Levels
Resistance Level 1: 5693
Resistance Level 2: 5780
Resistance Level 3: 5876
Support Level 1: 5512
Support Level 2: 5438
Support Level 3: 5390
This communication is for informational purposes only and should not be viewed as any form of recommendation as to a particular course of action or as investment advice. It is not intended as an offer or solicitation for the purchase or sale of any financial instrument or as an official confirmation of any transaction. Opinions, estimates and assumptions expressed herein are made as of the date of this communication and are subject to change without notice. This communication has been prepared based upon information, including market prices, data and other information, believed to be reliable; however, Trade Nation does not warrant its completeness or accuracy. All market prices and market data contained in or attached to this communication are indicative and subject to change without notice.

SPX500 D1 I Bullish Bounce Based on the D1 chart analysis, the price is falling our buy entry level at 5492.54, a pullback support.
Our take profit is set at 5797.53, an overlap resistance.
The stop loss is placed at 5386, a pullback support.
High Risk Investment Warning
Trading Forex/CFDs on margin carries a high level of risk and may not be suitable for all investors. Leverage can work against you.
Stratos Markets Limited (tradu.com):
CFDs are complex instruments and come with a high risk of losing money rapidly due to leverage. 63% of retail investor accounts lose money when trading CFDs with this provider. You should consider whether you understand how CFDs work and whether you can afford to take the high risk of losing your money.
Stratos Europe Ltd (tradu.com):
CFDs are complex instruments and come with a high risk of losing money rapidly due to leverage. 63% of retail investor accounts lose money when trading CFDs with this provider. You should consider whether you understand how CFDs work and whether you can afford to take the high risk of losing your money.
Stratos Global LLC (tradu.com):
Losses can exceed deposits.
Please be advised that the information presented on TradingView is provided to Tradu (‘Company’, ‘we’) by a third-party provider (‘TFA Global Pte Ltd’). Please be reminded that you are solely responsible for the trading decisions on your account. There is a very high degree of risk involved in trading. Any information and/or content is intended entirely for research, educational and informational purposes only and does not constitute investment or consultation advice or investment strategy. The information is not tailored to the investment needs of any specific person and therefore does not involve a consideration of any of the investment objectives, financial situation or needs of any viewer that may receive it. Kindly also note that past performance is not a reliable indicator of future results. Actual results may differ materially from those anticipated in forward-looking or past performance statements. We assume no liability as to the accuracy or completeness of any of the information and/or content provided herein and the Company cannot be held responsible for any omission, mistake nor for any loss or damage including without limitation to any loss of profit which may arise from reliance on any information supplied by TFA Global Pte Ltd.
The speaker(s) is neither an employee, agent nor representative of Tradu and is therefore acting independently. The opinions given are their own, constitute general market commentary, and do not constitute the opinion or advice of Tradu or any form of personal or investment advice. Tradu neither endorses nor guarantees offerings of third-party speakers, nor is Tradu responsible for the content, veracity or opinions of third-party speakers, presenters or participants.

S&P 500 2025 and 1998Interesting and striking similarities. I think this week either confirms this or invalidates the idea.

ETHEREUM LONGPECTRA UPGRADE may 07
Please be informed that the PECTRA system will undergo a scheduled upgrade on Tuesday, May 7.

SPX: Short term bearish to touch gap? And fill? Looking like there is apparently “no tariff talks” per China.
We’re still in such an uptrend, but looking for a short-term pull back on negative news. Also we have FOMC this week. Does Powell give what Trump and the people want, a rate cut?
I’m looking for 5678.33 to
- TP1: 5672.46
- TP2: 5635.06
Possible touch or fill gap of below 5603.21?
Let me know what you think. Do your DD, not FA. Let’s see what the week brings.

Week ahead analysis May 4th to 11th**Week Ahead Analysis (May 5 – May 11, 2025)**
### **Baseline: Market Expectations**
- **Tariffs & Fed Policy:** Trump's tariff announcement has heightened concerns about economic slowing, prompting bond markets to price in up to four Federal Reserve rate cuts this year.
- **Trade Talks & Sentiment Shift:** Reports suggest China may restart trade negotiations, boosting risk sentiment. However, China insists the U.S. must first remove all unilateral tariffs, adding uncertainty to the discussions.
- **Market Reaction:** Risk assets—equities and high-beta currencies like AUD, NZD, and CAD—are climbing as volatility cools. Meanwhile, safe havens such as JPY, CHF, and gold are facing selling pressure, though overall risk sentiment remains cautious.
### **Potential Surprise Scenarios**
- **Trade Deal Secured:** A deal would likely send equities higher, strengthen risk-sensitive currencies, and drive safe havens lower.
- **No Deal Reached:** In contrast, safe havens could gain while risk assets retreat.
### **Big Picture Outlook**
Regardless of the immediate outcome, the market's medium-term trajectory hinges on the broader effects of trade policy. If tariffs persist, economic uncertainty may sustain the Fed’s dovish stance. A successful trade deal, however, could restore confidence, shifting expectations back toward growth stabili

SP500 - technical analysis I expect it to increase from this moment if the 4h demand zone is valid, if not I expect it to reach the D demand zone and from there to have a reaction
Chart Called It S&P 500 Bottom on April 7 Confirmed the March 27On March 27, 2025, I published an analysis identifying the potential for a major bottom forming in the S&P 500 near 4,790.57:
Original chart and analysis
At that time, the index was consolidating just above key support, with growing downside pressure ahead of major economic reports. Despite broad caution in the market, the technical setup signaled a potential reversal.
The first rising channel developed in March, helping to support the rebound but it later broke to the downside, leading to another test of support. That move did not invalidate the broader structure.
On April 7, the S&P 500 made its cycle low at 4,835.04, just shy of the target. Since then, a second rising channel has formed, with higher lows and momentum supported by volume.
The price is now approaching major resistance at 5,822.
If it gets rejected, a pullback toward the rising trendline or the 5,438 area is likely. As long as price holds above the April 7 low and respects trendline support, the bullish structure remains intact. A confirmed breakdown below that support would increase the risk of a deeper retracement.
This progression underscores the importance of trusting price structure over sentiment.
The market followed the chart.
The bottom was April 7.
The call was made March 27.
The chart led the move.

S&P500 INTRADAY ahead of NFP, resistance at 5670The bulls are firmly in control as the S&P 500 heads for its ninth straight daily gain—the longest winning streak since 2004. Optimism is fuelled by:
Expectations of Fed rate cuts due to soft economic data
Hopes for renewed US-China trade talks, easing geopolitical risk
Strong risk appetite, with Bitcoin nearing $100,000 and equity momentum building
Key Risk Today – US Jobs Report:
April Nonfarm Payrolls expected at +138K, down from March’s strong beat
This is the first major labor data since new US tariffs, and could shift market expectations for Fed policy
Conclusion for S&P 500 Traders:
Momentum is bullish, but today’s NFP report is a key risk event. A weaker-than-expected jobs number could reinforce rate cut bets and extend the rally. A surprise beat may trigger profit-taking.
Key Support and Resistance Levels
Resistance Level 1: 5670
Resistance Level 2: 5740
Resistance Level 3: 5820
Support Level 1: 5440
Support Level 2: 5385
Support Level 3: 5316
This communication is for informational purposes only and should not be viewed as any form of recommendation as to a particular course of action or as investment advice. It is not intended as an offer or solicitation for the purchase or sale of any financial instrument or as an official confirmation of any transaction. Opinions, estimates and assumptions expressed herein are made as of the date of this communication and are subject to change without notice. This communication has been prepared based upon information, including market prices, data and other information, believed to be reliable; however, Trade Nation does not warrant its completeness or accuracy. All market prices and market data contained in or attached to this communication are indicative and subject to change without notice.
