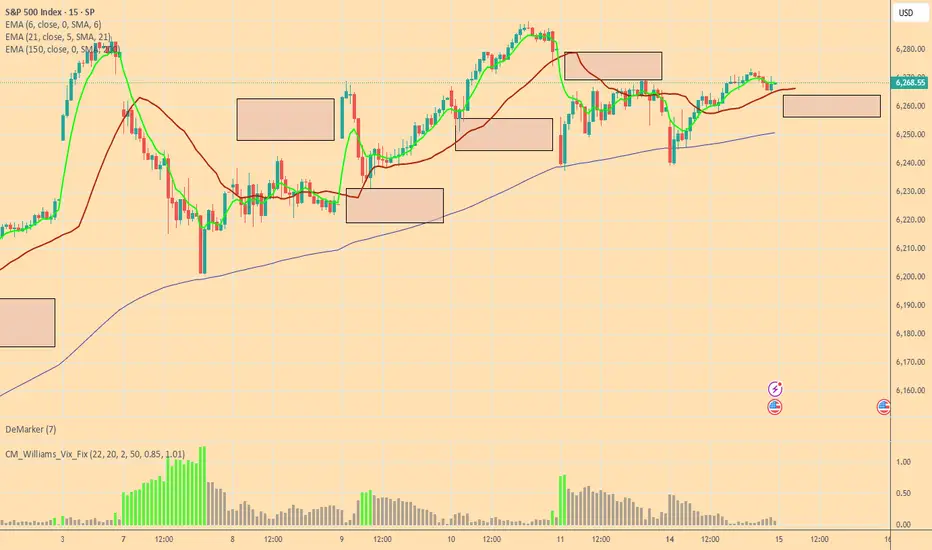
SPX500 LongThere is a lot of support at this level
There is a shark pattern on M15 and M30
All timeframes are oversold and there are multiple bottoms with divergence
This trade is with the trend
25 Pip stop loss
SPCUSD trade ideas

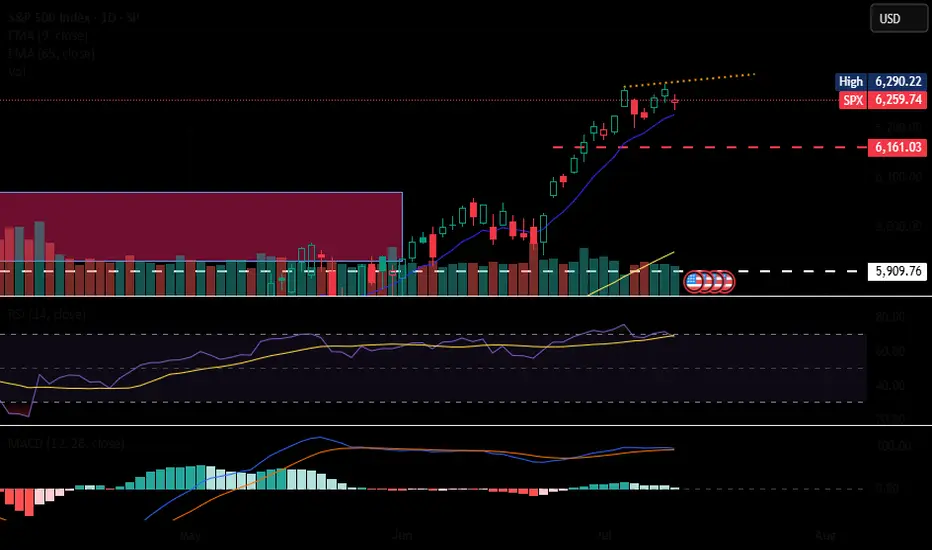
Bulls and Bears zone for 07-15-2025ETH session market is trading higher and expected to Open gap up.
Would traders be able to keep that momentum going rest of the RTH session.
Level to watch: 6328 --- 6330
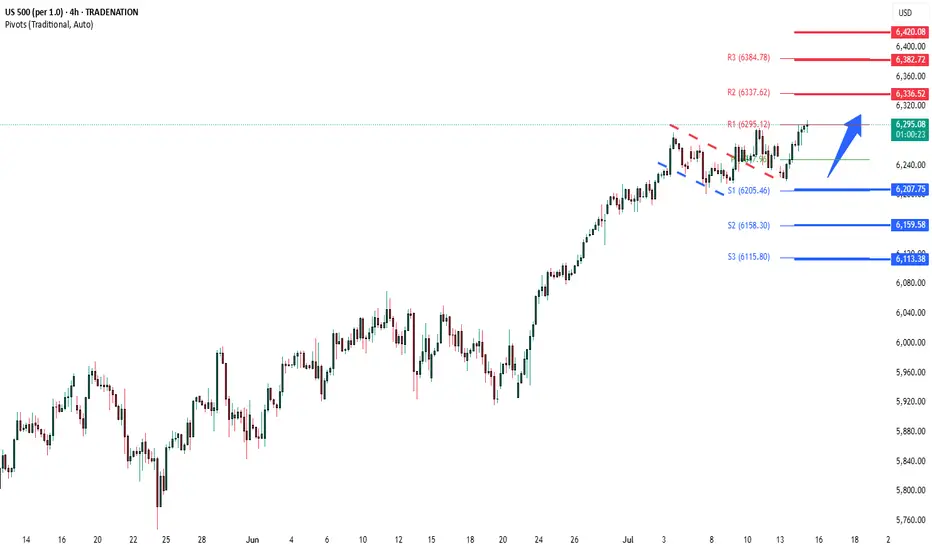
S&P500 Bullish breakout supported at 6207Trump’s $3.4 Trillion Tax Plan
Favors wealthy investors: Tax burden shifts based on how you earn, not how much.
Winners: Business owners, investors, high-income earners.
Losers: Immigrants, elite universities.
Trade Tensions
EU Tariffs: Brussels targets $72B in US goods (e.g., Boeing, cars, bourbon) in response to Trump’s tariff threats.
Impact: Risk to transatlantic trade; US open to talks.
US-China Tech Relations
Nvidia: Resumes H20 AI chip sales to China after US approval—boosted chip stocks.
Trump: To announce $70B in AI & energy investments today in Pennsylvania.
Trend: Signs of easing tensions between US and China.
Earnings Focus: Big US Banks
Q2 results (JPM, Citi, WFC, BNY Mellon, BlackRock) will highlight:
Net interest income: How rate levels affect profits
Loan growth & credit quality: Signs of lending strength or weakness
Capital markets activity: Trading & investment banking trends
Key Support and Resistance Levels
Resistance Level 1: 6335
Resistance Level 2: 6380
Resistance Level 3: 6420
Support Level 1: 6207
Support Level 2: 6160
Support Level 3: 6115
This communication is for informational purposes only and should not be viewed as any form of recommendation as to a particular course of action or as investment advice. It is not intended as an offer or solicitation for the purchase or sale of any financial instrument or as an official confirmation of any transaction. Opinions, estimates and assumptions expressed herein are made as of the date of this communication and are subject to change without notice. This communication has been prepared based upon information, including market prices, data and other information, believed to be reliable; however, Trade Nation does not warrant its completeness or accuracy. All market prices and market data contained in or attached to this communication are indicative and subject to change without notice.
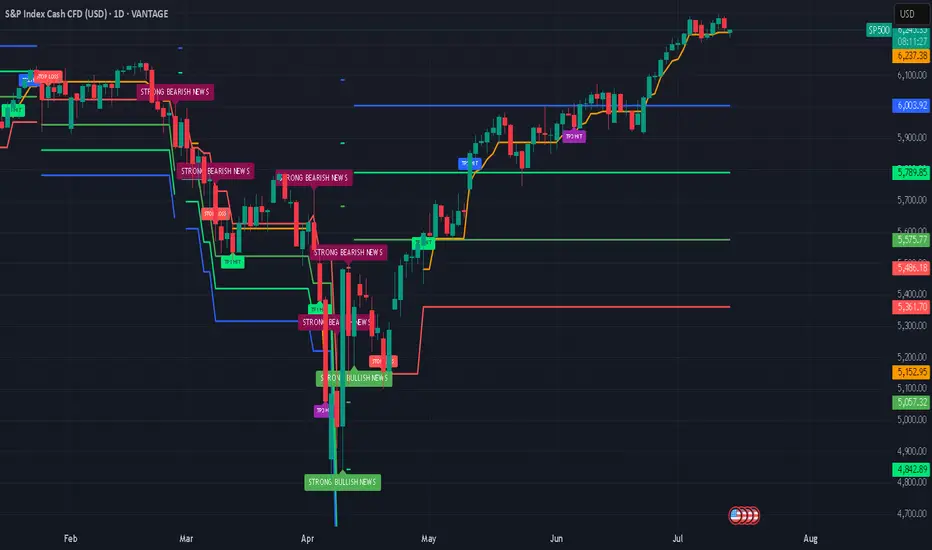
S&P 500: Defying Tariff Headwinds, Breaking RecordsThe S&P 500 has staged a remarkable rally in 2025, shattering all-time highs and capturing global attention. This surge has unfolded despite the negative economic overhang of renewed tariff threats and ongoing trade tensions, raising critical questions for investors: How did the market overcome such headwinds, and what lies ahead for both the short and long term?
The Rally Against the Odds
Tariff Turbulence: Earlier this year, President Trump announced sweeping new tariffs, sparking fears of supply chain disruptions and higher costs for American companies. Historically, such moves have triggered volatility and corrections.
Market Resilience: Despite these concerns, the S&P 500 not only recovered losses from the spring but surged to new record highs, with the index climbing over 23% since April’s lows. Major tech companies, especially those leading in AI and innovation, have been at the forefront of this advance.
Investor Sentiment: The rally has been fueled by optimism around potential Federal Reserve rate cuts, robust corporate earnings, and expectations of long-term economic growth—even as the immediate impact of tariffs remains uncertain.
Short-Term Correction: A Healthy Pause?
While the long-term outlook remains bullish, several indicators suggest the market may be due for a short-term correction:
Narrow Market Breadth: The current rally has been driven by a handful of mega-cap stocks, leaving the median S&P 500 stock well below its own 52-week high. Historically, such narrow leadership often precedes periods of consolidation or pullbacks.
Valuation Concerns: Stock valuations are at elevated levels, and some analysts warn that earnings growth could slow as companies adapt to higher input costs and shifting trade policies.
Correction Forecasts: Some strategists predict the S&P 500 could correct to around 5,250 by the third quarter of 2025, citing factors like slowing consumer spending and persistent policy uncertainty.
Long-Term Outlook: Higher Highs Ahead
Despite the potential for near-term volatility, the long-term trajectory for the S&P 500 remains positive:
Fed Policy Tailwinds: Anticipated rate cuts and lower bond yields are expected to provide further support for equities, encouraging risk-taking and higher valuations.
Corporate Adaptation: Companies are actively offsetting tariff impacts through cost savings, supply chain adjustments, and strategic pricing.
Growth Sectors: Innovation in technology, productivity gains, and deregulation are setting the stage for sustained profit growth, especially in sectors like AI, robotics, and defense.
Key Takeaways for Investors
Stay Disciplined: While a short-term correction is possible, history shows that markets often rebound strongly after periods of volatility.
Diversify Exposure: With market gains concentrated in a few names, diversification and active stock selection are more important than ever.
Focus on Fundamentals: Long-term investors should look beyond headlines and focus on companies with resilient earnings and adaptive business models.
The S&P 500’s ability to break records in the face of tariff headwinds is a testament to the underlying strength and adaptability of the U.S. economy. While short-term bumps are likely, the path ahead still points toward new highs for those with patience and perspective.
This article is for informational purposes only and does not constitute investment advice. Always consult with a financial advisor before making investment decisions.
#spx500 #stockmarket #analysis #economy #us #nasdaq #fed #bonds #rates #trading
S&P500 Slips Ahead of CPI & Earnings SeasonEquities began the week under pressure, with the S&P 500 dropping 0.5%, slipping below the 6,230-resistance area. Although the Fed minutes released last week indicate that most members are open to cutting rates this year, inflation data and second-quarter earnings could change that trajectory.
Upcoming Events to Watch:
• CPI Release (Tuesday 14:30 SAST): A cooler-than-expected print would support a breakout in risk assets. A hot reading could shift expectations toward policy tightening, weighing on equities.
• Q2 Earnings Season: Major banks including JPMorgan Chase, Wells Fargo, and Citigroup will report this week. Strong earnings may cushion the market, while any weakness could exacerbate volatility.
S&P500 Technical View:
• Immediate Resistance: 6,230
• Potential Upside: A cooler CPI could see the index rally toward 6,290.
• Support Levels: Should inflation surprise to the upside, the index may slide to 6,190, or even 6,150 in extended selling.

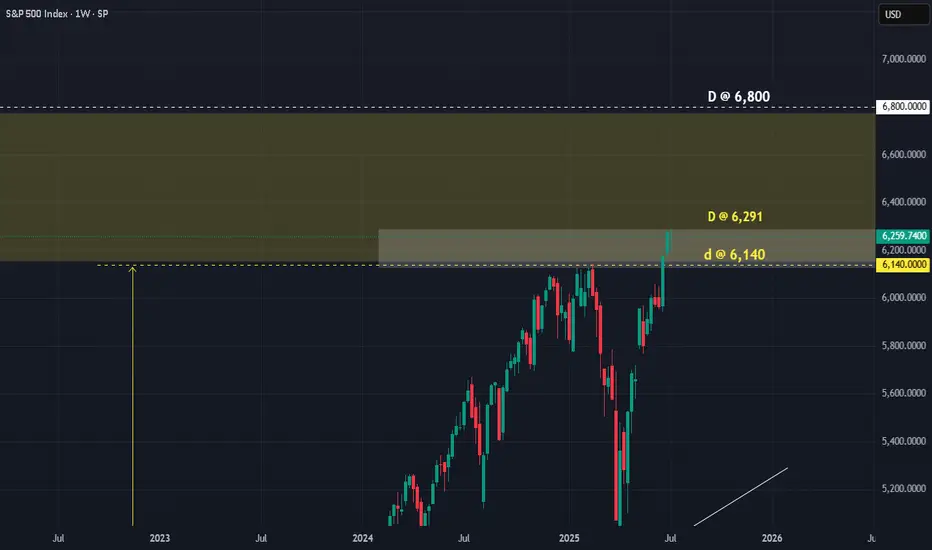
SPX : How to play this DPrice has now reached our target as anticipated. The question is, when do we SELL?
Anyway, for those who follow the D, I am sure it has saved you guys a lot of trouble. At least you know where/when to start SELLING. Many others who started selling EARLy had all lost their money.
As we can see, there are 3 D's. Price can still move UP to 6,800. Bear that in mind. Or has already reached the max at 6,291!!!
Price is at where they are, there are 2 choices:
a) SELL now and SL @ 6,300
b) SELL when price touched the lower D @ 6,140 with SL @ 6,291
Whichever way, the R/R is still FANTASTIC.
It is true that MARKET MAKER might still take advantage and try to screw short sellers. But even they would find it hard at the D. For even they need to respect it a bit.
If you know your D, you trade safer.
Good luck.
SP500, above the GAP bullish, below the GAP…As simple as it can be. Below the GAP, very bearish.
Ideally, a sharp move down would confirm
My bias.

$SPXSP:SPX Update:
Rumors of Powell possibly resigning as Fed Chair have created uncertainty among buyers.
But if inflation stays low even with tariffs we might see longer holds.
If Powell does step down, markets could actually rally on hopes of upcoming rate cuts.
📉📈
Now we wait for the inflation report…
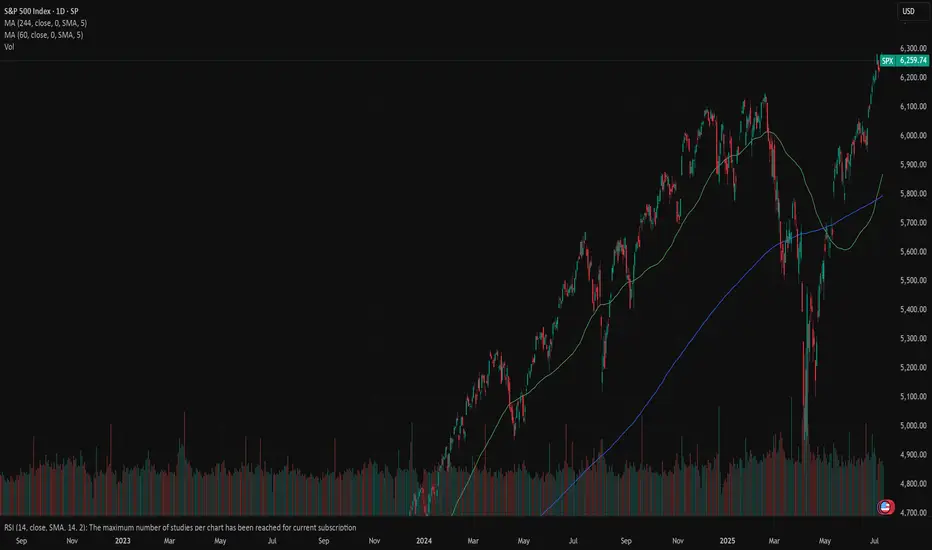
SPX: earnings sentiment aheadPrevious week was another optimistic week on financial markets. Regarding the approaching deadline for a delay in the application of trade tariffs set by the US Administration, which came due on July 9th, the market did not show much of a concern. The green trend line of the S&P 500 continued during the week, where the index managed to reach another new all time highest level on Thursday, at 6.290. During the previous week there has not been any currently important US macro data posted, in which sense, the market sentiment remained optimistic. However, Friday's news regarding trade tariffs spoiled a bit of an up-trend, so the index ended the week, just a bit lower from its ATH level, at 6.259.
Weekly tariffs news include a 35% imposed tariffs on imports from Canada, and 50% on goods imported from Brazil in the U.S. There are also some comments on a potential increased universal 10% tariff on the majority of other nations, noting 15% and 20%, as well as a 50% tariff on copper. Analysts are noting that the market is already adjusted to the comments regarding trade tariffs, in which sense, there are no more strong market reactions on any incoming news.
The week ahead brings some important US macro data, as well as gearing up for the earnings season, starting with major banks like JPMorgan. The June inflation data as well as PPI will be posted in the week ahead, closing with University of Michigan Consumer Sentiment. This data might bring back some volatility to the S&P 500, however, the general investors sentiment remains positive at this moment.
SP500 weekly balance?JUst some ideas while looking at weekly charts. We've put in a doji on the week - indecision. A pullback to 6100 would start raising flags about a possible false breakout from balance.

SPX500USD | Retesting All-Time HighsThe index has extended its bullish rally, printing a new local high at 6,286.5 before showing signs of slight hesitation with consecutive small-bodied candles.
Support at: 6,134.5 / 6,026.0 / 5,926.2 🔽
Resistance at: 6,286.5 🔼
🔎 Bias:
🔼 Bullish: Sustains above 6,134.5 and breaks 6,286.5 for new highs.
🔽 Bearish: Break below 6,134.5 could trigger a retracement toward 6,026.0.
📛 Disclaimer: This is not financial advice. Trade at your own risk.

Is SP500 / US M2 Money Supply telling us a story?Historically this ratio has inflected from key levels. Last week the upper boundary of what 8 would call a normal range has acted as support. If history rhymes to dot com bubble, this AI bubble can bounce from these levels and see an increase until Q4 2026, then a sharp fall will follow. To the lower boundary of that normal range.

US500 Is Bullish! Long!
Here is our detailed technical review for US500.
Time Frame: 3h
Current Trend: Bullish
Sentiment: Oversold (based on 7-period RSI)
Forecast: Bullish
The market is trading around a solid horizontal structure 6,252.40.
The above observations make me that the market will inevitably achieve 6,297.19 level.
P.S
Overbought describes a period of time where there has been a significant and consistent upward move in price over a period of time without much pullback.
Disclosure: I am part of Trade Nation's Influencer program and receive a monthly fee for using their TradingView charts in my analysis.
Like and subscribe and comment my ideas if you enjoy them!

SPX500 in a Powerful Wave 3 Expansion – New Highs on the HorizonMarket Analysis – SPX500 (S&P 500 Index CFD)
The SPX500 is currently exhibiting a strong bullish structure, consistent with the characteristics of an Elliott Wave 3 extension. This wave phase is typically the most powerful and impulsive part of a bullish cycle, often driven by increasing market confidence, strong macroeconomic fundamentals, and institutional accumulation.
After completing a textbook corrective Wave 2, the index has broken key resistance levels with strong momentum, confirming the beginning of Wave 3. What sets this phase apart is its capacity to generate accelerated gains, often surpassing expectations and historical highs.
Key signs supporting the Wave 3 hypothesis:
High volume breakout from consolidation zones.
Higher highs and higher lows structure on multiple timeframes.
Confirmation from supporting indicators such as RSI holding above 50 and MACD showing strong upward momentum.
What’s next?
As long as market structure remains intact and no significant bearish divergence appears, we can expect multiple new all-time highs to be formed during this wave. Traders should look for retracement entries using Fibonacci levels (e.g., 38.2% or 50% pullbacks) to ride the trend while managing risk carefully.
Outlook:
Bullish bias remains strong. Strategic buying during minor corrections could offer favorable risk-reward setups throughout the progression of this wave.

SPX500 SPX appears to be running SSL. 4H levels identified. Looking for Break & retest. If support does not hold on to any level, expect the bulls to return and take over.

IS THE STOCK MARKET HEADING INTO DOT COM BUBBLE 2.0?In this video we look at the 3 month chart of SP:SPX using the traders dynamic index & Fibonacci retracement levels to put together a bullish case for the overall stock market to go on a monster rally over the next 7 years
We also theorize about how over the next 2 years the SP:SPX can indeed hit 7200+ by Q3 2026 and have pullbacks to 5800-6100, but how that could just be the "consolidation move in price" of the overall stock market before we get what could end up being the largest stock market rally we have ever seen in the 21st century

ASCENDING WEDGE ON WATCH - ELLIOTT WAVE 3 NEARLY COMPLETEThe WAVE 3 extension can go further but it seems likely that coinciding with earnings this month we will have the potential for the start of WAVE 4 retracement.
The possible resignation of Jerome Powell could further intensify the charts.
AlphaTrend is an advanced trading indicator that leverages proprietary tools, real-time data, and custom metrics to give traders a competitive edge. Designed for all experience levels, it works instantly—no advanced charting skills required.
ADVANCED and PRO versions are available. (See below)
🔍 How It Works
At the core of AlphaTrend is Dynamic Reversion Bands — a sophisticated real-time system that adapts to price action by automatically adjusting to evolving market conditions.
These bands act like a roadmap, helping traders identify:
Mean reversion trade opportunities
Trend strength
Emotion-driven market conditions (like FOMO)
The system is rooted in Mean Reversion Theory:
If an asset's price deviates significantly from its historical average, it tends to “revert” back to that average over time. Traders can use this behavior to spot potential buying or selling opportunities:
Overbought Conditions: If the price moves too far above the mean, it may signal a pullback—traders might sell or short.
Oversold Conditions: If the price drops well below the mean, it may be undervalued—traders might buy in anticipation of a bounce.
⚪🟡🔴🟡⚪ Dynamic DOTS
AlphaTrend visualizes market overextension through dynamic DOTS:
White DOTS = Average conditions
Yellow DOTS = Above average conditions
Red DOTS = Extreme conditions
The DOTS update in real time as the candle is forming—appearing, disappearing, and shifting color based on current intensity levels. Once the candle closes, however, the DOTS do not repaint. This ensures clarity and confidence in every signal.
This is crucial, as many indicators repaint and revise data after the fact, undermining traders’ trust. With AlphaTrend, once a candle closes, the data remains permanently fixed.
📊 Adaptability and Market Insight
AlphaTrend adapts to any timeframe, but performs best on longer-duration candles, where signals are fewer but more reliable. Multi-interval displays (e.g., 1hr, 4hr, Daily) are highly recommended. That being said it does tend to give strong signals on all time frames even down to 1 min candles.

SPX Breakdown or Another Push Higher?Hi y'all thanks for tuning in! Here are a few written notes to sum up the video.
Indecision at New Highs
After breaking out to new all-time highs, SPX printed a doji on the weekly chart, signaling indecision. This hesitation could mark the start of digestion.
Still Structurally Bullish, but Extended
The weekly chart shows SPX is still holding trend structure, but price is notably extended from the 10EMA. Historically, when price moves too far from key short-term EMAs, it tends to reset either via time (sideways chop) or price (pullback).
Daily Chart Shows a Shelf Forming
On the daily chart, price has been consolidating just under the prior high with small-bodied candles. This is forming a “shelf” around the 6,260–6,280 zone. It’s acting like a pause, not a breakdown. Holding above this zone keeps the trend intact.
Pullback Risk Increases Below 6,232
If price loses 6,232 (last week's breakout area and short-term shelf), it increases the likelihood of a pullback toward the 6160 or even deeper toward the 5970. That lower zone also marks the bottom of the prior consolidation box from earlier this year.
Seasonality Reminder
Historically, July is strong in the first half, with weakness (if it shows up) arriving mid-to-late month. So far, price has tracked that seasonal strength. Any weakness from here would align with that typical timing.

S&P 500 - Medium Timeframe AnalysisAs illustrated, we appear to be in the final wave to the upside. At this stage, I’m treating Wave 5 as a standard impulse. However, given that Wave 4 retraced deeply, nearly to the termination point of Wave 1, there remains a modest possibility that this higher-degree Wave 5 in gray, which began in 2020, could ultimately unfold as an ending diagonal. That said, this scenario remains highly unlikely, as the internal structure of the preceding waves does not exhibit the characteristics of corrective price action.

More upside after correction for SPX500USDHi traders,
Last week SPX500USD went a little more up (diagonal) just as I've said in my outlook.
Next week we could see the start of a bigger correction down (grey wave 4) and a break of the dotted trendline. Or the diagonal is a leading diagonal wave 1 and grey wave 3 extends more.
Let's see what the market does and react.
Trade idea: Wait to see if price breaks the dotted trend line (for shorts) or not (for longs).
If you want to learn more about trading FVG's & liquidity sweeps with Wave analysis, then please make sure to follow me.
This shared post is only my point of view on what could be the next move in this pair based on my technical analysis.
Don't be emotional, just trade your plan!
Eduwave

SPX GEO+ Cycle Update: "SPX: April Low Called, Target 8000+"SPX GEO+ Cycle Update: April Low Called Precisely (Next Target: 8000)
On January 5th, 2025, when SPX was trading at 5942, I published an analysis in Italian using my GEO+ Cycle methodology that made two specific projections:
📉 A low around 5000 in April 2025
📈 Then an advance targeting 8000 by 2026
Update: April delivered exactly as projected.
The geometric patterns suggested April would mark a significant turning point, and the market found strong support right in the anticipated zone and timeframe.
About GEO+ Cycles:
After 15 years studying market geometry, I've developed a framework that identifies multi-decade structural patterns. These aren't traditional technical indicators—they're mathematical relationships that help project major turning points with remarkable precision.
Current Phase:
We're now in the advancing phase of this cycle. Based on geometric projections, the target window for 8000 remains January 2026.
Important Context:
This represents cycle analysis for educational purposes, not trading advice. The methodology focuses on identifying major structural turning points rather than short-term movements.
What's Next:
I'll continue tracking this cycle's development and provide updates as we approach key geometric levels.
For those interested in learning more about geometric market analysis, feel free to follow for updates on this and other cycle progressions.
The mathematics of market geometry continue to unfold...
Note: Originally published in Italian, now sharing these insights with the global TradingView community.

Macroeconomic analysis of the American marketHello investor friends,
today I bring an update on the macro economic state of the American economy which generally moves markets around the world.
From the graph we can see the S&P 500 index on which 4 lines have been superimposed which coincide with:
- FED interest rate
- FED balance sheet
- US inflation rate
- US unemployment rate
The vertical line on the graph coincides with the date of the last update I made 5 months ago.
The central bank decides interest rates and the injection of money with the aim of keeping inflation low and avoiding too much unemployment.
At the moment we have:
- Unemployment rate at 4% (remained unchanged)
- Inflation at 2.4% (decreased compared to 5 months ago)
- The balance / release of printed money (continues to fall)
- The interest rate remained unchanged (current 4.33%)
Compared to 5 months ago the situation seems to have improved and is quite stable. The FED has decided to keep rates unchanged due to political issues as it would like to see clearly before making cuts.
In general we can say that the situation seems quite good as, unemployment is low, inflation is at optimal levels, we see that the budget/money injection is decreasing and therefore leads to maintaining regular inflation and finally the interest rates being stable maintain a low level of unemployment.
Given these factors we see that since the last update 5 months ago (i.e. in February), in the following weeks there was a collapse due to Trump's policies but that it was certainly an excellent opportunity to increase positions given that the macroeconomic situation was positive as it currently is.
From today we could certainly expect further declines due to other monetary policies or other news, but as long as the macro situation is positive we have no reason to worry.
👍 Like if you want more macro updates in the future
🙋♂️ Follow me so you don't miss my future analyses
⚠️ Disclaimer: This post is for informational purposes only and does not constitute financial advice. Always do your research before making investment decisions.
SP:SPX FRED:SP500 VANTAGE:SP500 AMEX:SPY VANTAGE:DJ30 AMEX:DIA CME_MINI:NQ1! FX:NAS100 NASDAQ:QQQ FX:EUSTX50 FOREXCOM:GER40 FX:AUS200

S&P 500 Daily Chart Analysis For Week of July 11, 2025Technical Analysis and Outlook:
During this trading week, the S&P 500 Index has shown a predominantly downward/upward course of action and created a new Key Resistance at 6280. Currently, the index exhibits a bullish bias, with the Outer Index Rally objective set at 6420. However, it is crucial to note that the current price action may cause prices to see in a new light from their current fluctuation to push toward the Mean Support at 6200 before resuming their upward movement.
